Chapter 8. Resilience
This chapter focuses on application resilience, which is the ability to survive situations that might otherwise lead to failure. Unlike other chapters that focused on services external to the Node.js process, this one mostly looks within the process.
Applications should be resilient to certain types of failure. For example, there are many options available to a downstream service like web-api when it is unable to communicate with an upstream service like recipe-api. Perhaps it should retry the outgoing request, or maybe it should respond to the incoming request with an error. But in any case, crashing isn’t the best option. Similarly, if a connection to a stateful database is lost, the application should probably try to reconnect to it, while replying to incoming requests with an error. On the other hand, if a connection to a caching service is dropped, then the best action might be to reply to the client as usual, albeit in a slower, “degraded” manner.
In many cases it is necessary for an application to crash. If a failure occurs that an engineer doesn’t anticipate—often global to the process and not associated with a single request—then the application can potentially enter a compromised state. In these situations it’s best to log the stack trace, leaving evidence behind for an engineer, and then exit. Due to the ephemeral nature of applications, it’s important that they remain stateless—doing so allows future instances to pick up where the last one left off.
Speaking of crashing, there are a number of ways that an application can exit, intentionally or otherwise. It’s worth looking at these before diving into the ways the application can be kept alive and healthy.
The Death of a Node.js Process
There are many ways that a Node.js process can be terminated, and unfortunately, Node.js is sometimes helpless to prevent some of them. For example, a native module running compiled C++ code could cause a segfault, the process could receive the SIGKILL signal, or someone could trip over the server’s power cord. It’s important to build systems that are resilient to such problems. However, as for the Node.js process itself, it can’t do much about its own termination in such situations.
The process global is an EventEmitter instance, and when the process exits it will usually emit an exit event. This event can be listened for to perform final cleanup and logging work. Only synchronous work can be executed when this event is triggered. The event won’t always be called when a process terminates, like in a catastrophic event such as running out of memory.
When it comes to intentionally terminating a process from within (or preventing termination), there are a few options available. Table 8-1 contains a list of some of these situations.
| Operation | Example |
|---|---|
Manual process exit |
|
Uncaught exception |
|
Unhandled promise rejectiona |
|
Ignored error event |
|
Unhandled signals |
|
a As of Node.js v14.8, the | |
Most of the entries in this list deal directly with failure scenarios, such as uncaught exceptions, unhandled rejections, and error events. Signals received from external processes are another interesting situation. However, only one of these has to do with cleanly and intentionally exiting the process.
Process Exit
The process.exit(code) method is the most basic mechanism for terminating a process and is useful in many scenarios where an error isn’t necessarily involved. For example, when building a CLI utility, the process.exit() may be relied on to terminate a process once it has completed its given task. It’s almost like an overpowered return statement.
The code argument1 is a numeric exit status code within the range of 0 and 255. By convention, a 0 means that the application terminated in a healthy manner, and any nonzero number means that an error occurred. There isn’t necessarily a standard for defining what the different nonzero exit values represent (as opposed to HTTP, which has well-defined numeric status codes). Instead, it’s usually up to the application to document what the different exit status codes mean. For example, if an application requires a set of environment variables that happen to be missing, it might exit with a 1, and if expects to find a configuration file that is missing, it might exit with a 2.
No messages are printed to stdout or stderr by default when process.exit() is called. Instead, the process just ends. For that reason, you may want to emit a final message before the program ends so that someone running the application has an idea of what went wrong. As an example of this, run the following code:
$node -e"process.exit(42)";echo$?
In this case, you should only see the number 42 printed. The number is printed for you by your shell, but the Node.js process doesn’t print anything. But what went wrong? A quick look at the logs won’t provide any help.2
Here is an example of a more verbose approach that an application might employ if it needs to exit at startup when misconfigured:
functioncheckConfig(config){if(!config.host){console.error("Configuration is missing 'host' parameter!");process.exit(1);}}
In this case, the application prints a message to stderr, which makes the life of whoever is running the process easier. The process then exits with a status code of 1, which is useful for conveying to a machine that the process has failed. When process.exit() is encountered, none of the code that follows it will run. It effectively terminates the current stack much like a return statement would (in fact, your IDE may highlight code following this line as dead-code).
Tip
The process.exit() method is very powerful. While it does have its purpose within Node.js application code, an npm package should almost never make use of it. Consumers of libraries expect to be able to handle errors in their own way.
Status codes are used in a lot of situations. For example, when unit tests run as part of continuous integration, a nonzero exit status informs the test runner (such as Travis CI) that the test suite has failed. Of course, it would be tedious to have to manually go through and add process.exit(1) calls all over a test suite. Thankfully, test suite runners handle that for you. In fact, any time an application throws an error that doesn’t get caught, it will default to producing an exit status of 1. The following example shows this happening:
$node -e"throw new Error()";echo$?
In this case, you should see a stack trace printed, followed by the number 1 on a line of its own. Thrown errors warrant a bit more discussion.
Exceptions, Rejections, and Emitted Errors
Using process.exit() is nice for early startup errors, but sometimes you need something more contextual. For example, when a runtime error happens in the middle of an application’s lifetime, like during a request handler, something bad happening probably isn’t a foreseeable error like missing configuration. Instead, it’s likely due to some untested logic branch or an otherwise weird edge case. When this happens, the application owner needs to know where the problem happened. That is where the Error object comes in.
Before discussing errors too much, it’s useful to define a few terms—especially since they’re often conflated:
- Error
-
Erroris a global object available in all JavaScript environments. When anErroris instantiated it has some metadata attached to it, such as the name of the error, a message, and a stack trace string. This metadata is provided as properties on the resulting object. Merely instantiating anErrorisn’t that big of a deal (though there’s some performance impact when it comes to generating the stack trace) and doesn’t yet affect control flow—that happens later when it is thrown. It’s common to “subclass” an error by extending from it and creating more specific errors. - Throw
-
The
throwkeyword creates and throws an exception. When one of these is encountered, the current function will stop being executed. The exception is then “bubbled up” through the functions that called your function. When this happens, JavaScript looks for any try/catch statements that have wrapped any of the shallower function calls. If one is encountered, thecatchbranch is called. If none are encountered, the exception is then considered uncaught. - Exception
-
An
Exceptionis something that has been thrown. Technically you can throw anything, even a string orundefined. That said it’s considered bad form to throw anything that isn’t an instance of, or extended from, theErrorclass. This also applies when it comes to rejecting promises, providing error arguments to callbacks, or emitting errors. - Rejection
-
A Rejection is what happens when a promise fails or when an exception is thrown within an
asyncfunction. The concept is similar in nature to an exception, but it does need to be handled in slightly different ways, so it deserves a name of its own. - Error swallowing
-
Capturing an error and completely disregarding the outcome, including not logging the error to the console, is considered “swallowing an error.”
When an exception is thrown or a promise is rejected, it needs to be handled in some manner. When completely ignored it leads to an application crash—for example, an uncaught error will crash a Node.js process. Swallowing errors is universally a bad practice and will come back to bite you. However, checking if a specific anticipated error is thrown before swallowing it isn’t necessarily the end of the world.
Consider the following example of a swallowed error:
constlib=require('some-library');try{lib.start();}catch(e){}// Sometimes lib throws even though it workslib.send('message');
In this case, the some-library author has decided to throw an innocuous error, one that doesn’t actually affect the operation of the library. Perhaps it throws an error when the first database host it tries to connect to cannot be reached, even though the second host that it can connect to is reached. In this case, the catch branch is swallowing that connection fallback error. Unfortunately, it’s also throwing any other error that the lib.start() method might be throwing.
For example, you might find that when the some-library gets upgraded, it begins throwing another error, one that is a big deal. This usually leads to hours of debugging before finally finding the source of the underlying issue. For this reason, swallowing all errors is bad.
To swallow only a specific error, you might instead change the code to look like this:
catch(e){if(einstanceoflib.Errors.ConnectionFallback){// swallow error}else{throwe;// re-throw}}
In this case, the exception is only swallowed if it is a specific error instance, otherwise it is rethrown again. This particular example assumes that a library author was thoughtful enough to export subclassed error instances. Unfortunately this often isn’t the case (not to mention instanceof checks can be tricky with a complex npm package hierarchy). Sometimes a library author might subclass errors but not export them. In those cases, you can check the .name field, for example by using e.name === 'ConnectionFallback'.
Another convention—popularized by Node.js itself—for differentiating errors works by providing a .code property, which is a string named in a documented and consistent manner and that shouldn’t change between releases. An example of this is the ERR_INVALID_URI error code, and even though the human-readable message of the string may change, the error code should not. This pattern unfortunately isn’t that popular yet amongst package authors either, though when a package surfaces a Node.js-produced error, the .code property should be present.
The most common approach for targeting specific errors is to parse the actual .message field. When doing this, your application will need to inspect text meant for human consumption—for example, using e.message.startsWith('Had to fallback'). This is unfortunately quite error prone! Error messages often have typos, and well-meaning contributors make PRs to fix them all the time. Such updates are usually released as a Semver patch release and may then break an application that inspects the error message string.
Warning
Unfortunately, there’s currently no perfect solution to the error-differentiation problem in the Node.js ecosystem. As a package author, always be intentional with the errors you provide and try to export error subclasses or provide a .code property. As a module consumer, offer pull requests for libraries that provide multiple errors in the same operation without a mechanism to programmatically differentiate them.
When the error is thrown and remains uncaught, the stack trace for the error is printed to the console and the process exits with a status of 1. Here’s what an uncaught exception looks like:
/tmp/error.js:1
throw new Error('oh no');
^
Error: oh no
    at Object.<anonymous> (/tmp/foo.js:1:7)
    ... TRUNCATED ...
    at internal/main/run_main_module.js:17:47
This output has been truncated, but the stack trace suggests that the error was thrown at line 1, column 7 of a file located at /tmp/error.js.
There is a way to globally intercept any uncaught exceptions and run a function. The global process object is an instance of the EventEmitter class. One of the many events it can emit is the uncaughtException event. If this event is listened for, the callback function will be invoked and the process itself will no longer automatically exit. This is useful for logging information about a failure before exiting a process, but by no means should you use it to swallow errors globally! Errors should always
be dealt with contextually by wrapping appropriate function calls in try/catch
statements.
The following is an example of how the handler might be used to log a final distress message:
constlogger=require('./lib/logger.js');process.on('uncaughtException',(error)=>{logger.send("An uncaught exception has occured",error,()=>{console.error(error);process.exit(1);});});
In this case, the logger module represents a library that sends logs over the network. Here, the exception is caught; the log message is transmitted; and once it has been sent, the error is printed to the console and the process exits. Presumably, calling process.exit() immediately after calling logger.send() might result in the process being killed before the message can be transmitted, which is why the callback needs to be awaited for. While this is one way to help ensure asynchronous messages are sent before terminating a process, it is unfortunate that the application may still be allowed to process other tasks, since whatever caused the first uncaught exception might be repeated.
Promise rejections are similar to exceptions. Promise rejections can happen in one of two ways. The first way is by calling Promise.reject() directly, or by otherwise throwing an error within a promise chain (like in a .then() function). The other way to cause a promise rejection is by throwing while inside of an async function (within an async function, the JavaScript language changes the semantics of throw statements). The following two examples both result in equivalent promise rejections (albeit with slightly different stack traces):
Promise.reject(newError('oh no'));(async()=>{thrownewError('oh no');})();
A slightly different error message is printed when a promise rejection happens. As of Node.js v14.8, a warning is displayed with it:
(node:52298) UnhandledPromiseRejectionWarning: Error: oh no
    at Object.<anonymous> (/tmp/reject.js:1:16)
    ... TRUNCATED ...
    at internal/main/run_main_module.js:17:47
(node:52298) UnhandledPromiseRejectionWarning: Unhandled promise
  rejection. This error originated either by throwing inside of an
  async function without a catch block, or by rejecting a promise
  which was not handled with .catch().
Unlike uncaught exceptions, unhandled promise rejections do not cause the process to crash in Node.js v14. In Node.js v15 and above, this will cause the process to exit. This behavior can be enabled in v14 by running the Node.js binary with the
--unhandled-rejections=strict flag.
Similar to uncaught exceptions, unhandled rejections can also be listened for using the process event emitter. Here’s an example of how it’s done:
process.on('unhandledRejection',(reason,promise)=>{});
Much like with the uncaughtException event, it’s important to not allow the process to continue running since it is likely in an invalid state. Consider running your Node.js processes with the flag enabled today to help future-proof your application. If you do encounter these uncaught rejection warnings while running an application in development, you should definitely track them down and fix them to prevent production bugs.
Node.js and the npm package ecosystem are both going through a transitional phase. Node.js was built with the callback pattern in mind for asynchronous activities, having the first argument of the callback be an error. It’s now adapting the promise/async function pattern. Applications you build today will have to deal with both patterns.
The EventEmitter class, available at require('events').EventEmitter, is extended by and used by many other classes, both those provided by core Node.js modules, as well as packages available on npm. Event emitters are so popular and follow a different-enough pattern than the other errors covered in this section that they’re worth their own consideration.
Instances of EventEmitter that emit an error event without having a listener will cause the process to terminate. When this happens, the base EventEmitter code either throws the event argument or, if it’s missing, it will throw an Error with a code of ERR_UNHANDLED_ERROR.
When an EventEmitter instance throws such an error, the following message will be displayed in the console before the process exits:
events.js:306
    throw err; // Unhandled 'error' event
    ^
Error [ERR_UNHANDLED_ERROR]: Unhandled error. (undefined)
    at EventEmitter.emit (events.js:304:17)
    at Object.<anonymous> (/tmp/foo.js:1:40)
    ... TRUNCATED ...
    at internal/main/run_main_module.js:17:47 {
  code: 'ERR_UNHANDLED_ERROR',
  context: undefined
}
The appropriate way to handle these errors is to listen for error events, similar to how you would catch errors in other situations.3 Just like with thrown exceptions and promise rejections, the argument used when emitting an error, such as with
EventEmitter#emit('error', arg), should be an instance of the Error class. This is again so that the caller can get contextual information about the failure.
Signals
Signals are a mechanism provided by the operating system to allow programs to receive short “messages” from the kernel or from other programs. And by short, I mean really short. A signal is just a small number that is being sent, and there are only a few dozen of them available. While signals are represented as a number under the hood, they’re usually referred to by a string name. For example, SIGINT and SIGKILL are two of the more commonly encountered signals.
Signals can be used for multiple reasons, though they are most commonly used to tell a process that it needs to terminate. Different platforms support different sets of signals, and the numeric values can even change between OS, which is why the string version of a signal is used. Run the kill -l command to get a list of the signals recognized by your current machine.
Table 8-2 contains a list of the more universal signals and what they’re used for.
| Name | Number | Handleable | Node.js default | Signal purpose |
|---|---|---|---|---|
|
1 |
Yes |
Terminate |
Parent terminal has been closed |
|
2 |
Yes |
Terminate |
Terminal trying to interrupt, à la Ctrl + C |
|
3 |
Yes |
Terminate |
Terminal trying to quit, à la Ctrl + D |
|
9 |
No |
Terminate |
Process is being forcefully killed |
|
10 |
Yes |
Start Debugger |
User-defined signal 1 |
|
12 |
Yes |
Terminate |
User-defined signal 2 |
|
12 |
Yes |
Terminate |
Represents a graceful termination |
|
19 |
No |
Terminate |
Process is being forcefully stopped |
When a program receives a signal, it usually gets a choice on how to handle it. The two signals SIGKILL and SIGSTOP cannot be handled at all, as conveyed by the Handleable column. Any program that receives either of those two signals will be terminated, regardless of what language it’s written in. Node.js also comes with some default actions for the remaining signals, as listed in the Node.js default column. Most of them cause the process to terminate, however the SIGUSR1 signal tells Node.js to start the debugger.
Node.js makes it straightforward to handle these signals when they’re received. Just like how you handle uncaught exceptions and unhandled rejections, the process emitter also emits events named after the signal being received. To prove this, create a new file named /tmp/signals.js and add the content in Example 8-1 to the file.
Example 8-1. /tmp/signals.js
#!/usr/bin/env nodeconsole.log(`Process ID:${process.pid}`);process.on('SIGHUP',()=>console.log('Received: SIGHUP'));process.on('SIGINT',()=>console.log('Received: SIGINT'));setTimeout(()=>{},5*60*1000);// keep process alive
Execute the file in a terminal window. It prints a message with the process ID and then sits there for up to five minutes before terminating. Once you start the program, try to terminate the process by using the Ctrl + C keyboard shortcut. Try as you might, you won’t be able to terminate the process! When you use the Ctrl + C shortcut, your terminal sends the SIGINT signal to the process. The default action of exiting the process has now been replaced by your new signal handler, one that merely prints the name of the signal it has received. Take note of the process ID printed on your screen and switch to a new terminal window.
In this new terminal window, you’re going to execute a command that will send a signal to your process. Run the following command to send the SIGHUP signal to your process:
$kill-s SIGHUP <PROCESS_ID>
The kill command is a convenient utility that sends signals to processes. Since signals were originally used to kill processes, the name sort of stuck around and the kill command is what we use today.
At it turns out, Node.js processes are also capable of sending signals to other processes. And, as an homage to the convention of referring to signals as kill, the method used to send signals is available as process.kill(). Run the following command in your terminal to run a simple Node.js one-liner before exiting:
$node -e"process.kill(<PROCESS_ID>, 'SIGHUP')"
Again, you should see the SIGHUP message printed in the console of the first application you’re running.
Now that you’re done experimenting with signals, you’re ready to terminate the original process. Run the following command in your second terminal window:
$kill-9 <PROCESS_ID>
This command will send the SIGKILL signal to your process, terminating it immediately. The -9 argument tells the kill command to use the numeric version of the signal. SIGKILL is universally the ninth signal, so this command should be fairly portable and will work pretty much everywhere. Recall that the SIGKILL command can’t have a signal handler installed for it. In fact, if you were to attempt to listen for that event on the process event emitter, the following error would be thrown:
Error: uv_signal_start EINVAL
As a practical application of signals, if an application receives a signal, it can begin shutting itself down in a graceful manner. This can include refusing to handle new connections, transmitting a shutdown metric, and closing database connections. When a Kubernetes pod is terminated, Kubernetes both stops sending requests to the pod and sends it the SIGTERM signal. Kubernetes also starts a 30 second timer. During this time, the application can then do whatever work is necessary to gracefully shutdown. Once the process is done, it should terminate itself so that the pod will go down. However, if the pod doesn’t terminate itself, Kubernetes will then send it the SIGKILL signal, forcefully closing the application.
Building Stateless Services
It’s important that state be kept out of Node.js services due to the ephemeral nature of containers, and the fact that you and I write buggy code. If state isn’t kept outside of application code, then that state can be lost forever. This can lead to inconsistent data, poor user experience, and, in the wrong situations, even financial loss.
Single Source of Truth is a philosophy that there is a single location that any particular piece of data must call home. If this data is ever kept in two separate locations, then those two sources may diverge (for example, if an update action succeeds in one place but then fails in another). If this data only exists within an application process and that process crashes, then the only copy of the data has just been lost.
Keeping all state out of a process is impossible, but keeping the source of truth from the process is achievable. There is one caveat, though, and that is if a client tries to modify state by contacting a service and some sort of fault happens that leads to the loss of data. In that case, the service needs to respond to the client with an appropriate error. When this happens, the responsibility of that modified state is then shifted back to the client. This might result in an error being displayed to the user, prompting them to click the “Save” button again.
It can be difficult to identify situations where the only source of truth is located inside of an application process, or situations where a process crash can lead to data inconsistency. Consider a situation where a Node.js process receives a request and needs to notify two upstream services, Data store #1 and Data store #2, that an account balance has been reduced. Figure 8-1 is a digram of how the Node.js application might do this.
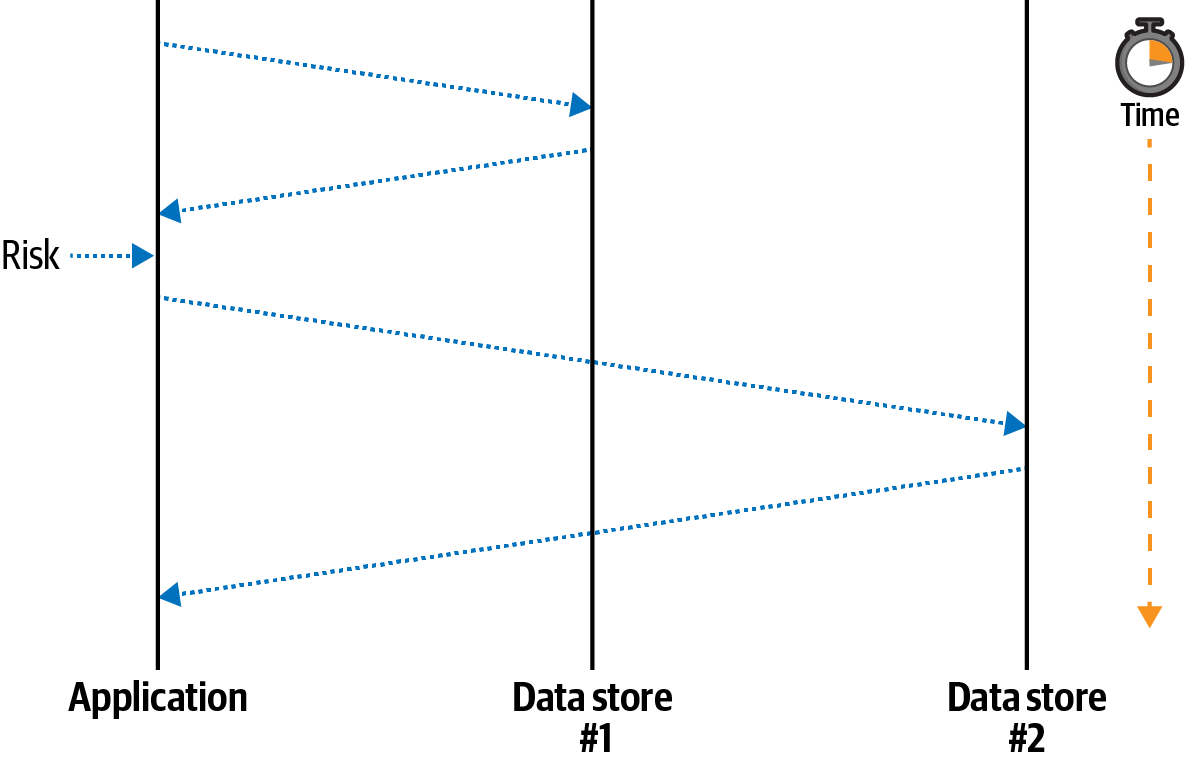
The equivalent application code for this situation might look like this:
server.patch('/v1/foo/:id',async(req)=>{constid=req.params.id;constbody=awaitreq.body();awaitfetch(`http://ds1/foo/${id}`,{method:'patch',body});doSomethingRisky();awaitfetch(`http://ds2/foo/${id}`,{method:'patch',body});return'OK';});
In the happy path, the application receives a request, notifies the first service, notifies the second service, and finally responds to the client that the operation was a success. In the sad path, the application notifies the first service and then crashes before notifying the second service. The client receives a failure response and knows that something bad happened. However, the system has been left in an inconsistent state.
In this case, the Node.js application was, albeit temporarily, the only entity knowledgeable about the state of the system. Once the process crashed, the two backend services were left in an inconsistent state. Managing situations like these can be a very difficult task. I encourage you to read Martin Kleppmann’s Designing Data-Intensive Applications for more information about distributed transactions.
Avoiding Memory Leaks
Maintaining state within an application process is not only risky for the data, but it can also be risky for the process. Imagine a service that declares a singleton Map instance for storing account information. Such an application might have code that looks like this:
constaccounts=newMap();module.exports.set=(account_id,account)=>{accounts.set(account_id,account);};
Why might an application be built this way? Well, it’s extremely fast. Writing a data change to an in-memory data structure will always be orders of magnitude faster than writing to an external service. It’s also very easy to make mutable globals like this in Node.js.
What sort of problems might arise with this example? The first is that of persistence. When an application restarts, how will the data be transferred to a new process? One way would be to listen for the SIGTERM signal and then to write the content to the filesystem. As you saw previously, filesystems aren’t easily persisted between container restarts, though it is possible. There are also other situations that cause a process to terminate, as you saw in “The Death of a Node.js Process”. Even if the application sends a representation of the map to another service when it suspects termination, there’s no guarantee that the external service is still reachable.
Another problem with this approach is that it’s a potential memory leak. The accounts Map has an unbounded size and may grow until the process consumes all of the free memory of the host! For example, there might be a bug where the account_id value changes slightly, leading to each set() call to insert a new record. Or an attacker might make many fake accounts to fill the value.
Most potential memory leaks won’t be as easy to spot as this one. Here’s a vastly simplified example of a memory leak in the cls-hooked package,4 a package that receives over 400,000 downloads every week:
process.namespaces={};functioncreateNamespace(name){process.namespaces[name]=namespace;}functiondestroyNamespace(name){process.namespaces[name]=null;}
This package provides an implementation of continuation local storage, specifically to maintain a “session” object, identified by a “namespace,” between asynchronous callbacks. For example, a session can be created when an HTTP request is received, information about the user making the request can be added to the session object, and then, once an asynchronous database call finishes, the session can be looked up again.
The global that maintains state in this case is process.namespace. The memory leak is that the namespace identifiers are never deleted from the global; instead they are set to null. Different applications use this package in different ways, but if an application creates a new namespace for each incoming HTTP request, it ends up resulting in a memory increase linear to the traffic rate.
Bounded In-Process Caches
One type of state that is acceptable to store within an application process is cached data. A cache represents a copy of data that is either expensive to calculate (CPU cost) or expensive to retrieve (network request time). In this situation a cache is intentionally not the source of truth. A cache stores data as key/value pairs where the key is a unique identifier for the cache’s resource and the value is the resource itself, serialized or otherwise. This type of data can be stored within a process because the source of truth is still safe after the process terminates.
When dealing with a cache, an application first determines what data to look up. For example, this data might be an account with an identifier of 123. Once the identifier has been determined, the application will then consult with the cache. If the cache does contain the resource, such as account:123, then that resource is used and the application continues with the data. This situation is referred to as a cache hit. Looking up data from an in-process cache takes microseconds.
However, if the resource doesn’t exist within the cache, then the application needs to perform the slower lookup of the data, potentially taking seconds of time. This is referred to as a cache miss. When this happens, the application performs whatever slow calculation or network request is needed. Once the result is obtained, the application then sets the value in the cache and continues with the newly required resource. When the resource is needed again, it consults the cache again.
Caches should only be used in situations where performance requirements can’t be attained without them. Caches add an additional layer of complexity to an application. A cache also introduces the situation where the copy of the data in the cache may be outdated from the source of truth. For example, the account:123 resource may have been modified to have a balance of 0, even though the cached version still contains a balance of 100.
Knowing when to update or remove entries from a cache is a topic known as cache invalidation. There isn’t a perfect solution to this problem, only philosophical ones. It often becomes a business question of what sort of tolerance the product can have with regards to an outdated cache. Is it okay to display a slightly out-of-date account balance? Possibly yes. Is it okay to allow a player to spend more coins than they have in their account? Probably not.
While cache invalidation philosophy is something specific to each organization, the requirement to avoid memory leaks is more universal. It’s safe to assume that a cache should never grow so much that it causes a process to crash.
Applications run in environments where there is a finite amount of memory available. A host machine will always have a maximum amount of physical RAM that it has available. Containers and virtual machines then have a smaller piece of that memory available. When a Node.js process consumes too much memory, it will either fail to get access to more memory, or a supervising process like Docker may terminate the process once a threshold has been reached. Memory is measured in the number of bytes being consumed, not the number of records being cached, so it’s good to use a tool that limits in-process cache size based on some semblance of the byte requirements of the data.
The lru-cache package is a popular tool for doing just that. It is a key/value store that can be configured to use the length of strings or buffers that are inserted into the cache to loosely approximate the memory requirements of those entries.5 With this package, you can set values, get values, and perform your own lookup if a value is missing. The package even accepts an expiration time so that entries older than a certain amount of time will be removed. The LRU in the name stands for Least Recently Used. This is a common cache practice for evicting keys that haven’t been accessed in a while—which hopefully means keys where cache misses don’t result in too high of a performance loss.
Now that you’re familiar with some of the philosophies behind in-memory caches, you’re ready to work with one of your own. Create a new file named caching/server.js and add the content from Example 8-2 to it. This file will serve as a mini-proxy to the GitHub API for looking up account details.
Example 8-2. caching/server.js
#!/usr/bin/env node// npm install fastify@3.2 lru-cache@6.0 node-fetch@2.6constfetch=require('node-fetch');constserver=require('fastify')();constlru=new(require('lru-cache'))({max:4096,length:(payload,key)=>payload.length+key.length,maxAge:10*60*1_000});constPORT=process.env.PORT||3000;server.get('/account/:account',async(req,reply)=>{returngetAccount(req.params.account);});server.listen(PORT,()=>console.log(`http://localhost:${PORT}`));asyncfunctiongetAccount(account){constcached=lru.get(account);if(cached){console.log('cache hit');returnJSON.parse(cached);}console.log('cache miss');constresult=awaitfetch(`https://api.github.com/users/${account}`);constbody=awaitresult.text();lru.set(account,body);returnJSON.parse(body);}

The cache will store approximately 4kb of data for up to 10 minutes.

The cache is always consulted before making a request.

The cache is updated whenever data is retrieved.
Initialize the npm project, install the dependencies, and run the server in a terminal window. In another terminal window, run the following curl commands:
$node caching/server.js$timecurl http://localhost:3000/account/tlhunter$timecurl http://localhost:3000/account/nodejs$timecurl http://localhost:3000/account/tlhunter
Note
At the time of this writing, each response from the GitHub API is about 1.2 KB. If things have changed much in the future, you may need to configure the server to have a larger LRU size. Try to set it to be large enough to hold at least two results. Also, be careful to not get rate-limited by the GitHub API. When that happens, you’ll get failed responses.
When you run the first command, you should see a cache miss message displayed in the server terminal window. The command takes about 200ms to complete on my machine. This is because the server.js application is making an outgoing network request to the GitHub servers. When you make the second request, you should see the same thing happen, with another cache miss message and a request that likely takes 200ms to complete. However, when you run the third command, you should see something a little different, specifically a cache hit message, and the response should be much faster (in my case, 20ms).
Next, substitute your username in one of those URLs and make another request. Then, use some other entries like express and fastify. Finally, circle back to the original tlhunter account again. This time, you should see that the request resulted in another cache miss. This is because lru-cache evicted the original tlhunter entry from the cache since newer entries replaced it and the cache had become full.
There are a few shortcomings with this solution. One problem is surfaced when the GitHub API returns an error. When this happens, the error response will get inserted into the cache—ideally, no entry would be inserted when this happens. Another possible shortcoming (depending on how you look at it) is that the cache stores the JSON representation of the resource, not parsed object. This results in redundant JSON.parse() calls being made each time the entry is retrieved from the cache. Storing the JSON string in the cache library does make it easier to calculate memory usage (string length). It also prevents accidental mutation of the cached objects.
Another issue is that parallel incoming requests for the same username will result in simultaneous cache misses followed by parallel outgoing requests to GitHub. This might not be a big deal, but sometimes it’s nice to use a cache to reduce the number of outgoing requests to a third-party API. For example, if you send too many requests to GitHub, you’ll start to get rate limited. For this reason a more robust solution may be needed.
There are two more issues with this cache that specifically deal with caching data inside of the process itself. The first is that if the process is restarted, then the cache is lost with it. In a high-throughput environment, a service restart will mean that upstream services will then receive a burst of traffic. For example, the web-api service you previously built could be caching results from the recipe-api. Once a web-api instance restarts, the recipe-api instances will receive increased traffic until the cache is replenished.
Another shortcoming is that the cache is only used by a single service instance! If you had a fleet of 100 web-api instances, each would still need to send a request for the same recipe-api resource at least once every 10 minutes. Each service also contains redundant caches, wasting overall available memory. This issue can be seen by running a second instance of the server and making a request to that:
$ PORT=4000node server.js$timecurl http://localhost:4000/account/tlhunter
In this case, the request to the server instance listening on port 4000 will never make use of the other server instance’s cache. The easiest way to fix these two issues is to use an external caching service.
External Caching with Memcached
There are many trade-offs when it comes to performing a cache lookup. Speed, durability, expiration configurability, and how the cache is shared across services are all important concerns. Here’s a quick comparison of three different caching strategies:
- In-memory cache
-
This is the approach examined in the previous section. It’s the fastest approach, but the cache is destroyed between crashes and deployments. Data structure changes between application versions don’t have side effects. Lookups that happen here will probably take less than one millisecond.
- External cache
-
This is the approach covered in this section. It’s slower than an in-memory cache but should be faster than hitting the source of truth. It also prevents the cache from being wiped out between crashes and deployments. Data structures must be maintained, or cache keys renamed, between application versions. Lookups that happen here may take tens of milliseconds.
- No cache
-
In this approach, an application talks directly to the source of truth. It is usually the slowest and simplest to implement. There’s no risk of data integrity issues because there’s no cached values that can drift from the source of truth. Lookups that happen with this strategy could take any amount of time.
Much like with databases, if a heterogeneous collection of services are allowed to read and write to a cache service, bad things may happen. For example, if one team inside of an organization owns the recipe-api and another team owns the web-api, those teams may not communicate how the structure of cached data is going to change between releases. This can result in conflicting expectations and runtime errors. Just think: an API exposed over HTTP is just one API surface; if applications are sharing database tables or caches, there are now multiple API surfaces!
Introducing Memcached
One of the most established caching services available is Memcached. It’s a dependable, no-frills cache, one that can be distributed across multiple machines. When instantiating a Memcached instance, you specify the maximum amount of memory that the instance may consume, and Memcached automatically purges newly added entries following the same LRU approach covered in the previous section.
Keys can be up to 250 bytes long, and values can be up to 1MB. Each individual key can have its own expiration time set.
Memcached provides several commands as part of its API. One of the most obvious commands is set(key, val, expire), which will set a key to a value. It has a correlating get(key1[, key2…]) command for retrieving data. There’s also add(key, val, expire), which also sets data but it will only succeed if the key doesn’t already exist. Both incr(key, amount) and decr(key, amount) allow you to atomically modify numeric values, but only if they already exist. There’s even a replace(key, val, expire) command that will only set a value if it already exists. The delete(key) command allows you to delete a single key, and the flush_all() command removes all keys.
There are two commands for performing string manipulations on the values stored in Memcached. The first is append(key, val, expire), and the second is prepend(key, val, expire). These commands allow an application to append and prepend a string to an existing value.
There are also two additional commands for making atomic changes where one client wants to ensure that another client hasn’t changed entries without it knowing. The first is gets(key), which returns both the value of the data and a “CAS” (Compare and Set) id. This is an integer that changes with each manipulation to the key. This value can then be used with a correlating cas(key, val, cas_id, expire) command. That command will set a key to a new value but only if the existing value has the same CAS id.
Various other commands exist for getting statistical information about the server, for retrieving the server settings, and for otherwise debugging the cache, though your applications probably won’t need to use them.
Running Memcached
Just like most of the servers you’ve worked with, Memcached can be run within a Docker container for convenience.
Like many other Docker images, Memcached also includes an Alpine variant to consume less resources. When instantiating the Memcached service, there are a few flags that can be passed in, including -d to daemonize (not required with Docker containers), -m to set the maximum amount of memory (very useful), and -v to enable logging (this flag can be repeated to increase verbosity).
Run the following command in a terminal window to run Memcached:
$docker run\--name distnode-memcached\-p 11211:11211\-it --rm memcached:1.6-alpine\memcached -m64-vv
This Memcached instance is limited to 64MB of memory and will output a bunch of debugging information in your terminal. Port 11211 is the default Memcached port. Since the Docker command has the -it and --rm flags, you’ll be able to kill it with Ctrl + C when you’re done and the container will be removed from your system.
When running multiple Memcached instances, the instances themselves aren’t aware of each other. Instead, clients connect directly to the different instances and use a client-side hashing algorithm to determine which server contains a particular key. Ideally, this means each client uses the same server for the same key names, but it is possible for different client libraries to decide on different servers to store particular keys, which can result in cache misses and data redundancy.
Caching Data with Memcached
Now that you have your Memcached service running, you’re ready to interact with it from a Node.js application. For this example, copy and paste your existing caching/server.js file that you created in the previous section to caching/server-ext.js. Next, modify the file to resemble Example 8-3.
Example 8-3. caching/server-ext.js
#!/usr/bin/env node// npm install fastify@3.2 memjs@1.2 node-fetch@2.6constfetch=require('node-fetch');constserver=require('fastify')();constmemcache=require('memjs').Client.create('localhost:11211');constPORT=process.env.PORT||3000;server.get('/account/:account',async(req,reply)=>{returngetAccount(req.params.account);});server.listen(PORT,()=>console.log(`http://localhost:${PORT}`));asyncfunctiongetAccount(account){const{value:cached}=awaitmemcache.get(account);if(cached){console.log('cache hit');returnJSON.parse(cached);}console.log('cache miss');constresult=awaitfetch(`https://api.github.com/users/${account}`);constbody=awaitresult.text();awaitmemcache.set(account,body,{});returnJSON.parse(body);}
Instantiate the Memcached connection.
The
.get()call is now asynchronous.The
.set()call is also asynchronous.
A few code changes are needed to migrate the service from an in-memory LRU cache to the memjs package. The .get() and .set() arguments for this example follow mostly the same signature as the previous LRU cache. The biggest change is that the calls are now asynchronous and their results must be awaited. The .get() method resolves an object with the cached value being a buffer on the .value property. The JSON.parse() method triggers the .toString() method on the buffer, so an additional data conversion isn’t needed. The .set() method requires a third, empty options object as an argument due to the way the memjs package performs callback to promise conversion.
Now that you have your new service ready, execute two copies of the service in two separate terminals. In the first terminal, use the default port of 3000, and in the second terminal, override the port to be 4000, like so:
$node caching/server-ext.js$ PORT=4000node caching/server-ext.js
Next, make a request to both of the services again. Hit the first service twice, and then hit the second service:
$timecurl http://localhost:3000/account/tlhunter# miss$timecurl http://localhost:3000/account/tlhunter# hit$timecurl http://localhost:4000/account/tlhunter# hit
In this example, the first request results in a cache miss. The service makes the outbound request to GitHub and then fills the cache and returns. In my case, this takes about 300ms. Next, the second request to the first service will result in a cache hit. The operation takes about 30ms in my case, which is a little slower than when I had run the process with just an in-memory LRU cache. Finally, the third request to the second service will also result in a cache hit, even though that service hasn’t made a request to GitHub. This is because both of the services use the same shared Memcached cache entry.
That’s it for Memcached! Feel free to clean up your running Node.js services and the Memcached server by switching to their terminal windows and pressing Ctrl + C.
Data Structure Mutations
Since cached resources may change between releases, it’s sometimes necessary to prefix the name of a key with a version number to signify the version of the data structure being cached. For example, consider an application that stores the following object in a cache:
{"account":{"id":7,"balance":100}}
Perhaps this representation of the cached entry is used by several different versions/releases of an application. Let’s refer to those as r1..r5. However, for the r6 release of the application, an engineer decides to change the shape of the cached object to be more efficient and to deal with an anticipated migration of account IDs from numbers to strings.
The engineer chooses to represent the cached entries like so:
{"id":"7","balance":100}
In this case, the superfluous wrapper has been removed and the data type of the id attribute has been changed to a string. By changing the representation of the cached entries, something bad will likely happen!
As an example, assume that the key names of these records in the cache follow the pattern account-info-<ACCOUNT_ID>. In the case of these two versions of the objects, the key would then be account-info-7.
The code that reads from the cache in releases r1..r5 of the application looks like this:
asyncfunctionreduceBalance(account_id,item_cost){constkey=`account-info-${account_id}`;constaccount=awaitcache.get(key);constnew_balance=account.account.balance-item_cost;returnnew_balance;}
However, for release r6 and onward of the application, the code will have been changed slightly to work with the new cached entry:
constnew_balance=account.balance-item_cost;
This means that when release r6 of the application is deployed, it will read the cache and throw an error stating account.balance is undefined. This is because existing entries in the cache still have the wrapper object present. In this case, you might be tempted to clear the cache before deploying the new release. Unfortunately there’s still the risk of r5 instances writing to the cache after it has been cleared and before r6 instances have been deployed.
The easiest way to survive this situation is to modify the names of the cache entries to contain a version number representing the object representation version. This version number need not resemble the release version of the application. In fact, it shouldn’t, because an application is likely to retain the same data structure for most objects across most releases. Instead, each resource type should get its own new version whenever its representation is changed.
As an example of this, the key name could change from account-info-<ACCOUNT_ID> to account-info-<VERSION>-<ACCOUNT_ID>. In the case of the application release changing from r5 to r6, the account-info object version may change from v1 to v2. This would result in two separate cached entries, one named account-info-v1-7 and one named account-info-v2-7. This is convenient because no matter how slow the deployment is, two separate application releases won’t have conflicting cache data. Unfortunately, it now means that all of the account-info objects in the cache need to be looked up again.
Another solution, instead of changing key names and losing cached values, is to “migrate” the data from the old form to the new form. This allows different application releases to deal with different representations of cached objects. “Schema Migrations with Knex” covers this concept of migrations in more detail, albeit from the perspective of a relational database.
Database Connection Resilience
Node.js applications often maintain a long-lived connection to one or more databases so that they may remain stateless. Database connections are usually made through a TCP network connection. Unfortunately, those connections will occasionally go down. Many different situations can cause connections to drop, such as database upgrades, network changes, or even temporary network outages.
When a connection drops, your application might be dead in the water. Perhaps there are some actions that the service can still perform. For example, if there is an endpoint to retrieve a resource and the application is still able to connect to a caching service but not to the database, then it’s reasonable that requests for cached resources should succeed.
However, when a connection isn’t available, and data must be written to or read from the database, your application is going to be in a tricky situation. At this point, it might make sense to simply fail the request, such as with a 503 Service Unavailable error if using HTTP.
Running PostgreSQL
In this section you’re going to use the PostgreSQL database. Most of the techniques covered herein are supported by other SQL and NoSQL databases alike. Postgres is a very powerful and popular database system that you’re likely to work with during your career, so it will make for a great guinea pig. Run the following command to get Postgres running via Docker:
$docker run\--name distnode-postgres\-it --rm\-p 5432:5432\-ePOSTGRES_PASSWORD=hunter2\-ePOSTGRES_USER=user\-ePOSTGRES_DB=dbconn\postgres:12.3
Automatic Reconnection
The first topic you’re going to work with regarding database connection resilience is that of automatically reconnecting to the database. Unfortunately, connections will fail from time to time, and it’s convenient for the application to automatically reconnect when a failure does happen.
Theoretically, if a database connection were to fail, then your application could terminate itself. Assuming you have infrastructure set up to detect such a termination, for example, a health check endpoint, then your Node.js process could be automatically restarted. That said, such infrastructure isn’t always available to an organization. Another thing to consider is that the overall application health isn’t necessarily any better by doing this. For example, if a process terminates and takes 10 seconds to fail a health check, then those are 10 seconds’ worth of failed requests. If an application loses connection to the database but is able to reconnect, that represents a potentially shorter period of downtime. For these reasons, developers often choose to implement reconnection logic.
Not every database package provides the ability to reconnect to a database, but the principle is generally the same everywhere. In this section you will build out a reconnection module for the pg package in a way that can be applied to other packages
as well.
First, you’re going to need to create an application file. This file will resemble a fairly typical web application, one that sends SQL queries as part of a request handler. But instead of requiring the database package directly, it instead requires the reconnection module. Create a new file named dbconn/reconnect.js and start it off with the content from Example 8-4.
Example 8-4. dbconn/reconnect.js, part one of two
#!/usr/bin/env node// npm install fastify@3.2 pg@8.2constDatabaseReconnection=require('./db.js');constdb=newDatabaseReconnection({host:'localhost',port:5432,user:'user',password:'hunter2',database:'dbconn',retry:1_000});db.connect();db.on('error',(err)=>console.error('db error',err.message));db.on('reconnect',()=>console.log('reconnecting...'));db.on('connect',()=>console.log('connected.'));db.on('disconnect',()=>console.log('disconnected.'));
This file starts off like many applications you have likely written. The DatabaseReconnection class accepts the same configuration settings that are used by the pg package. In fact, it passes the connection settings along blindly. The retry value is specifically going to be used by the reconnection logic that you’ll soon write. In this case, it’s configured to retry the database connection every second until it
succeeds.
The big list of event listeners isn’t necessary for a production application, though the error event of course needs to be handled, or else an error will be thrown. These are provided to later illustrate how the module goes through the reconnection flow.
The file isn’t quite ready yet as you still need to add some request handlers. Add the content from Example 8-5 to the file.
Example 8-5. dbconn/reconnect.js, part two of two
constserver=require('fastify')();server.get('/foo/:foo_id',async(req,reply)=>{try{varres=awaitdb.query('SELECT NOW() AS time, $1 AS echo',[req.params.foo_id]);}catch(e){reply.statusCode=503;returne;}returnres.rows[0];});server.get('/health',async(req,reply)=>{if(!db.connected){thrownewError('no db connection');}return'OK';});server.listen(3000,()=>console.log(`http://localhost:3000`));
Basic parameterized query without a table
An example health endpoint
Your web server now has two different HTTP endpoints registered in it. The first one, GET /foo/:foo_id, makes use of the database connection. In this case, it’s running an example query that doesn’t require a table, chosen so that you don’t have to create
a schema. All it does is show that the database connection is working. Within this
handler, if the query fails, the call to db.query() will reject, and the handler will return the error. However, if the database query succeeds, it’ll return an object with a time and echo property.
The second request handler for GET /health is a health endpoint. In this case, the endpoint makes use of a property on the DatabaseReconnection class instance called .connected. This is a Boolean property declaring if the connection is working or not. In this case, the health endpoint will fail if the connection is down and will pass if the connection is up.
With this, Kubernetes could be configured to hit the health endpoint, perhaps every few seconds, and also be configured to restart the service if the endpoint fails three times in a row. This would give the application enough time to reestablish a connection, allowing the instance to remain running. On the other hand, if the connection cannot be established in time, Kubernetes would then kill the instance.
Once you’ve made these changes to the application file you’re now ready to work on the DatabaseReconnection class. Create a second file named dbconn/db.js and start it off by adding the content from Example 8-6 to it.
Example 8-6. dbconn/db.js, part one of three
const{Client}=require('pg');const{EventEmitter}=require('events');classDatabaseReconnectionextendsEventEmitter{#client=null;#conn=null;#kill=false;connected=false;constructor(conn){super();this.#conn=conn;}
The first part of this file isn’t too exciting. Since the module wraps the pg package, it needs to first require it. A DatabaseReconnection class instance is an instance of an EventEmitter, so the built-in events module is loaded and extended.
The class depends on four properties. The first three are private properties. The first, client, is an instance of the pg.Client class. This is what handles the actual database connection and dispatches queries. The second property is conn. It contains the database connection object and needs to be stored because new connections will need to
be created with it. The third property, kill, is set when the application wants to
disconnect from the database server. It’s used so that an intentionally closing connection doesn’t attempt to reestablish another connection. The final public property,
connected, tells the outside world if the database is connected or not. It won’t
necessarily be 100% accurate, because a downed connection might not immediately cause the value to change, but it’s useful for the health endpoint.
The constructor method accepts the connection object, instantiates the event emitter, and then sets the private property. The exciting part won’t happen until the connection is actually kicked off.
Once you’ve finished adding the first set of content to the file, you’re ready to move on. Now add the content from Example 8-7 to the file.
Example 8-7. dbconn/db.js, part two of three
connect(){if(this.#client)this.#client.end();if(this.kill)return;constclient=newClient(this.#conn);client.on('error',(err)=>this.emit('error',err));client.once('end',()=>{if(this.connected)this.emit('disconnect');this.connected=false;if(this.kill)return;setTimeout(()=>this.connect(),this.#conn.retry||1_000);});client.connect((err)=>{this.connected=!err;if(!err)this.emit('connect');});this.#client=client;this.emit('reconnect');}
Terminate any existing connections.
Attempt to reconnect when a connection ends.
This section of the file defines a single connect() method and is the most complex part of the DatabaseReconnection class. Many whitespace atrocities have been committed to squeeze the functionality into a small space; feel free to add newlines where appropriate.
When the connect() method runs, it first checks to see if a client already exists. If so, it ends an existing connection. Next, it checks to see if the kill flag has been set. This flag is set later within the disconnect() method and is used to prevent the class from reconnecting after being manually disconnected. If the flag is set, then the method returns and no additional work is done.
Next, a new database connection is instantiated and set to a variable named client. The client.on('error') call hoists any error calls from the database connection to the wrapping class so that the application can listen for them. The class also listens for the end event. That event is triggered any time the database connection closes, including when the connection is manually terminated, when there’s a network blip, or when the database dies. In this event handler, a disconnect event is emitted, the connection flag is set to false, and if the connection isn’t being manually killed, the connect() method is called again after the retry period has passed.
After that, the database connection is attempted. The connected flag is set to true if the connection succeeds and false if it fails. It also emits a connect event upon success. The underlying pg package emits an end event if the connection fails to be made, which is why this event handler doesn’t call the connect() method.
Finally, the client is assigned as a class attribute, and the reconnect event is emitted.
Once you’ve saved those changes, you’re ready for the final part of the file. Add Example 8-8 to the end of the file.
Example 8-8. dbconn/db.js, part three of three
asyncquery(q,p){if(this.#kill||!this.connected)thrownewError('disconnected');returnthis.#client.query(q,p);}disconnect(){this.#kill=true;this.#client.end();}}module.exports=DatabaseReconnection;
This part of the file exposes two more methods. The first one is the query() method, which for the most part passes the query along to the encapsulated pg.Client instance. However, if it knows the connection isn’t ready, or if it knows the connection is being killed, it will reject the call with an error. Note that this method doesn’t properly support the entire pg.Client#query() interface; be sure to spruce it up if you use it in a real project.
The disconnect() method sets the kill flag on the class and also instructs the underlying pg.Client connection to terminate by calling its .end() method. That kill flag is needed to distinguish between the end event triggered by this manual disconnection versus an end event triggered by a connection failure.
Finally the class is exported. Note that if you were to build such a reconnection library for other database packages, then it would make sense to expose any other methods the application needs to access.
Note
This database reconnection module isn’t necessarily ready for production. Depending on the package you use it to encapsulate, there may be other error conditions as well. As with any database connection library, it would be wise to experiment and reproduce many of the different failure cases.
Once the file is complete, be sure to initialize a new npm project and to install the required dependencies. Then, execute the reconnect.js Node.js service. Once your service is running, you may send it a request to confirm that it is connected to the database:
$curl http://localhost:3000/foo/hello >{"time":"2020-05-18T00:31:58.494Z","echo":"hello"}$curl http://localhost:3000/health > OK
In this case, you should get a successful response back from the server. The result I receive is printed on the second line. That timestamp was calculated by the Postgres service, not the Node.js application.
Now that you’ve confirmed your Node.js service is able to speak to the database, it’s time to sever the connection. In this case, you’re going to take down the entire Postgres database. Switch to the terminal window running Postgres and kill it by pressing Ctrl + C.
You should now see the following messages in the terminal running your Node.js service:
connected.
db error terminating connection due to administrator command
db error Connection terminated unexpectedly
disconnected.
reconnecting...
reconnecting...
The first connected message was displayed when the process first started. The two error messages and the disconnected message are displayed immediately after the Node.js service detected the disconnection. Finally, the reconnecting messages are displayed, once per second, as the service attempts to reconnect.
At this point, your application is in a degraded state. But the service is still running. Make two new requests to the service, the first to the same endpoint and the second to the health endpoint:
$ curl http://localhost:3000/foo/hello
> {"statusCode":503,"error":"Service Unavailable",
>   "message":"disconnected"}
$ curl http://localhost:3000/health
> {"statusCode":error":"Internal Server Error",
>   "message":"no db connection"}
In this case, both of the endpoints are failing. The first endpoint fails when it attempts to make a database query, and the second fails since the connected flag on the database connection is set to false. However, if the application supported other endpoints that didn’t rely on the database connection, they could still succeed.
Finally, switch back to the terminal window where you killed the Postgres database and start it again. The container should start relatively quickly since the Docker images have already been downloaded to your machine. Once the Postgres database is back up, your Node.js service should establish a new connection. The logs that are displayed when I run the service looks like this:
reconnecting...
reconnecting...
connected.
In this case, my Node.js service was able to reconnect to the Postgres database again. Run the curl commands a final time and you should get passing responses again.
Connection Pooling
Another way to increase the resilience of your application’s database connection is to use more than one connection, or as it’s better known, use a pool of connections. With regards to resilience, if a single one of the connections were to fail, then another connection would remain open.
When configured to use connection pools, an application will typically try to maintain a certain number of connections. When a connection goes down, the application attempts to create a new connection to compensate. When the application chooses to run a database query, it will then pick one of the available connections in the pool to pass the query through.
Most database packages seem to support some form of connection pooling by default. The popular pg package used in these examples is no exception. The pg.Pool class is available and can mostly be swapped out with pg.Client, though it does have a few different configuration options and exposes some new properties.
Create a new file named dbconn/pool.js and add the content in Example 8-9 to it.
Example 8-9. dbconn/pool.js
#!/usr/bin/env node// npm install fastify@3.2 pg@8.2const{Pool}=require('pg');constdb=newPool({host:'localhost',port:5432,user:'user',password:'hunter2',database:'dbconn',max:process.env.MAX_CONN||10});db.connect();constserver=require('fastify')();server.get('/',async()=>(awaitdb.query("SELECT NOW() AS time, 'world' AS hello")).rows[0]);server.listen(3000,()=>console.log(`http://localhost:3000`));
The connection establishment is mostly the same, but in this case, a property named max has been added. This property represents the maximum number of connections that the process should have to the Postgres database. In this case, it’s pulling the value from the MAX_CONN environment variable or falling back to 10 if it’s missing. Internally, the pg.Pool class also defaults to a connection pool size of 10.
How many connections should your application use? The best way to determine that is to run some real-world benchmarks in a production setting, generating traffic at a certain request rate and seeing how many connections it takes to maintain your desired throughput. Perhaps you’ll find that the default 10 works for you. At any rate, you should try to use the lowest number of database connections that will work to reach your performance needs. Keeping this number low is important for a few reasons.
One reason to minimize database connections is that there is a finite number of connections that a database will accept. In fact, the default number of connections that a Postgres database will accept is 100. This number can be configured per database server. Managed Postgres installations like AWS RDS have different connection limitations based on tier.
If you go over the number of available connections, then the Postgres database server will refuse subsequent connections. This is something that you can simulate locally. The Postgres server that you’re running in Docker should be configured to have a maximum of 100 connections. Run the following commands in two separate terminal windows. The first will run the dbconn/pool.js service using up to 100 connections, and the second will hit the service with so many requests that it’ll be forced to use the entire connection pool:
$ MAX_CONN=100node ./dbconn/pool.js$autocannon -c200http://localhost:3000/
Keep an eye on the terminal window where you’re running Postgres. While the tests run, you shouldn’t see anything bad happening.
Kill the Node.js service once the Autocannon test is complete. Next, run the dbconn/pool.js service a second time, but this time using a pool size greater than what the server is configured to handle, and run the same Autocannon benchmark again:
$ MAX_CONN=101node ./dbconn/pool.js$autocannon -c200http://localhost:3000/
This time, you should see the Postgres server complain with “FATAL: sorry, too many clients already” errors. Once the Autocannon test is complete, you should even see that the throughput is slightly lower.
If you would like to know how many connections a particular Postgres database is configured to handle (for example, when using a managed instance) run the following query:
SELECT*FROMpg_settingsWHEREname='max_connections';
The maximum number of connections can be increased, but there is at least a small amount of overhead required for the server to handle the connections. If not, the default would be infinity. When choosing a connection count, you’ll probably need to make sure the number of connections used per process multiplied by the number of processes running at once is less than half of the number of connections the Postgres server can handle. This half part is important because if you deploy a new set of processes to replace the old processes, then there’s a small amount of time where both the new and old instances need to run with overlap.
So, if your server has a maximum of 100 connections available and you’re running 6 service instances, then the maximum number of connections each process can make is 8:
100 / 2 = 50 ; 50 / 6 = 8.3
One tactic I’ve seen at companies is that they’ll scale up beyond this maximum number of processes (like scaling up to 10 processes consuming a total of 80 connections). But when it’s time to do a deployment, they’ll scale back down the safe number of instances (6 in this case) during off periods, do a deployment, and then scale back up. While I can’t necessarily recommend this approach, I’d be lying if I said I wasn’t guilty of it myself.
Note
One thing to be careful of, especially with Node.js projects, is requiring a database singleton module. In my experience, it’s pretty common to have a file require a database package, make the connection, and export the database instance. It’s also very easy for a spiderweb of require() statements to require such a module. This can result in sidecar processes making unnecessary connections with no visibility that such a connection was made.
Connection pooling isn’t just about resilience; it’s also about performance. The Postgres database, for example, isn’t able to handle multiple queries sent through the same connection at the same time. Instead, each query needs to finish before the following query can be sent, serially.
This serial processing of queries can be seen in Example 8-10.
Example 8-10. dbconn/serial.js
#!/usr/bin/env node// npm install pg@8.2const{Client}=require('pg');constdb=newClient({host:'localhost',port:5432,user:'user',password:'hunter2',database:'dbconn'});db.connect();(async()=>{conststart=Date.now();awaitPromise.all([db.query("SELECT pg_sleep(2);"),db.query("SELECT pg_sleep(2);"),]);console.log(`took${(Date.now()-start)/1000}seconds`);db.end();})();
Two slow queries are sent at the same time.
This application makes a single connection to the Postgres database and then sends two requests at the same time. Each of the requests is making use of the pg_sleep() function, which, in this case, will cause the connection to pause for two seconds, simulating a slow query. When I run this application locally, I get the message “took 4.013 seconds” as a response.
Modify the Example 8-10 code by replacing the two occurrences of Client with Pool and run the application again. This results in a pool with a maximum size of 10. The pg package uses two of those connections to run the two queries. On my machine, the program now prints the message “took 2.015 seconds.”
Schema Migrations with Knex
Knex is a popular SQL query builder package. It’s relied upon by many higher-level ORM (Object-Relational Mapping) packages. If you’ve worked on a few Node.js projects that interact with an SQL database, then chances are good that you have come into contact with Knex at some point.
While Knex is usually heralded for its ability to generate SQL queries (reducing the need to dangerously concatenate SQL strings together), the functionality covered in this section is that of its lesser-known schema migration features.
A schema migration is a change that is made to a database schema in a way that is incremental, reversible, and can be represented using code that can be checked into version control. Since application data storage requirements change all the time, such schema migrations need to be incremental. Each new feature may be represented by one or more migrations. Since application changes occasionally need to be rolled back, these schema migrations must be reversible as well. Finally, since a repository should be the source of truth for representing an application, it’s incredibly convenient to check in schema migrations.
Each schema migration ultimately executes SQL queries to alter the state of the database. Often a later migration will build upon a change made in an earlier migration. For this reason, the order in which database migrations are applied matters greatly. The most basic approach to building out database migrations could be to maintain a list of numbered SQL files and to execute them one after another, with paired SQL files for reversing the changes:
000001.sql  000001-reverse.sql
000002.sql  000002-reverse.sql
000003.sql  000003-reverse.sql
One problem with this approach is that the filenames aren’t all that descriptive. Which file accidentally turned all users into administrators? Another problem is a race condition between two people making code changes. When two engineers create a file named 000004.sql in two separate pull requests, the second branch to be merged needs to modify the commit to rename the file to 000005.sql.
A common migration approach, the same employed by Knex, is to instead use a timestamp and a feature name as the name of the file. This maintains order, solves the issue with name collisions, gives the file a descriptive name, and even lets the developer know when the schema migration was first conceived. Wrapping the queries in a non-SQL file allows for combining the migration and reverse migration. These migration filenames end up looking like this:
20200523133741_create_users.js
20200524122328_create_groups.js
20200525092142_make_admins.js
An entire list of migrations doesn’t need to be applied every time a new version of the application is checked out. Instead, only migrations that are newer than the last migration that was run need to be applied. Knex, and most other schema migration tools, tracks which migrations are run in a special database table. The only thing that makes the table special is that the application itself will probably never touch it. Such a table can be as simple as a single row with a “last schema filename run” column or as complex as containing meta information about each time migrations are run. The important part is that it maintains some sort of reference to the last-run migration. The default name of this table in Knex is knex_migrations.
When doing development as part of a team for an application that uses database migrations, the workflow often requires that you frequently pull source code from the central repository. If any changes are committed to a schema migration directory, you’ll then need to apply some schema modifications. If you don’t do that, then the newer application code may be incompatible with your older database schema, resulting in runtime errors. Once you apply the migrations locally, you’re then free to make modifications of your own.
Now that you’re familiar with the theory behind schema migrations, you’re ready to write some of your own.
Configuring Knex
First, create a new directory named migrations/ to represent a new application that will use migrations and initialize a new npm project. Next, install the knex package in this directory. For ease of running the migration scripts, you also need knex installed as a global package—this isn’t required for a regular application where you might wrap the locally installed Knex with package.json scripts, but it will make things more convenient for now.6 Finally, initialize a Knex project, which creates a configuration file for you. This can all be done by running the following commands:
$mkdir migrations&&cdmigrations$npm init -y$npm install knex@0.21 pg@8.2$npm install -g knex@0.21$knex init
Knex created a file for you named knexfile.js, which is used by the knex CLI utility to connect to your database. The file contains configuration and could be represented with a declarative format like YAML, but it’s common to pull in environment variables, which is why JavaScript is the default format. Open the file with a text editor to view its content. The file currently exports a single object with keys representing
environment names and values representing configuration. By defaul, the development environment uses SQLite, while the staging and production databases are set to
Postgres.
By having different environments defined within knexfile.js, you’re able to apply migrations to database servers across those different environments. For this project, you’re only going to use a single development configuration. Modify your migrations/knexfile.js file to resemble Example 8-11.
Example 8-11. migrations/knexfile.js
module.exports={development:{client:'pg',connection:{host:'localhost',port:5432,user:'user',password:'hunter2',database:'dbconn'}}};
Once that’s done, you’re ready to test the database connections. Run the following command:
$ knex migrate:currentVersion
> Using environment: development
> Current Version: none
The command displays the environment being used. (It defaults to development but can be overwritten using the NODE_ENV environment variable.) It also displays the migration version, which in this case is none. If you get an error, you may need to either modify the connection file or go back and run the Docker command to start Postgres, defined in “Running PostgreSQL”.
Creating a Schema Migration
Now that you’re able to connect to the database, it’s time to create your first schema migration. In this case, the migration is going to create a users table in the database. Run the following commands to create the migration and then to view a list of migrations:
$knex migrate:make create_users$ls migrations
The knex migrate:make command has created a new migrations/ directory, which is what Knex uses for keeping track of the schema migration files. It also generated a schema migration file for you. In my case, the name of the migration file
is 20200525141008_create_users.js. Yours will have a more recent date as part of the
filename.
Next, modify your schema migration file to contain the content displayed in Example 8-12.
Example 8-12. migrations/migrations/20200525141008_create_users.js
module.exports.up=async(knex)=>{awaitknex.schema.createTable('users',(table)=>{table.increments('id').unsigned().primary();table.string('username',24).unique().notNullable();});awaitknex('users').insert([{username:'tlhunter'},{username:'steve'},{username:'bob'},]);};module.exports.down=(knex)=>knex.schema.dropTable('users');
By default, schema migrations export two functions, one named up() and one named down(). In this case, you’re still exporting the two functions, albeit with slightly more modern JavaScript syntax. The up() method is called when a schema is being applied, and the down() method is called when it’s being “reversed” or “rolled back.”
The two methods make use of the Knex query builder interface for creating and dropping tables. The table being created is named users and has two columns, id and username. The query builder syntax used by Knex pretty cleanly maps to the underlying SQL query that is sent to the database. The up() method also inserts three users into the table.
The down() method performs the opposite operation. Technically, since the up() method performed two operations (creating a table and then adding users), the down() method should mirror those operations (deleting the users and destroying a table). But since dropping a table implicitly destroys the entries in it, the down() method only needs to drop the users table.
Next, run the following command to get a list of the migrations that Knex is currently aware of:
$ knex migrate:list
> No Completed Migration files Found.
> Found 1 Pending Migration file/files.
> 20200525141008_create_users.js
In this case, a single migration exists and has not yet been applied.
Applying a Migration
Now that your migration is ready, it’s time to run it. Run the following command to apply the migration:
$ knex migrate:up
> Batch 1 ran the following migrations:
> 20200525141008_create_users.js
The knex migrate:up applies the next migration in line based on the order of migration filenames. In this case, there was only a single migration to be made.
Now that your migration has been executed, you should take a look at the database schema to confirm that it worked. Execute the following command to run the psql command inside of the Postgres Docker container:
$dockerexec\-it distnode-postgres\psql -U user -W dbconn
When prompted, enter the password hunter2 and press enter. Once that’s done, you’re now using an interactive Postgres terminal client. Commands entered in this client will take place in the dbconn database. For now, it would be useful to get a list of the tables stored in the database. Within the prompt, type \dt to do just that. When I run that command on my machine, I get the following results:
 Schema |         Name         | Type  | Owner
--------+----------------------+-------+-------
 public | knex_migrations      | table | user
 public | knex_migrations_lock | table | user
 public | users                | table | user
The users entry refers to the users table that was created when you ran the database migration. Next, to see the entries inside this table, type the command SELECT * FROM users; and press enter again. You should see results like these:
 id | username
----+----------
  1 | tlhunter
  2 | steve
  3 | bob
In this case, the three users that were created as part of the migration script are displayed.
The Knex query builder has converted the query that you represented by chaining JavaScript object methods into an equivalent SQL query. In this case, the table that is generated inside of the database could have been created by using the following SQL query:
CREATETABLEusers(idserialNOTNULL,usernamevarchar(24)NOTNULL,CONSTRAINTusers_pkeyPRIMARYKEY(id),CONSTRAINTusers_username_uniqueUNIQUE(username));
While you’re still running the Postgres client, it’s worth taking a look at the migrations table that Knex also created. Run another query, SELECT * FROM knex_migrations;, and press enter. On my machine, I get the following results back:
 id |              name              | batch |      migration_time
----+--------------------------------+-------+---------------------------
  2 | 20200525141008_create_users.js |     1 | 2020-05-25 22:17:19.15+00
In this case, the 20200525141008_create_users.js migration is the only migration that has been executed. Some additional meta information about the query is also stored. Since migration information is stored in a database, any developer would be able to run additional migrations for a remote database host, such as a production database, without the need to keep track of which migrations had been run previously.
The other table, knex_migrations_lock, isn’t as interesting. It’s used to create a lock so that multiple people don’t attempt to run migrations simultaneously, which could result in a corrupted database.
The only thing more exciting than one migration is two migrations, so go ahead and create another one. This second migration builds on the changes made in the first migration. Again, run a command to create a new migration file:
$ knex migrate:make create_groupsNext, modify the migration file that was created. Make the file resemble the code in Example 8-13.
Example 8-13. migrations/migrations/20200525172807_create_groups.js
module.exports.up=async(knex)=>{awaitknex.raw(`CREATE TABLE groups (id SERIAL PRIMARY KEY,name VARCHAR(24) UNIQUE NOT NULL)`);awaitknex.raw(`INSERT INTO groups (id, name) VALUES(1, 'Basic'), (2, 'Mods'), (3, 'Admins')`);awaitknex.raw(`ALTER TABLE users ADD COLUMNgroup_id INTEGER NOT NULL REFERENCES groups (id) DEFAULT 1`);};module.exports.down=async(knex)=>{awaitknex.raw(`ALTER TABLE users DROP COLUMN group_id`);awaitknex.raw(`DROP TABLE groups`);};
This time, raw queries are being executed instead of using the query builder. Both approaches are fine when representing schema migrations. In fact, some queries may be difficult to represent using the query builder and may be better served by using raw query strings.
This query creates an additional table named groups and also alters the users table to have a group_id column that references the groups table. In this case, the second migration absolutely depends on the first migration.
Now that your second migration is ready, go ahead and apply it. This time, you’re going to use a slightly different command:
$ knex migrate:latestThis command tells Knex to run every migration, starting with the migration following the current representation of the database, until the final migration. In this case, only a single migration is run, specifically the create_groups migration. In general, you’re likely to run this version of the migrate command the most frequently, such as whenever you pull from the master branch of a repository.
Rolling Back a Migration
Sometimes an erroneous schema change will make its way into a migration file. Perhaps such a schema change is destructive and leads to data loss. Or perhaps a schema change adds support for a new feature that ends up getting dropped. In any case, such a migration change will need to be reversed. When this happens, you can run the following command to undo the last migration:
$ knex migrate:downIn my case, when I run this locally, I get the following output:
Batch 2 rolled back the following migrations:
20200525172807_create_groups.js
Once this command has been run, the second migration will be rolled back, but the first migration will still be present. In this case, the SQL statements in the down() method of the create_groups migration have been executed. Feel free to run the knex migrate:list command at this point if you don’t believe me.
There’s no way that Knex can enforce that a down migration will completely undo the changes made by an up migration. That is ultimately up to the engineer to do. Unfortunately some operations just don’t have a correlating undo. As an example of this, imagine the following up and down migrations:
-- WARNING: DESTRUCTIVE MIGRATION!-- MIGRATE UPALTERTABLEusersDROPCOLUMNusername;-- MIGRATE DOWNALTERTABLEusersADDCOLUMNusernameVARCHAR(24)UNIQUENOTNULL;
In this case, the up migration drops the username column, and the down migration adds the username column back. But the data that existed in the column has now been destroyed, and no amount of reverse migrations is going to get it back, either. What’s more, assuming there’s at least one user in the table, the down migration will fail because the unique constraint won’t be met—every username will be set to a null value!
One way these issues are sometimes discovered is after a code commit has been merged. For example, maybe a bad migration was merged and then run against the staging environment. At this point, all of the user accounts in the staging database have been corrupted and might need to be repaired. Some organizations copy production data into staging as part of a nightly task while anonymizing user data. In this case, the data will eventually be repaired in staging. Such safeguards aren’t always present for production.
In these situations, the migration should never be run in production. The way Knex works is that it runs each migration serially until the most recent is run. One way to fix these situations is to run the appropriate migrate down commands anywhere the database has been affected (in this case, the staging environment and the developer’s local environment). Next, delete the erroneous migration file entirely. This can probably be done in a single revert commit.
Later, when a future migration is run against the production database, the destructive migration won’t be present at all, and the data loss should be avoided.
Live Migrations
It’s nearly impossible to time a database migration to happen at the exact moment that application code changes are deployed. The timing difference between these two operations is further complicated by migrations that take a long time to complete, like when a database table contains many rows that need to be backfilled, as well as due to the need to run multiple service instances, particularly when old and new versions overlap during deployment.
This difference in timing can lead to an application deployment that is momentarily broken. Figure 8-2 shows how such a situation can occur.
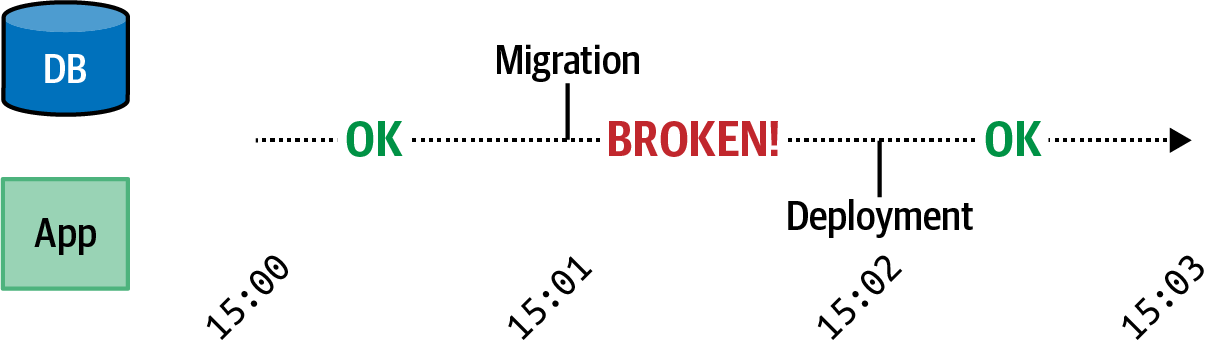
Figure 8-2. Broken migration timeline
In this case, the application is running just fine at 15:00. At 15:01, a migration is applied, and the application code has become incompatible with the database schema. The application is currently broken. Next, a code deployment happens at 15:02. Once that happens, the application and schema are now compatible again.
One way to mitigate this incompatibility is to put an application in “maintenance mode.” In this mode, requests from users are blocked before they can reach the application. One way to do this is to configure a reverse proxy to serve a static maintenance page, deploy application code and apply database migrations, and then disable the maintenance page. If your application is only used during certain times of the day and by users in a limited geographical region, then performing such a migration during off-hours might be acceptable. But if you receive traffic during all hours, then such an approach is going to result in a poor user experience.
A live migration is a migration that happens in a way that doesn’t cause the application to go offline. Simple operations, such as adding a new optional database column, can take place using a single commit. This commit can contain the migration to add the column and the code change to read and write to the column, provided the migration is run first. More complex migrations, however, take multiple commits, each with different combinations of code changes and migration changes, in order to prevent a breaking change from happening.
Live migration scenario
As an example of this, pretend that you have the following database table being used by your application:
CREATETABLEpeople(idSERIAL,fnameVARCHAR(20)NOTNULL,lnameVARCHAR(20)NOTNULL);
And the corresponding application code to interact with this table looks like this:
asyncfunctiongetUser(id){constresult=awaitdb.raw('SELECT fname, lname FROM people WHERE id = $1',[id]);constperson=result.rows[0];return{id,fname:person.fname,lname:person.lname};}asyncfunctionsetUser(id,fname,lname){awaitdb.raw('UPDATE people SET fname = $1, lname = $2 WHERE id = $3',[fname,lname,id]);}
However, one day your company realizes that there are users with names that don’t match the first name and last name pattern and that it’s really just better for everyone involved to keep track of a single name entry.7 In this situation, you’d like to replace the existing fname and lname columns with a name column. You’d also like to copy the existing name columns for use with the new name column, all without causing the application to go down.
This is the perfect scenario for a multistage live migration. In this case, the transition from the old schema to the new schema can be represented using three commits.
Commit A: Beginning the transition
For this first step, you’re going to add the new name column and configure the application to write to the new column but read from either the old fname and lname columns or the new name column, whichever has data.
A few migration queries need to be run for this to work. For one thing, the new name column needs to be added. Even though it will eventually need the same NOT NULL constraint used by the existing name columns, you can’t add that constraint just yet. This is because the columns will start off having no data, and the unmet constraint would cause the ALTER query to fail.
Another change that needs to be made is that the previous NOT NULL constraint on the name columns needs to be dropped. This is because newly added rows won’t contain data in the old columns.
Here’s what the migration up() queries look like:
ALTERTABLEpeopleADDCOLUMNnameVARCHAR(41)NULL;ALTERTABLEpeopleALTERCOLUMNfnameDROPNOTNULL;ALTERTABLEpeopleALTERCOLUMNlnameDROPNOTNULL;
The code should then read from the new column, if present, or fall back to data stored in the old column, as well as write to the new name column. In this case, a name column with a null value means that the row has not yet transitioned to the new format. As part of this first commit, you’ll also need to refactor the application to use a single name property instead of the separate fname and lname properties.
The code changes look like this:
asyncfunctiongetUser(id){constresult=awaitdb.raw('SELECT * FROM people WHERE id = $1',[id]);constperson=result.rows[0];constname=person.name||`${person.fname}${person.lname}`;return{id,name};}asyncfunctionsetUser(id,name){awaitdb.raw('UPDATE people SET name = $1 WHERE id = $2',[name,id]);}
At this point, you can combine the migration and the code change into a single version control commit. You will, however, need to apply the migration before the code changes are deployed. This is because the application code now expects the name
column to be present, as seen in the setUser() function.
Commit B: Backfill
Now it’s time to backfill the name column in the database. A backfill is when data that is missing is retroactively provided. In this case, the name column needs to be set to a combination of the fname and lname fields.
Such an operation can be represented using a single SQL query. In this example, the up() schema migration might run the following SQL command:
UPDATEpeopleSETname=CONCAT(fname,' ',lname)WHEREnameISNULL;
If your database has a lot of data, then this query will take a long time and will result in many rows being locked. When this happens, certain interactions with the database will need to wait for the migration to finish. This effectively introduces downtime to your application, the very thing you were trying to avoid with a live migration!
To get around this, you may need to break the query up and run it against smaller sets of data in the database. For example, you could modify the query to affect chunks of 1,000 rows at a time by adding an additional clause to it:
WHEREnameISNULLANDid>=103000ANDid<104000
In this example, the migration is on the 103rd iteration of a loop.
Other backfill operations may require additional work. For example, if you have a column that contains a user’s GitHub numeric ID and you want to add a column that contains their GitHub username, then you would need a complex application to loop through every record in the database, make a GitHub API request, and then write the data back. Such a backfill could take days to run.
No application code changes are needed to accompany this commit, so your application shouldn’t require a deployment.
Commit C: Finishing the transition
Finally, you’re ready to add the constraints to the new column and to drop the old columns. The application code can also be modified to only look at the new column and to disregard the previous names.
The up() migration to complete this process will involve the following queries:
ALTERTABLEpeopleALTERCOLUMNnameSETNOTNULL;ALTERTABLEpeopleDROPCOLUMNfname;ALTERTABLEpeopleDROPCOLUMNlname;
Within this same commit, you can also finish the transition of the getUser() method to no longer contain the fallback for the now-missing fname and lname columns:
asyncfunctiongetUser(id){constresult=awaitdb.raw('SELECT name FROM people WHERE id = $1',[id]);return{id,name:result.rows[0].name};}
The setUser() method in this case doesn’t need any changes since it’s already writing to the new column. The migration can run either before or after the deployment in this case.
The timeline for this multistage live migration now resembles Figure 8-3. While it’s certainly more complex than before, it does lead to a situation where the application is always compatible with the database.
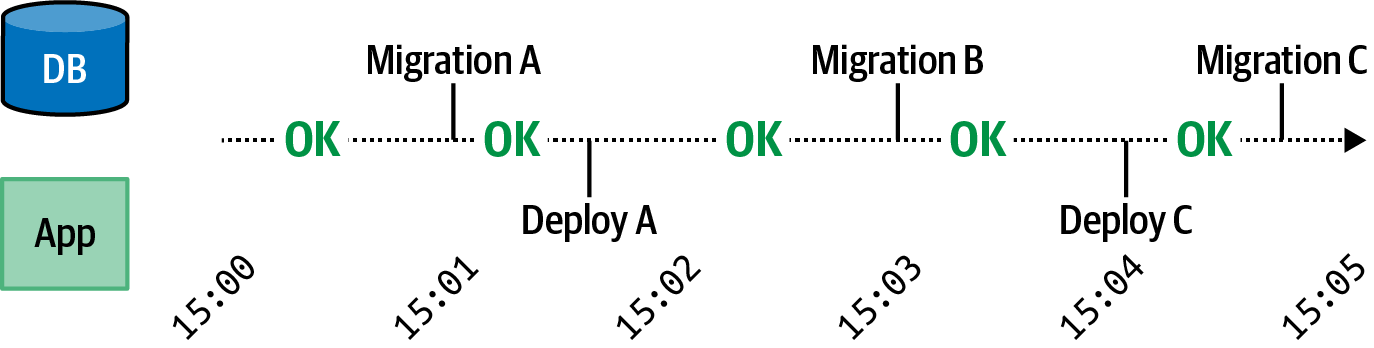
Figure 8-3. Working migration timeline
In this case, the application is running just fine at 15:00. At 15:01 the first migration is run. The application is still compatible with the schema since there’s just a new column being added that the application is ignoring. Next, around 15:02, deployment A happens. The application is still compatible with the schema, and it’s now writing to the new column and reading from all columns. At 15:03 migration B happens and data gets backfilled. The code is still compatible and encounters rows that either have a name column with data or an empty name column. Around 15:04 another deployment happens where the code is only reading from the new name column. Finally, around 15:05, the final schema migration happens.
This is just an example of one form of live migration. As you perform other mutations to your database, you’ll need to change the steps and the queries involved. One rule of thumb is to always test migrations locally or in a staging environment before performing them in production. Test suites often aren’t designed with schema mutations in mind, and it can be difficult to spot migration failures.
Idempotency and Messaging Resilience
Clients need to know the outcome of a write operation carried out by a server; there’s a reason why they requested the write to happen, after all. For example, if a web server that a user is interacting with sends a message to an account server to make a purchase, then the web server will need to provide the result of the operation to the user agent. If the purchase fails, then the user may want to try again, or they may want to purchase something else. If it succeeds, then the user will expect to have less money in their account. But what does the web server do if it doesn’t know the result of the account server’s write operation?
Distributed applications communicate by sending messages to one another over a network. Not only are applications unreliable—a Node.js server may throw while processing a request—but the very network over which they communicate is also unreliable. Generally there are two types of errors that need to be dealt with in these scenarios. The first has to do with the lower-level protocol being used, such as an inability to communicate with a remote host via TCP. The second has to deal with whatever higher-level protocol is being used, like a 500 error via HTTP.
High-level errors are usually easier to deal with. When an operation fails, the server provides information to the client about that failure over HTTP. The client can then use this information to make an informed decision. For example, a 404 response means that the resource being acted upon does not exist. Depending on the work being performed by the client, this might not be a big deal, like if a client is polling to see if a resource has been created yet, or it might be a huge deal, like if someone is checking to see if they’re still employed.
Low-level errors require more work. These errors usually involve a communication breakdown, and it’s not always possible to know if the server received the message or not. If it did receive the message, it’s not possible to tell if the server processed the message or not. Figure 8-4 shows how these different scenarios play out.
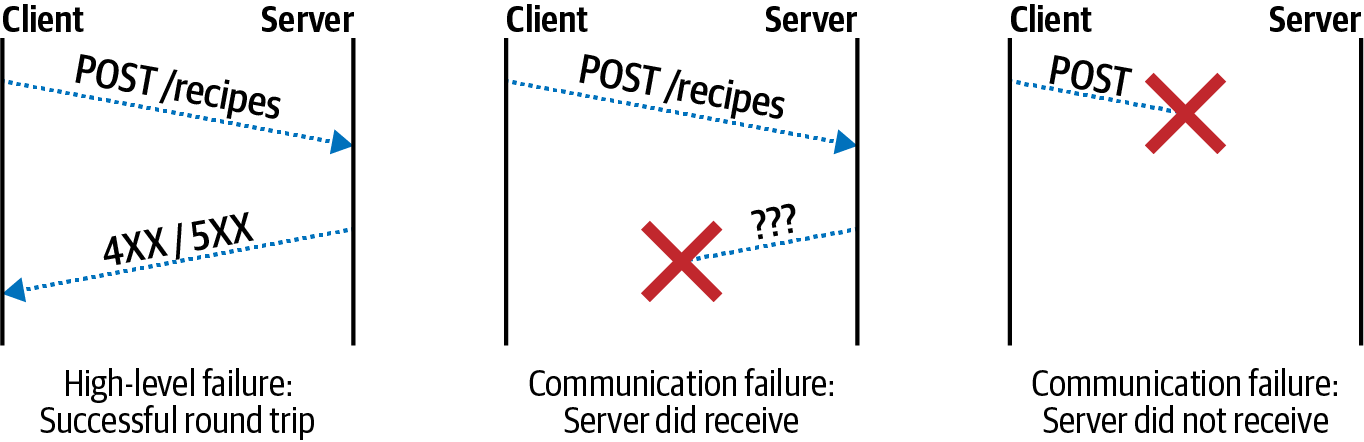
Figure 8-4. Protocol errors
In the first example, a high-level error has occurred. In this case, the request/response lifecycle successfully completed and the high-level HTTP protocol error was communicated to the client. In the second example, the server did receive and process the request (like making a database change), but the client didn’t receive a response. In the third example, the server neither received nor processed the request. In this case, the client can’t necessarily distinguish between the second and third scenarios.
There is a finite number of errors that are surfaced to application code from the underlying Node.js network APIs. These errors are applicable regardless of which higher-level protocol is used, such as HTTP or gRPC. Table 8-3 contains a list of these errors and what they mean. These error codes are provided as an Error#code property and are exposed via error callbacks, event emitter error events, and promise rejections.
| Error | Context | Ambiguous | Meaning |
|---|---|---|---|
|
Server |
N/A |
Cannot listen on port due to permissions |
|
Server |
N/A |
Cannot listen on port since another process has it |
|
Client |
No |
Client unable to connect to server |
|
Client |
No |
DNS lookup for the server failed |
|
Client |
Yes |
Server closed connection with client |
|
Client |
Yes |
Connection to server has closed |
|
Client |
Yes |
Server didn’t respond in time |
The first two errors, EACCESS and EADDRINUSE, usually happen early in the lifetime of a process when a server attempts to listen. EACCESS means that the user running the process doesn’t have permission to listen on a port and is often the case when a non-root user listens to a low port, meaning 1024 and below. EADDRINUSE happens when another process is already listening on the specified port and interface.
The other errors are applicable to the client and message resiliency. ECONNREFUSED and ENOTFOUND happen early in the network connection process. They can precede every individual message, like an HTTP request made without a keep alive connection. Or they can happen early on during a long-lived connection like gRPC. Notably, these errors happen before a message is sent to the server, so when they’re surfaced, there isn’t ambiguity about whether or not the server received and processed the
message.
The final three errors can happen during the middle of a network conversation and come with message delivery ambiguity. They can happen before or after the server receives and processes a message, leading to the third situation in Figure 8-4. With these errors, it’s not possible to tell if a message was received.
Depending on the situation, and the properties of the message being sent, the client may attempt subsequent deliveries of the message.
HTTP Retry Logic
“Request and Response with HTTP” already covers some details about HTTP, but in this section, further consideration is given to resiliency of messages, in particular the conditions in which a request can be repeated. Figure 8-5 contains a flowchart that you can follow when designing your own retry logic.
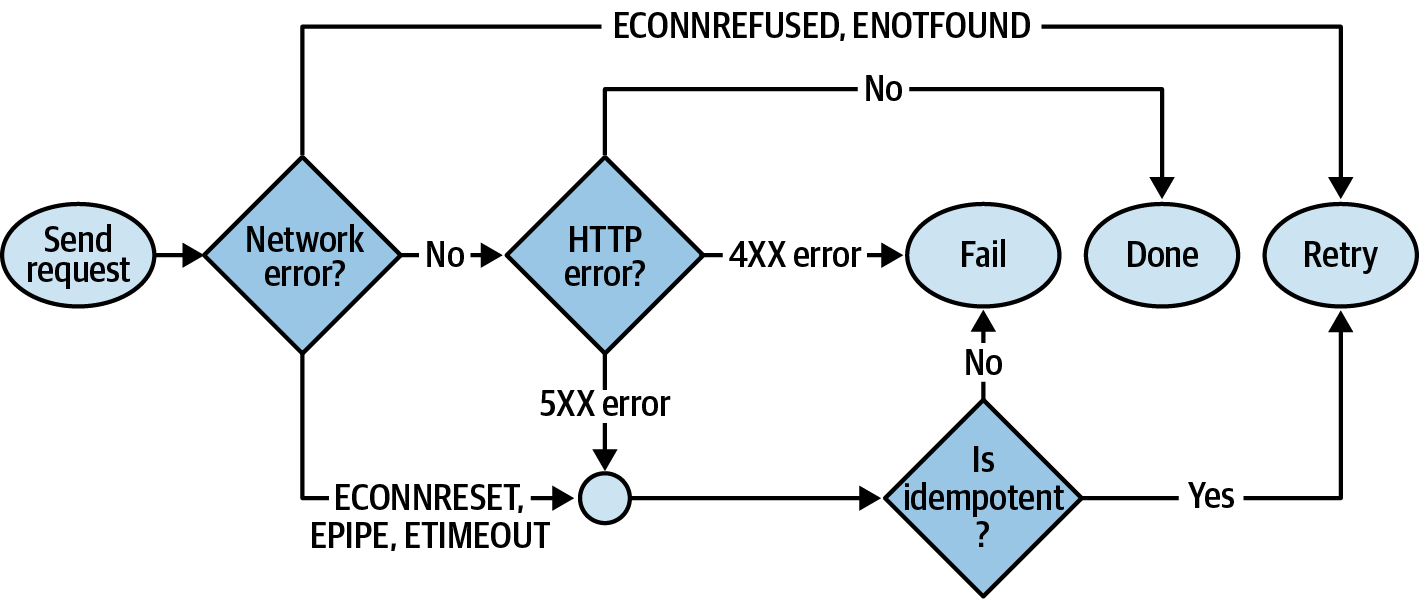
Figure 8-5. HTTP retry flowchart
First, the low-level errors from Table 8-3 still apply. If an HTTP request results in a network error of ECONNREFUSED or ENOTFOUND, then the client is free to attempt the request again. However, the network errors ECONNRESET, EPIPE, and ETIMEDOUT, as well as HTTP errors in the 5XX range, require some further consideration. If the request is considered idempotent, then it may be retried; otherwise, the request should be considered a failure at that point. If an HTTP 4XX error is received, then the message should also fail. And if no HTTP error is received, then the request was successfully sent and the process is complete.
Table 8-4 contains a list of the popular HTTP methods often supported by HTTP APIs, as well as details about the methods such as if they’re idempotent or potentially destructive.
| Method | Idempotent | Destructive | Safe | 4XX | 5XX | Ambiguous | Purpose |
|---|---|---|---|---|---|---|---|
|
Yes |
No |
Yes |
No Retry |
Retry |
Retry |
Retrieve resource(s) |
|
No |
No |
No |
No Retry |
No Retry |
No Retry |
Create resource |
|
Yes |
Yes |
No |
No Retry |
Retry |
Retry |
Create or modify resource |
|
No |
Yes |
No |
No Retry |
Retry |
Retry |
Modify resource |
|
Yes |
Yes |
No |
No Retry |
Retry |
Retry |
Remove resource |
This table is based on many assumptions and requires that an HTTP API adheres to HTTP standards, like those defined in RFC7231. For example, a GET request shouldn’t modify any data (perhaps a write to a secondary system is made for tracking rate limits or analytics, but otherwise, the primary data store should not be affected). If the HTTP standards are violated by an API, then it’s no longer possible to make any assumptions about retry safety.
A request can be repeated multiple times without side effect if it is idempotent. For example, if a client requests DELETE /recipes/42, then the record will be deleted. If this is repeated, then the record isn’t any more or less deleted. Even though the first request might succeed with a 200 status and future requests might fail with a 404 status, the request itself is still idempotent. This is based on the assumption that a URL represents a specific resource, and that other resources can’t reuse a URL.
A message is destructive if it can lead to loss of data. For example, a PUT and a PATCH request may overwrite data that was recently set by another client’s request, and a DELETE will definitely destroy data. In these situations, a server may choose to implement the ETag and If-Match HTTP headers to provide additional semantics to avoid data clobbering. This is similar to the Memcached CAS concept mentioned in “Introducing Memcached”.
A message is safe if it doesn’t modify resources. In this list, only the GET method is safe.
Any message that results in a 4XX HTTP error should not be retried. In this situation, the client has made some sort of mistake with the request (such as providing data of the wrong type). Re-attempting the same request should always result in failure.
To further complicate things, depending on which specific 5XX error is encountered, the client may technically be able to assume that the server did receive the message but did not attempt to process it. For example, a 503 Service Unavailable error might mean that the server received the message but did not have a connection to a database. Perhaps you can get away with such assumptions when dealing with an internal service. However, when dealing with 5XX errors generally, especially ones from external services, it is safest to assume that the state of the server is unknown.
A mechanism that a server may choose to implement that makes every request idempotent is an idempotency key. An idempotency key is metadata that is provided by the client when making a request to a server. In the case of the Stripe API, clients may send a Idempotency-Key header, and with the PayPal API, clients can provide a PayPal-Request-Id header. When the server receives a request with this key, it first checks a cache for the presence of the key. If the entry is present in the cache, then the server immediately replies with the cached entry. If the entry is missing in the cache, the server carries out the request as usual and then writes the response to the cache and replies to the request. Entries in the cache can then be cleared out after a set amount of time (Stripe clears after 24 hours) since repeat requests after a long time are rare (retries should realistically happen over the course of minutes). Consider supporting idempotency keys in your API if the side effect of duplicated requests can be costly.
Circuit Breaker Pattern
Sometimes, a message or two gets lost over the network. Other times, a service is just down. Try as it might, a client won’t be able to contact a fallen server. In these situations, it’s often better for a client to give up for a while. By giving up, the client is able to fail incoming requests quicker (if appropriate), less wasted requests will flood the network, and an overwhelmed server may be free to successfully respond to other incoming requests. This approach of not making outbound requests when a server is perceived to be down is called the circuit breaker pattern.
Clients have many options to choose from for determining when a client is down. For example, they may choose to define a threshold before flipping the circuit breaker, such as if ten 500 errors are encountered within 60 seconds. Other approaches might involve checking the response time of a service, considering one to be down if it takes longer than 200 milliseconds to reply.
Things get more tricky when it comes to differentiating services from one another. For example, when you worked with Kubernetes, you created a Service object that abstracted the individual service instances away from you. In that situation it’s impossible to differentiate a faulty service instance from a healthy service instance. Luckily, Kubernetes may handle the health checks and can clean up a service automatically. With other technologies, such as Consul by HashiCorp, it’s possible to build a system where applications maintain an in-memory list of host and port combinations representing service instances. In that situation it’s possible to apply a circuit breaker on an individual-instance basis.
When it comes to communicating with outside services, such as the GitHub API, you’ll probably never know which underlying service instance is responding to a request; you just know that “the GitHub API is down.” In these situations, you may need to circuit-break the entire third-party API. This can be done by keeping a failure counter in a fast, in-memory database like Redis. When the number of 500 errors or ECONNREFUSED errors reaches a threshold, your services will then give up making requests and will instead fail immediately.
Exponential Backoff
The naive approach for having a client retry a request to an external service is to simply have it make the request again as soon as the failure happens. Then, if that retry fails, make another one immediately. This approach may not help requests succeed and may also exacerbate the problem.
Figure 8-6 contains an example of a client using immediate retries. In this diagram, service instance A crashes. All the while, a client is making requests to the service. Once the client starts receiving failures, it begins sending requests much more rapidly. When this happens the client ends up working harder than it should, and the network is flooded with wasteful requests. Even once the new service instance B does start, it still needs to go through a startup phase where it may continue to fail any requests that it receives. When this happens the service may work harder than it needs to in order to respond to requests.
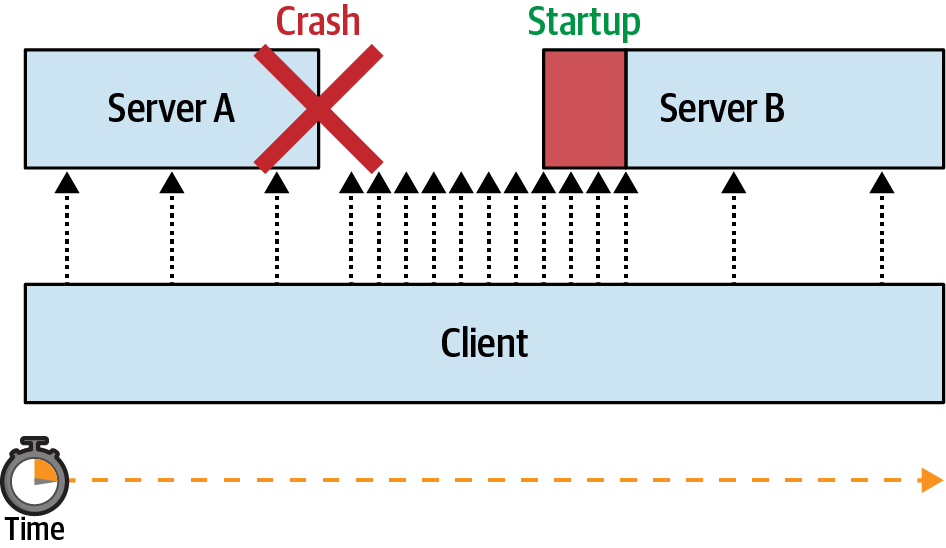
Figure 8-6. Without exponential backoff
When you worked with Kubernetes, you might have noticed that a common theme within the cluster is that it takes time for applications to reach a desired state. For one reason, it takes time for an application to start and for it to establish connections to external services such as databases. Another reason is that it takes time for Kubernetes to notice that a health check is failing and to restart a service. Because such deployments and restarts take time, request re-attempts should also take time.
Often, when there’s a problem communicating with a service, it might just be a temporary blip. For example, a single network message might be dropped within the span of 1ms. Other times, the service might be down for a longer amount of time. For example, it might have lost a connection to the database and will need to re-establish a new connection, taking a second or two. Still, in other situations, the amount of time it takes for the server to come back is even longer, like when a health check fails and an instance is rebooted, taking up to a minute. Finally, sometimes a service can be down for hours, like when a DNS misconfiguration is deployed and an engineer needs to manually roll back.
Because of this wide range of time that a service might be down, and the cost incurred by making failed requests, a different approach needs to be taken for retrying requests. Currently, the industry standard is called an exponential backoff. With this approach, the client starts by making retry attempts quickly but then slows down over time. For example, a service might choose to make request retries using the following schedule:
100ms | 250ms | 500ms | 1000ms | 2500ms | 5000ms | 5000ms | ...
In this case, the first retry happens in 100 milliseconds, the second at 250 milliseconds, and so on, until it reaches 5 seconds, at which point it continues to retry at a rate of once every 5 seconds. Of course, this approach isn’t exactly exponential. It is, however, easy to reason about, being rounded to values familiar to humans. Once the application gets to the point where it’s making requests every 5 seconds, it’s very unlikely to overwhelm any service.
This approach can be used with the ioredis package that you previously worked with. The ioredis package has retry support built into the package. Here’s an example of how to adapt this connection retry schedule:
constRedis=require('ioredis');constDEFAULT=5000;constSCHEDULE=[100,250,500,1000,2500];constredis=newRedis({retryStrategy:(times)=>{returnSCHEDULE[times]||DEFAULT;}});
In this case, the retrySchedule() method accepts an argument, which is the current reattempt number. The method then returns a value, which is the amount of time to wait before reconnecting in milliseconds. The function itself tries to grab a value from the retry schedule, falling back to a default value if missing in the schedule.
Depending on the operation, it may make sense to choose a different retry schedule. For example, for a service that depends on a database connection to function, this schedule might be fine. Once the application reaches the five second mark, it will continue to try to reconnect to the database forever. However, for other requests, like an HTTP request to an upstream service made as part of an incoming request from a downstream service, it wouldn’t be helpful to keep the incoming request open for too long. In that case, it might make sense to have a finite schedule containing three retries. When performance is more important, it also makes sense that the retries fire much quicker. For example, an HTTP retry schedule might look more like this:
10ms | 20ms | 40ms | quit
While exponential backoff seems like a great solution to the retry problem, it can cause some other problems when used with internal services. For example, say that there is a fleet of 10 clients communicating with a single server. Each of the clients sends the server a steady stream of requests. Then, the service dies for several seconds before being started again. When this happens, each of the clients will probably notice that the service is down at the same time. They’ll then start re-attempting requests to the server with the exponential backoff schedule. But this means that each of the clients is now making requests at the same time. When the server finally does come back up, it will receive a barrage of requests all at the same time! This may cause the server to receive waves of traffic, where the server is doing no work for some periods of time and overwhelmed at other periods of time. This is a phenomenon known as the thundering herd. Figure 8-7 shows an example of this happening.
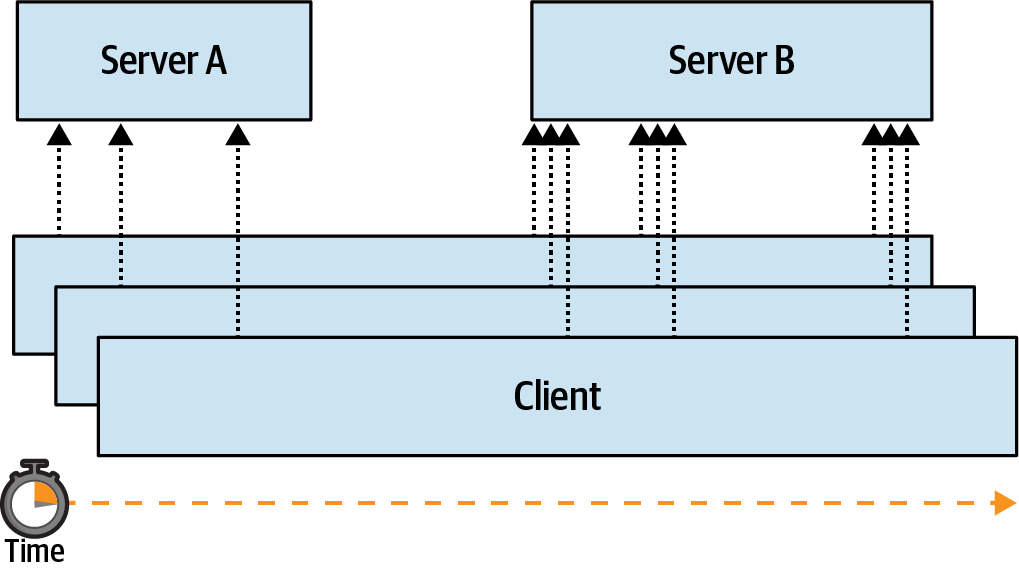
Figure 8-7. Thundering herd
To overcome this issue, you may want to introduce jitter to your applications. Jitter is random variance, such as an increase or decrease of request timing of ±10%. When this happens, some clients end up quicker and some end up slower. This helps spread out the message retries over time and may eventually reach a request rate that is evenly distributed across all clients.
Random jitter can be introduced to the previous example like so:
constredis=newRedis({retryStrategy:(times)=>{lettime=SCHEDULE[times]||DEFAULT;returnMath.random()*(time*0.2)+time*0.9;// ±10%}});
The concept of jitter is useful in other situations as well. For example, an application may need to buffer stats in memory and flush it to a database every minute. This can be pulled off by making a setInterval(fn, 60_000) call once when the application starts. However, the same thundering herd problem exists. Applications are often deployed in a fleet all at once. This can mean that when deploying 10 applications, 10 flushes will happen at the same time every minute, periodically overwhelming the database.
Instead, jitter can be calculated randomly on a per-process basis when the process starts, where the jitter value is a number between zero and the interval of time. For example, when calculating an interval for an operation happening every minute, you might write code that looks like this:
constPERIOD=60_000;constOFFSET=Math.random()*PERIOD;setTimeout(()=>{setInterval(()=>{syncStats();},PERIOD);},OFFSET);
With this approach, instance A might get an offset of 17 seconds, instance B an offset of 42 seconds, and instance C an offset of 11 seconds. This would then result in a request schedule like the following:
071 077 102 131 137 162 191 197 222
But without jitter, the request timeline would instead look like this:
060 060 060 120 120 120 180 180 180
Resilience Testing
As an engineer it’s far too easy to treat error scenarios as a second-class citizen. Engineers may only test the happy paths of an application, both when it comes to interacting with a new feature via a UI as well as writing unit tests. When only the successful uses of a feature are tested, an application is left wide open for failure when it’s no longer run on a developer’s laptop and is shipped to production. Failure in a distributed environment can be further compounded because an error in one application can lead to errors in other applications—usually without the original stack trace to debug with.
One philosophy for enforcing that such errors are dealt with is called chaos engineering. This is an approach where failures are introduced randomly into an environment. By turning what are usually rare failures into an everyday occurrence, engineers are forced to deal with them sooner rather than later, lest they face the wrath of the midnight pager. This approach to testing failures is something that you may consider using within your organization, though it requires a very disciplined collection of developers to achieve.
The first thing you’ll need to consider when introducing chaos into an organization is in which environments the chaos should be enabled. While introducing chaos to production may be the ultimate test of a system’s ability to be resilient to failure, starting with the staging environment is going to be much easier to get management buy-in.
Another thing that needs to be considered is what types of chaos should be introduced into a system. When it comes to planning, it’s important to consider realistic failure situations within a real-world application. Here are some examples of the types of chaos that can be introduced into a Node.js application based on some of the common failure boundaries I’ve encountered within the applications I’ve worked on.
Random Crashes
One of the themes that has been repeated throughout this book is that process instances will die. Because of this it’s important to keep state outside of the application instance. It’s also important that when a client gets a failure when communicating with a server, the client attempts to retry the request when appropriate.
Example 8-14 is an example of how you might introduce random crashes into an application.
Example 8-14. Random crash chaos
if(process.env.NODE_ENV==='staging'){constLIFESPAN=Math.random()*100_000_000;// 0 - 30 hourssetTimeout(()=>{console.error('chaos exit');process.exit(99);},LIFESPAN);}
The first thing this example does is check what environment it’s running in. In this case, the chaos is only introduced if run within the staging environment. Next, a lifespan for the process is calculated. In this case, the number is calculated to be some time between 0 and 30 hours of time. Next, a function is scheduled to fire once that amount of time has been met. Once the timer fires, the application will exit. In this example, the exit status is set to 99, and a message is also printed to stderr. This is helpful for debugging the reason for a crash; without it, an engineer might waste a bunch of time trying to fix an application that crashed intentionally.
Assuming your application is being run in an environment where some sort of supervisor is keeping an eye on it (such as Kubernetes), the process should be restarted once it crashes. Once it crashes, there will be a period of time when requests made to the service will fail. It’s now up to the client in those situations to implement retry logic. Consider tweaking the amount of time between crashes depending on your environment; maybe it should crash every two minutes on a development laptop, every few hours in staging, and once a week in production.
Event Loop Pauses
When the event loop in your JavaScript-based Node.js application pauses, the entire application comes to a standstill. During this time it is unable to process requests. Interesting race conditions with asynchronous timers can also sometimes appear when this happens. Assuming the process is incapable of responding to requests for long enough, it might even fail a health check and be considered for recycling.
Example 8-15 demonstrates how to introduce random pauses to your application.
Example 8-15. Random event loop pauses
constTIMER=100_000;functionslow(){fibonacci(1_000_000n);setTimeout(slow,Math.random()*TIMER);}setTimeout(slow,Math.random()*TIMER);
In this case, the application runs a timer randomly between 0 and 100 seconds, randomly rescheduling to be run again until the process dies. When the timer fires, it performs a Fibonacci calculation for a million iterations. The Fibonacci calculation will take some amount of time depending on the version of the V8 engine being used and the speed of the CPU that the application is running on. Consider finding a number, or a random range of numbers, that will cause your application to freeze for multiple seconds.
Random Failed Async Operations
One of the most common failure scenarios is when asynchronous operations are made. Errors are fairly common when an HTTP request is made, a file is read, or a database is accessed. Unlike the previous two examples, which run globally, this example requires some slight modifications to application code. In this case, a new function is added at the boundary where the application communicates with the underlying library.
Example 8-16 shows how to introduce random failures to asynchronous calls in your application.
Example 8-16. Random async failures
constTHRESHOLD=10_000;asyncfunctionchaosQuery(query){if(math.random()*THRESHOLD<=1){thrownewError('chaos query');}returndb.query(query);}constresult=awaitchaosQuery('SELECT foo FROM bar LIMIT 1');returnresult.rows[0];
This particular example provides a new method, chaosQuery(), which can be used as a replacement for an existing package that exposes a db.query() method. In this example, approximately 1 out of every 10,000 database queries will result in an error. This simple asynchronous method wrapper can be applied in other situations as well, like when making HTTP calls with the node-fetch package.
1 An exit status can also be set by assigning a code to process.exitStatus and then calling process.exit() without an argument.
2 There’s also a process.abort() method available. Calling it immediately terminates the process, prints some memory locations, and writes a core dump file to disk if the OS is configured to do so.
3 The deprecated internal domain module provides a way to capture error events from many EventEmitter instances.
4 I reported this issue to the package author two years ago. Fingers crossed!
5 Languages like Rust and C++ allow for extremely accurate memory calculations; with JavaScript, we can only work with approximations.
6 You can also avoid globally installing knex by prefixing each of the commands with npx, such as npx knex init.
7 Some systems think that my first name is “Thomas Hunter” and my last name is “II.”