Chapter 10. From Monitoring to Observability
As I’ve shown so far, I hope, breaking our system up into smaller, fine-grained microservices results in multiple benefits. It also, as we’ve also covered in some depth, adds significant sources of new complexity. In no situation is this increased complexity more evident than when it comes to understanding the behavior of our systems in a production environment. Very early on, you’ll find that the tools and techniques that worked well for relatively simpler single-process monolithic applications don’t work as well for your microservice architecture.
In this chapter, we’ll look at the challenges associated with monitoring our microservice architecture, and I’ll show that although new tools can help, fundamentally you may need to shift your entire mindset when it comes to working out what the hell is going on in production. We’ll also talk about the increased focus on the concept of observability—understanding how to make it possible to ask questions of our system so we can work out what is going wrong.
Production Pain
You won’t truly appreciate the potential pain, suffering, and anguish caused by a microservice architecture until you have it running in production and serving real traffic.
Disruption, Panic, and Confusion
Picture the scene: it’s a quiet Friday afternoon, and the team is looking forward to slipping out early to the pub as a way to start a weekend away from work. Then suddenly the emails arrive. The website is misbehaving! Twitter is ablaze with your company’s failings, your boss is chewing your ear off, and the prospects of a quiet weekend vanish.
Few things sum up the problem up as well as the following tweet:
We replaced our monolith with micro services so that every outage could be more like a murder mystery.1
Tracking down what’s gone wrong, and what caused it, is our first port of call. But this gets difficult if we have a long list of suspects.
In the world of the single-process monolithic application, we at least have a very obvious place to start our investigations. Website slow? It’s the monolith. Website giving odd errors? It’s the monolith. CPU at 100%? Monolith. A burning smell? Well, you get the idea.2 Having a single point of failure makes failure investigation somewhat simpler!
Now let’s think about our own microservice-based system. The capabilities we offer our users are served from multiple microservices, some of which communicate with yet more microservices to accomplish their tasks. There are lots of advantages to such an approach (which is good, as otherwise this book would be a waste of time), but in the world of monitoring, we have a more complex problem on our hands.
We now have multiple servers to monitor, multiple log files to sift through, and multiple places where network latency could cause problems. Our surface area of failure has increased, and so have the things that need to be investigated. So how do we approach this? We need to make sense of what otherwise might be a chaotic, tangled mess—the last thing any of us wants to deal with on a Friday afternoon (or at any time, come to that!).
Firstly, we need to monitor the small things and provide aggregation to allow us to see the bigger picture. Then, we need to make sure we have tools available to us to slice and dice this data as part of our investigation. Finally, we need to get smarter about how we think about system health, by embracing concepts like testing in production. We’ll discuss each of these necessities in this chapter. Let’s get started.
Single Microservice, Single Server
Figure 10-1 presents a very simple setup: one host that is running one instance of a microservice. Now we need to monitor it in order to know when something goes wrong, so we can fix it. So what should we look for?
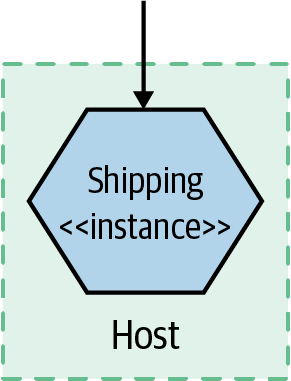
Figure 10-1. A single microservice instance on a single host
First, we’ll want to get information from the host itself. CPU, memory—all of these things can be useful. Next, we’ll want to have access to the logs from the microservice instance itself. If a user reports an error, we should be able to see the error in these logs, hopefully giving us a way to work out what went wrong. At this point, with our single host, we can probably get by with just logging locally to the host and using command-line tools to look at the log.
Finally, we might want to monitor the application itself—observing it from the outside. At a bare minimum, monitoring the response time of the microservice is a good idea. If you have a web server fronting your microservice instance, you could perhaps just look at the logs of the web server. Or perhaps you can get a bit more advanced, using something like a health check endpoint to see if the microservice is up and “healthy” (we’ll explore what this means later).
Time passes, loads increase, and we find ourselves needing to scale…
Single Microservice, Multiple Servers
Now we have multiple copies of the service running on separate hosts, as shown in Figure 10-2, with requests to the different instances distributed via a load balancer. Things start to get a bit trickier now. We still want to monitor all the same things as before, but we need to do so in such a way that we can isolate the problem. When the CPU is high, is it a problem we are seeing on all hosts, which would point to an issue with the service itself? Or is it isolated to a single host, implying that the host itself has the problem—perhaps a rogue OS process?
At this point, we still want to track the host-level metrics, and perhaps maybe even alert on them when they pass some sort of threshold. But now we want to see what they are across all hosts, as well as individual hosts. In other words, we want to aggregate them up and still be able to drill down. So we need something that can collect all these metrics from across the hosts and allow us to slice and dice them.
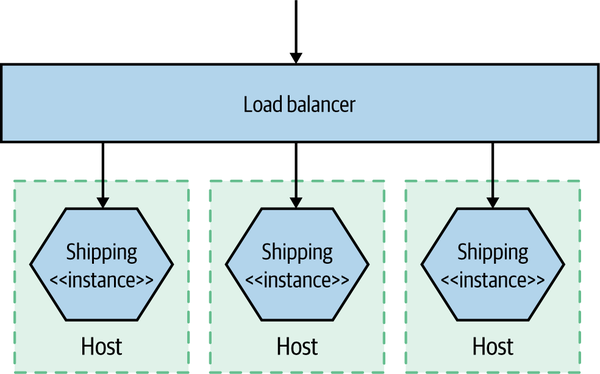
Figure 10-2. A single service distributed across multiple hosts
Then we have our logs. With our service running on more than one server, we’ll probably get tired of logging into each box to look at it. With just a few hosts, though, we can use tools like SSH multiplexers, which allow us to run the same commands on multiple hosts. With the help of a big monitor, and running grep "Error" on our microservice log, we can find our culprit. I mean, this isn’t great, but it can be good enough for a while. It will get old pretty fast though.
For tasks like response time tracking, we can capture response times at the load balancer for downstream calls to microservices. However, we also have to consider what happens if the load balancer is turning out to be the bottleneck in our system—capturing response times both at the load balancer and at the microservices themselves could be needed. At this point, we probably also care a lot more about what a healthy service looks like, as we’ll configure our load balancer to remove unhealthy nodes from our application. Hopefully by the time we get here, we have at least some idea of what healthy looks like.
Multiple Services, Multiple Servers
In Figure 10-3, things get much more interesting. Multiple services are collaborating to provide capabilities to our users, and those services are running on multiple hosts, be they physical or virtual. How do you find the error you’re looking for in thousands of lines of logs on multiple hosts? How do you determine if a server is misbehaving, or if it is a systemic issue? And how do you track back an error found deep down in a call chain between multiple hosts and work out what caused it?
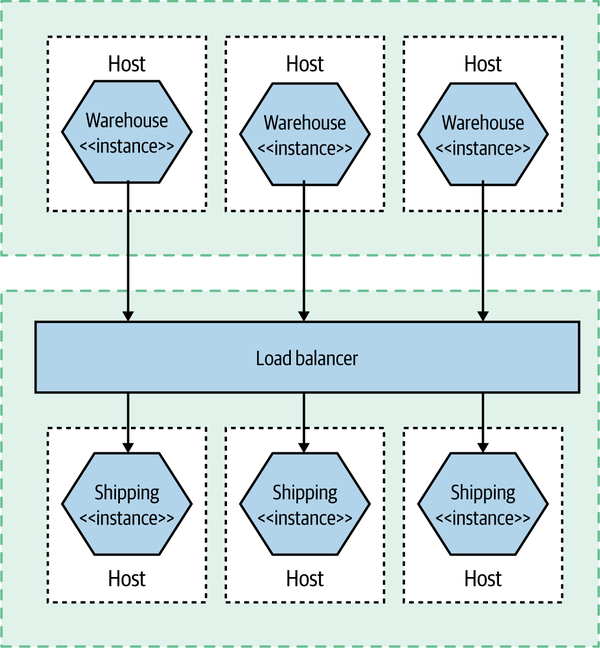
Figure 10-3. Multiple collaborating services distributed across multiple hosts
Aggregation of information—metrics and logs—play a vital part in making this happen. But this is not the only thing we need to consider. We need to work out how to sift this huge influx of data and try to make sense of it all. Above all, this is largely about a mindset shift, from a fairly static landscape of monitoring to the more active world of observability and testing in production.
Observability Versus Monitoring
We’re going to start delving into how we begin solving some of the problems we’ve just outlined, but before we do, I think it’s important that we explore a term that has gained a lot of popularity since I wrote the first edition of this book—observability.
As is often the case, the concept of observability has been around for decades but has only recently come to software development. The observability of a system is the extent to which you can understand the internal state of the system from external outputs. It typically requires a more holistic understanding of your software—seeing it more as a system rather as than a set of disparate entities.
In practice, the more observable a system is, the easier it will be for us to understand what the problem is when something goes wrong. Our understanding of the external outputs helps us track down the underlying issue more quickly. The challenge is that often we will need to create these external outputs, and use different types of tools to understand the outputs.
Monitoring, on the other hand, is something we do. We monitor the system. We look at it. Things will start to go wrong if you focus on just the monitoring—the activity—without thinking about what you expect that activity to achieve.
More traditional approaches to monitoring would have you think in advance about what could go wrong and define alerting mechanisms to tell you when these things happened. But as the system becomes increasingly distributed, you’ll encounter issues that would never have occurred to you. With a highly observable system, you’ll have a collection of external outputs that you can interrogate in different ways—the concrete outcome of having an observable system is that you can ask questions of your production system that you never would have thought to ask before.
We can therefore see monitoring as an activity—something we do—with observability being a property of the system.
The Pillars of Observability? Not So Fast
Some people have attempted to distill down the idea of observability to a few core concepts. Some have focused on “the three pillars” of observability in the form of metrics, logging, and distributed tracing. New Relic even coined the term MELT (metrics, event, logs, and traces), which hasn’t really caught on, but at least New Relic is trying. Although this simple model initially appealed to me greatly (and I’m a sucker for an acronym!), over time I’ve really moved away from this thinking as being overly reductive but also potentially missing the point.
Firstly, reducing a property of a system to implementation details in this way seems backward to me. Observability is a property, and there are many ways I might be able to achieve that property. Focusing too much on specific implementation details runs the risk of focusing on activity versus outcome. It’s analogous to the current world of IT, where hundreds if not thousands of organizations have fallen in love with building microservice-based systems without really understanding what they are trying to achieve!
Secondly, are there always concrete lines between these concepts? I’d argue that many of them overlap. I can put metrics in a logfile if I want. Likewise, I can construct a distributed trace from a series of log lines, something that is commonly done.
Note
Observability is the extent to which you can understand what the system is doing based on external inputs. Logs, events, and metrics might help you make things observable, but be sure to focus on making the system understandable rather than throwing in lots of tools.
Cynically, I could suggest that the pushing of this simplistic narrative is a way to sell you tools. You need one tool for metrics, a different tool for logs, and yet another tool for traces! And you need to send all that information differently! It’s much easier to sell features by way of a box-ticking exercise when trying to market a product, rather than talking about outcomes. As I said, I could suggest this with a cynical view, but it’s 2021, and I’m trying to be a bit more positive in my thinking.3
It’s arguable all these three (or four!) concepts are really just specific examples of a more generic concept. Fundamentally, we can see any piece of information we can get from our system—any of these external outputs—generically as an event. A given event might contain a small or large amount of information. It could contain a CPU rate, information about a failed payment, the fact that a customer has logged in, or any number of things. We can project from this event stream a trace (assuming we can correlate these events), a searchable index, or an aggregation of numbers. Although at present we chose to collect this information in different ways, using different tools and different protocols, our current toolchains shouldn’t limit our thinking in terms of how best to get the information we need.
When it comes to making your system observable, think about the outputs you need from your system in terms of events that you can collect and interrogate. You might need to use different tooling to expose different types of events right now, but that may not be the case in the future.
Building Blocks for Observability
So what do we need? We need to know that the users of our software are happy. If there is a problem, we want to know about it—ideally before our users find an issue themselves. When a problem does occur, we need to work out what we can do to get the system up and running again, and once the dust has settled we want to have enough information in hand to work out what the hell went wrong and what we can do to avoid the problem happening again.
In the rest of this chapter we will be looking at how to make this all happen. We will be covering a number of building blocks that can help improve the observability of your system architecture:
- Log aggregation
-
Collecting information across multiple microservices, a vital building block of any monitoring or observability solution
- Metrics aggregation
-
Capturing raw numbers from our microservices and infrastructure to help detect problems, drive capacity planning, and perhaps even scale our applications
- Distributed tracing
-
Tracking a flow of calls across multiple microservice boundaries to work out what went wrong and derive accurate latency information
- Are you doing OK?
-
Looking at error budgets, SLAs, SLOs, and so on to see how they can be used as part of making sure our microservice is meeting the needs of its consumers
- Alerting
-
What should you alert on? What does a good alert look like?
- Semantic monitoring
-
Thinking differently about the health of our systems, and about what should wake us up at 3 a.m.
- Testing in production
-
A summary of various testing in production techniques
Let’s start with perhaps the simplest thing to get up and running, but something that will pay for itself many times over: log aggregation.
Log Aggregation
With many servers and microservice instances in even a modest microservice architecture, logging into machines or SSH-multiplexing to retrieve logs doesn’t really cut it. Instead, we’re looking to use specialized subsystems to grab our logs and make them available centrally.
Logs will very quickly become one of the most vital mechanisms to help you understand what is happening in your production system. With simpler deployment architectures, our logfiles, what we put into them, and how we treat them are often an afterthought. With an increasingly distributed system, they will become a vital tool, not only helping you diagnose what went wrong when you find out you have a problem but also telling you that there was an issue that needed your attention in the first place.
As we’ll discuss shortly, there are a variety of tools in this space, but they all largely operate in the same way, as outlined in Figure 10-4. Processes (like our microservice instances) log to their local filesystem. A local daemon process periodically collects and forwards this log to some sort of store that can be queried by operators. One of the nice aspects of these systems is that your microservice architecture can be largely unaware of them. You don’t need to change your code to use some sort of special API; you just log to a local filesystem. You do need to understand the failure modes around this log shipping process, though, especially if you want to understand the situations logs can get lost in.
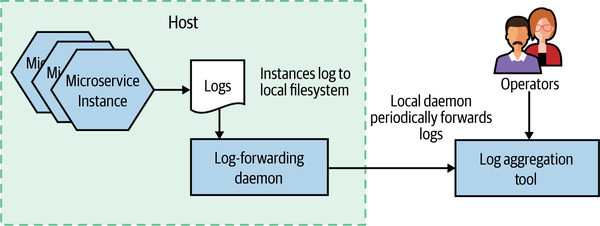
Figure 10-4. An overview of how logs are collected as part of log aggregation
Now, I hope you’ve perceived that I try to avoid being dogmatic about things. Rather than just saying you must do X or Y, I’ve tried to give you context and guidance and explain the nuances of certain decisions—that is, I’ve tried to give you the tools to make the right choice for your context. But on the subject of log aggregation, I’ll come as close I get to giving one-size-fits-all advice: you should view implementing a log aggregation tool as a prerequisite for implementing a microservice architecture.
My reasons for this point of view are twofold. Firstly, log aggregation is incredibly useful. For those of you who treat your logfiles as a dumping ground for misinformation, this will come as a surprise. But trust me—when done right, log aggregation can be incredibly valuable, especially when used with another concept we’ll cover shortly, correlation IDs.
Secondly, implementing a log aggregation, when compared to the other sources of pain and suffering that a microservice architecture can bring, isn’t that difficult. If your organization is unable to successfully implement a simple log aggregation solution, it will likely find the other aspects of a microservice architecture too much to handle. So consider using implementation of such a solution as a way of testing your organization’s readiness for the rest of the horror that will follow.
Before Anything Else
Before you do anything else to build out your microservice architecture, get a log aggregation tool up and running. Consider it a prerequisite for building a microservice architecture. You’ll thank me later.
Now, it’s also true to say that log aggregation has its limitations, and over time you may well want to look at more sophisticated tooling to augment or even replace some of what log aggregation provides. All that being said, it’s still an excellent place to start.
Common format
If you are going to aggregate your logs, you’ll want to be able to run queries across them to extract useful information. For this to work, it’s important that you pick a sensible standard log format—otherwise your queries will end up being difficult or perhaps impossible to write. You want the date, time, microservice name, log level, and so on in consistent places in each log.
Some log forwarding agents give you the ability to reformat logs prior to forwarding them to your central log store. Personally, I’d avoid this wherever possible. The issue is that reformatting logs can be computationally intensive, to the point where I’ve seen real production issues caused by CPU being tied up carrying out this task. It’s much better to change the logs as they are written by your microservice itself. I’d keep the use of log forwarding agents to do log reformatting to places where I am unable to change the source log format—for example, legacy or third-party software.
I would have thought that in the time since I wrote the first edition of this book a common industry standard for logging would have gained traction, but that doesn’t seem to have happened. Lots of variations seem to exist; they normally involve taking the standard access log format supported by web servers like Apache and nginx and expanding on it by adding more columns of data. The key thing is that within your own microservice architecture you pick a format that you standardize on internally.
If you are using a fairly simple log format, you’ll just be emitting simple lines of text that have specific pieces of information at specific places in the log line. In Example 10-1, we see an example format.
Example 10-1. Some example logs
15-02-2020 16:00:58 Order INFO [abc-123] Customer 2112 has placed order 988827
15-02-2020 16:01:01 Payment INFO [abc-123] Payment $20.99 for 988827 by cust 2112
The log aggregation tool will need to know how to parse this string to extract the information we might want to query on—the timestamp, microservice name, or log level, for example. In this example, that is workable, as these pieces of data occur in static places across our logs—the date is the first column, the time is the second column, and so on. This is more problematic, though, if we want to find log lines related to a given customer—the customer ID is in both log lines but is shown in different locations. This is where we might start thinking about writing out more structured log lines, perhaps using a JSON format, so we can find information like a customer or order ID in a consistent location. Again, the log aggregation tool will need to be configured to parse and extract the required information from the log. The other thing to note is that if you log JSON, that might make it more difficult to be directly read by a human without additional tooling to parse out the required values—simply reading the log in a plain text viewer may not be terribly useful.
Correlating log lines
With a large number of services interacting to provide any given end-user capability, a single initiating call can end up generating multiple downstream service calls. For example, let’s consider an example in MusicCorp, as shown in Figure 10-5. We are signing up a customer to our new streaming service. The customer selects their chosen streaming package and clicks submit. Behind the scenes, when the button is clicked in the UI, it hits the Gateway that sits on the perimeter of our system. This in turn passes the call on to the Streaming microservice. This microservice communicates with Payment to take the first payment, uses the Customer microservice to update the fact that this customer now has streaming enabled, and sends an email to the customer using our Email microservice confirming they are now subscribed.
What happens if the call to the Payment microservice ends up generating an odd error? We’ll talk at length about handling failures in Chapter 12, but consider the difficulty of diagnosing what happened.
The problem is that the only microservice registering an error is our Payment microservice. If we are lucky, we can work out what request caused the problem, and we may even be able to look at the parameters of the call. But we can’t see this error in the wider context in which it occurs. In this particular example, even if we assume that each interaction generates only a single log line, we’d have five log lines with information about this flow of calls. Being able to see these log lines grouped together can be incredibly useful.
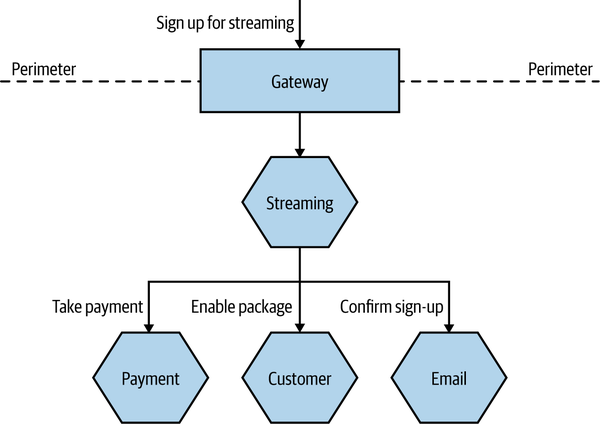
Figure 10-5. A series of calls across multiple microservices related to registering a customer
One approach that can be useful here is to use correlation IDs—something we first mentioned in Chapter 6 when discussing sagas. When the first call is made, you generate a unique ID that will be used to correlate all subsequent calls related to the request. In Figure 10-6, we generate this ID in the Gateway, and it is then passed along as a parameter to all subsequent calls.
Logging of any activity by a microservice caused by this incoming call will be recorded along with the same correlation ID, which we place in a consistent location in each log line, as shown in Example 10-2. This makes it easy to extract all logs associated with a given correlation ID at a later date.
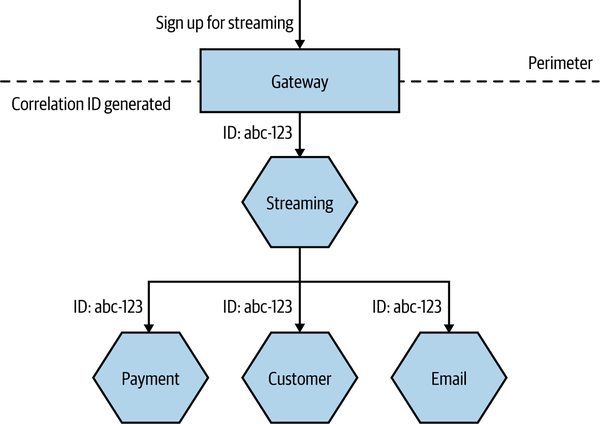
Figure 10-6. Generating a correlation ID for a set of calls
You will, of course, need to ensure that each service knows to pass on the correlation ID. This is where you need to standardize and be stronger in enforcing this across your system. But once you have done this, you can actually create tooling to track all sorts of interactions. Such tooling can be useful in tracking down event storms or odd corner cases, or even in identifying especially costly transactions, as you can picture the whole cascade of calls.
Correlation IDs in logs are the sorts of things that don’t seem that useful initially, but trust me—over time, they can be incredibly useful. Unfortunately, they can be a pain to retrofit into a system. It’s for this reason I strongly suggest that you implement correlation IDs in logging as early as possible. Logs can of course only take you so far in this regard—some sorts of problems are better solved by distributed tracing tools, which we’ll explore shortly. But a simple correlation ID in a logfile can be incredibly useful initially, meaning you can defer the use of a dedicated tracing tool until your system is complex enough to warrant it.
Timing
When looking at a list of log lines, we can be fooled into thinking we are seeing an accurate chronology that will help us understand what happened and in what order. After all, each line of our logs includes a date and time—so why can’t we use this as a way to determine the order in which things occurred? In the sequence of calls in Example 10-2, we see a log line from Gateway, followed by logs from Streaming, Customer, Email, and then the Payment microservice. We might conclude that this is the order in which calls actually happened. Unfortunately, we can’t always count on that to be true.
The log lines are generated on the machines where these microservice instances are running. After being written locally, at some point these logs are forwarded. This means that the date stamps in the log lines are generated on the machines where the microservices are running. Unfortunately, we cannot guarantee that the clocks on these different machines are in sync. This means that the clock on the machine where the Email microservice is running might be a few seconds ahead of the clock on the machine where Payment is running—this could result in it looking like something happened in the Email microservice before it happened in the Payment microservice, but that could just be because of this clock skew.
The problem of clock skew causes all sorts of issues in distributed systems. Protocols do exist to try and reduce clock skew in systems—the Network Time Protocol (NTP) being the most widely used example. NTP, however, isn’t guaranteed to work, and even when it does work, all it can do is reduce skew, not eliminate it. If you have a sequence of calls that happen quite close together, you may find that even a second of skew across machines is enough for your understanding of the sequence of calls to be totally changed.
Fundamentally, this means we have two limitations when it comes to time in logs. We can’t get fully accurate timing information for the overall flow of calls, nor can we understand causality.
In terms of helping to solve this problem so we can understand the true order of things, Leslie Lamport4 has proposed a logical clock system, where a counter is used to keep track of the order of calls. You could implement a similar scheme if you wanted to, and a number of variations to this scheme exist. Personally, though, if I wanted more accurate information regarding the order of calls, and I also wanted more accurate timing, I’d be more inclined to make use of a distributed tracing tool, which will address both issues for me. We’ll look at distributed tracing in more depth later in this chapter.
Implementations
Few spaces in our industry are as contested as that of log aggregation, and a large variety of solutions exist in this space.
A popular open source toolchain for log aggregation has been to make use of a log forwarding agent like Fluentd to send logs to Elasticsearch, using Kibana as a way to slice and dice the resulting stream of logs. The biggest challenge with this stack tends to be the overhead of managing Elasticsearch itself, but this may be less of an issue if you need to run Elasticsearch for other purposes, or if you make use of a managed provider. I will sound two additional notes of caution about the use of this toolchain. Firstly, a lot of effort has gone into marketing Elasticsearch as a database. Personally, this has always sat uneasily with me. Taking something that was always billed as a search index and rebadging it as a database can be highly problematic. We implicitly make assumptions about how databases act and behave, and we treat them accordingly, regarding them as a source of truth for vital data. But by design, a search index isn’t the source of truth; it’s a projection of the source of truth. Elasticsearch has suffered from problems in the past that give me pause for thought.5 While I’m sure many of these issues have been resolved, my own reading of these problems has made me cautious regarding the use of Elasticseach in certain situations, and certainly when considering it as a database. Having a search index that might occasionally lose data isn’t an issue if you can already re-index. But treating it like a database is another thing entirely. If I were using this stack and couldn’t afford to lose log information, I would want to ensure that I can re-index the original logs if anything went wrong.
The second set of concerns is less about the technical aspects of Elasticsearch and Kibana and more about the behaviors of Elastic, the company behind these projects. Recently, Elastic made a decision to change the license for the source code for both the core Elasticsearch database and Kibana from a widely used and accepted open source license (Apache 2.0) to a non–open source Server Side Public License (SSPL).6 The driver for this change in license seems to have been the fact that Elastic is frustrated that organizations like AWS have made successful commercial offerings building on this technology that have undercut Elastic’s own commercial offerings. Aside from the concerns that the SSPL can be “viral” in nature (in a similar way to the GNU General Public License), this decision has left many incensed. Well over a thousand people contributed code to Elasticsearch under the expectation that they were donating to an open source product. There is the added irony that Elasticsearch itself, and therefore much of the Elastic company as a whole, was built on technology from the Lucene open source project. At the time of writing, AWS had predictably committed to creating and maintaining an open source fork of both Elasticsearch and Kibana under the previously used open source Apache 2.0 license.
In many ways, Kibana was a laudable attempt to create an open source alternative to expensive commercial options like Splunk. As good as Splunk seems to be, every Splunk customer I’ve spoken to has also told me that it can be eye-wateringly expensive, in terms of both the licensing fees and the hardware costs. Many of these customers do see its value, though. That said, there are a wealth of commercial options out there. I’m personally a big fan of Humio, many people like to use Datadog for log aggregation, and you have basic but workable out-of-the-box solutions for log aggregation with some public cloud providers, such as CloudWatch for AWS or Application Insights for Azure.
The reality is that you have a huge array of options in this space, from open source to commercial, and from self-hosted to fully hosted. If you want to build a microservice architecture, this isn’t one of the things you should find difficult to get sorted out.
Shortcomings
Logs are a fantastic and easy way to rapidly get information out of your running systems. I remain convinced that for an early-stage microservice architecture, there are few places that will return investment more than logs when it comes to improving visibility of your application in production. They’ll become the lifeblood for information gathering and diagnosis. That said, you do need to be aware of some potentially significant challenges with logs.
Firstly, as we’ve already touched on, due to clock skew they can’t always be relied on to help you understand the order in which calls occurred. This clock skew between machines also means the accurate timing of a sequence of calls will be problematic, potentially limiting the logs’ usefulness in tracking down latency bottlenecks.
The main issue with logs, though, is that as you have more microservices and more calls, you end up generating a LOT of data. Loads. Huge quantities. This can result in higher costs in terms of requiring more hardware, and it can also increase the fee you pay to your service provider (some providers charge by use). And depending on how your log aggregation toolchain is built, this can also result in scaling challenges. Some log aggregation solutions try and create an index when receiving log data to make queries faster. The problem is that maintaining an index is computationally expensive—and the more logs you receive, and the larger the index grows, the more problematic this can become. This results in the need to be more tailored in what you log to reduce this issue, which in turn can generate more work and which runs the risk that you might put off logging information that would otherwise be valuable. I spoke to a team that managed the Elasticsearch cluster for SaaS-based developer tooling; it found that the largest Elasticsearch cluster it could happily run would only be able to handle six weeks of logging for one of its products, causing the team to constantly have to shift data around to keep things manageable. Part of the reason I like Humio is that this was something its developers built for—rather than maintaining an index, they focus on efficient and scalable ingestion of data with some smart solutions to try and keep query times down.
Even if you do have a solution that can store the volume of logs you want, these logs can end up containing a lot of valuable and sensitive information. This means that you might have to limit access to the logs (which could further complicate your efforts to have collective ownership of your microservices in production), and the logs could be a target for malicious parties. You might therefore need to consider not logging certain types of information (as we’ll touch on in “Be frugal”, if you don’t store data, it can’t be stolen) to reduce the impact of access by unauthorized parties.
Metrics Aggregation
As with the challenge of looking at logs for different hosts, we need to look at better ways to gather and view data about our systems. It can be hard to know what “good” looks like when we’re looking at metrics for a more complex system. Our website is seeing nearly 50 4XX HTTP error codes per second. Is that bad? The CPU load on the catalog service has increased by 20% since lunch; has something gone wrong? The secret to knowing when to panic and when to relax is to gather metrics about how your system behaves over a long-enough period of time that clear patterns emerge.
In a more complex environment, we’ll be provisioning new instances of our microservices pretty frequently, so we want the system we pick to make it very easy to collect metrics from new hosts. We’ll want to be able to look at a metric aggregated for the whole system—for example, the average CPU load—but we’ll also want to aggregate that metric for all the instances of a given service, or even for a single instance of that service. That means we’ll need to be able to associate metadata with the metric to allow us to infer this structure.
Another key benefit of understanding your trends is when it comes to capacity planning. Are we reaching our limit? How long until we need more hosts? In the past when we bought physical hosts, this was often an annual job. In the new age of on-demand computing provided by infrastructure as a service (IaaS) vendors, we can scale up or down in minutes, if not seconds. This means that if we understand our usage patterns, we can make sure we have just enough infrastructure to serve our needs. The smarter we are in tracking our trends and knowing what to do with them, the more cost effective and responsive our systems can be.
Due to the nature of this sort of data, we may want to store and report these metrics at different resolutions. For example, I might want a CPU sample for my servers at the resolution of one sample every 10 seconds for the last 30 minutes, in order to better react to a situation that is currently unfolding. On the other hand, the CPU samples from my servers from last month are likely needed only for general trend analysis, so I might be happy with calculating an average CPU sample on a per-hour basis. This is often done on standard metrics platforms to help keep query times down and also reduce data storage. For something as simple as a CPU rate this might be fine, but the process of aggregating old data does cause us to lose information. The issue with the need for this data to be aggregated is that you often have to decide what to aggregate beforehand—you have to guess in advance as to what information it’s OK to lose.
Standard metrics tools can be absolutely fine for understanding trends or simple failure modes. They can be vital, in fact. But they often don’t help us make our systems more observable, as they restrict the sorts of questions we want to ask. Things start getting interesting when we go from simple pieces of information like response time, CPU, or disk space use to thinking more broadly about the types of information we want to capture.
Low versus high cardinality
Many tools, especially the more recent ones, have been built to accommodate the storage and retrieval of high-cardinality data. There are a number of ways to describe cardinality, but you can think of it as the number of fields that can be easily queried in a given data point. The more potential fields we might want to query of our data, the higher the cardinality we need to support. Fundamentally, this gets more problematic with time-series databases for reasons that I won’t expand on here but which are related to the way many of these systems are built.
For example, I might want to capture and query on the name of the microservice, customer ID, request ID, build number of software, and product ID, all over time. Then I decide to capture information about the machine at that stage—the OS, system architecture, cloud provider, and so on. I could need to capture all of that information for each data point I collect. As I increase the number of things I might want to query on, the cardinality increases, and the more problems systems will have that aren’t built with this use case in mind. As Charity Majors,7 founder of Honeycomb, explains:
It boils down, essentially, to the metric. The metric is a dot of data, a single number with a name and some identifying tags. All of the context you can get has to be stuffed into those tags. But the write explosion of writing all those tags is expensive because of how metrics are stored on disk. Storing a metric is dirt cheap, but storing a tag is expensive; and storing lots of tags per metric will bring your storage engine to a halt fast.
Practically speaking, systems built with low cardinality in mind will struggle greatly if you try to put higher-cardinality data into them. Systems like Prometheus, for example, were built to store fairly simple pieces of information, such as the CPU rate for a given machine. In many ways, we can see Prometheus and similar tools as being a great implementation of traditional metrics storage and querying. But the lack of ability to support higher-cardinality data can be a limiting factor. The Prometheus devs are quite open about this limitation:
Remember that every unique combination of key-value label pairs represents a new time series, which can dramatically increase the amount of data stored. Do not use labels to store dimensions with high cardinality (many different label values), such as user IDs, email addresses, or other unbounded sets of values.
Systems that are capable of handling high cardinality are more able to allow you to ask a host of different questions of your systems—often questions you didn’t know you needed to ask beforehand. Now, this might be a hard concept to grasp, especially if you’ve been managing your single-process monolithic system quite happily with more “conventional” tools. Even those people with larger systems have made do with lower-cardinality systems, often because they had no choice. But as your system increases in complexity, you’ll need to improve the quality of the outputs your system provides to allow you to improve its observability. This means collecting more information and having tooling that allows you to slice and dice this data.
Implementations
Since the first edition of this book, Prometheus has become a popular open source tool for the use of gathering and aggregating metrics, and in cases in which I might have previously recommended the use of Graphite (which got my recommendation in the first edition), Prometheus can be a sensible replacement. The commercial space has also greatly expanded in this area, with new vendors and old vendors alike building or retooling existing solutions to target microservice users.
Bear in mind, though, my concerns regarding low- versus high-cardinality data. Systems built to handle low-cardinality data will be very difficult to retrofit to support high-cardinality storage and processing. If you are looking for systems that are able to store and manage high cardinality data, allowing for much more sophisticated observation (and questioning) of your system’s behavior, I’d strongly suggest looking at either Honeycomb or Lightstep. Although these tools are often seen as solutions to distributed tracing (which we’ll explore more later), they are highly capable at storing, filtering, and querying high-cardinality data.
Distributed Tracing
So far, I’ve primarily been talking about collecting information in isolation. Yes, we’re aggregating that information, but understanding the wider context in which this information has been captured can be key. Fundamentally, a microservice architecture is a set of processes that work together to carry out some kind of task—we explored the various different ways we can coordinate these activities in Chapter 6. Thus it makes sense, when wanting to understand how our system is actually behaving in a production environment, that we are able to see the relationships between our microservices. This can help us better understand how our system is behaving, assess the impact of an issue, or get better at figuring out what exactly is not working as we’d expect.
As our systems become more complex, it therefore becomes important to have a way of seeing these traces through our systems. We need to be able to pull this disparate data to give us a joined-up view of a set of correlated calls. As we’ve already seen, doing something simple like putting correlation IDs into our logfiles is a good start, but it’s a fairly unsophisticated solution, especially as we’ll end up having to create our own custom tooling to help visualize, slice, and dice this data. This is where distributed tracing comes in.
How it works
Although the exact implementations vary, broadly speaking, distributed tracing tools all work in a similar way. Local activity within a thread is captured in a span. These individual spans are correlated using some unique identifier. The spans are then sent to a central collector, which is able to construct these related spans into a single trace. In Figure 10-7, we see a picture from Honeycomb that shows a trace across a microservice architecture.
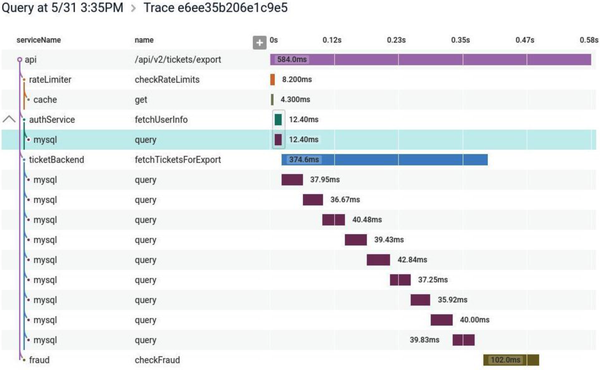
Figure 10-7. A distributed trace shown in Honeycomb, allowing you to identify where time is being spent for operations that can span multiple microservices
These spans allow you to collect a host of information. Exactly what data you collect will depend on the protocol you are using, but in the case of the OpenTracing API, each span contains a start and end time, a set of logs associated with the span, and an arbitrary set of key-value pairs to help with later querying (these could be used to send things like a customer ID, an order ID, a hostname, a build number, and the like).
Collecting enough information to allow us to trace calls in our system can have a direct impact on the system itself. This results in the need for some form of sampling, in which some information is explicitly excluded from our trace collection to ensure the system can still operate. The challenge is ensuring that the right information is dropped, and that we still collect sufficient samples to allow us to correctly extrapolate observations.
Sampling strategies can be very basic. Google’s Dapper system, which inspired many of the distributed tracing tools that came afterwards, performed a highly aggressive random sampling. A certain percentage of calls were sampled, and that was it. Jaeger, for example, will capture only 1 in 1,000 calls in its default setting. The idea here is to capture enough information to understand what our system is doing but not capture so much information that the system itself cannot cope. Tools like Honeycomb and Lightstep can provide more nuanced, dynamic sampling than this simple random-based sampling. An example of dynamic sampling could be where you want more samples for certain types of events—for example, you might want to sample anything that generates an error but would be happy sampling only 1 in 100 successful operations if they are all pretty similar.
Implementing distributing tracing
Getting distributed tracing up and running for your system requires a few things. Firstly, you need to capture span information inside your microservices. If you are using a standard API like OpenTracing or the newer OpenTelemetry API, you might find that some of the third-party libraries and frameworks will come with support for these APIs built in and will already send useful information (for example, automatically capturing information about HTTP calls). But even if they do, chances are you’ll still want to instrument your own code, providing useful information about what your microservice is doing at any given point of time.
Next, you’ll need some way to send this span information to your collector—it may be that you send this data directly from your microservice instance to the central collector, but it’s much more common to use a local forwarding agent. So as with log aggregation, you run an agent locally to your microservice instance, which will periodically send the span information to a central collector. The use of a local agent typically allows for some more advanced capabilities, such as changing sampling or adding additional tags, and can also more effectively buffer information being sent.
Lastly, of course, you need a collector able to receive this information and make sense of it all.
In the open source space, Jaeger has emerged as a popular choice for distributed tracing. For commercial tooling, I’d start by looking at the already mentioned Lightstep and Honeycomb. I’d urge you, though, to pick something that is committed to supporting the OpenTelemetry API. OpenTelemetry is an open API specification that makes it much easier to have code such as database drivers or web frameworks come out of the box with support for tracing, and it can also give you easier portability across different vendors on the collection side. Based on work done by the earlier OpenTracing and OpenConsensus APIs, this API now has broad industry support.
Are We Doing OK?
We’ve talked a lot about the things you could be doing as the operator of a system—the mindset you need, the information you might need to gather. But how do you know if you’re doing too much—or not enough? How do you know if you are doing a good enough job, or that your system is working well enough?
Binary concepts of a system being “up” or “down” start to have less and less meaning as the system becomes more complex. With a single-process monolithic system, it’s easier to see system health as a black-and-white quality. But what about a distributed system? If one instance of a microservice is unreachable, is that a problem? Is a microservice “healthy” if it is reachable? What about a situation in which our Returns microservice is available, but half the functionality it provides requires the use of the downstream Inventory microservice, which is currently experiencing issues? Does that mean we consider the Returns microservice healthy or not healthy?
As things become more complex, it becomes increasingly important to take a step back and think about things from a different vantage point. Think of a beehive. You could look at an individual bee and determine that it’s not happy. Perhaps it’s lost one of its wings and thus can no longer fly. This is certainly a problem for that individual bee, but can you extend from that any observation about the health of the hive itself? No—you’d need to look at the health of the hive in a more holistic fashion. One bee being sick doesn’t mean the whole hive is sick.
We can try to work out if a service is healthy by deciding, for example, what a good CPU level is, or what makes for an acceptable response time. If our monitoring system detects that the actual values fall outside this safe level, we can trigger an alert. However, in many ways, these values are one step removed from what we actually want to track—namely, is the system working? The more complex the interactions between the services, the further removed we are from actually answering that question by just looking at one metric in isolation.
So we can gather a lot of information, but by itself that doesn’t help us answer the question of whether the system is working properly. For that, we need to start thinking a bit more in terms of defining what acceptable behavior looks like. Much work has been done in the space of site reliability engineering (SRE), the focus of which is how we can ensure that our systems can be reliable while still allowing for change. From this space, we have a few useful concepts to explore.
Strap in—we’re about to enter acronym city.
Service-level agreement
A service-level agreement (SLA) is an agreement reached between the people building the system and the people using the system. It describes not only what the users can expect but also what happens if the system doesn’t reach this level of acceptable behavior. SLAs tend to be very much at the “bare minimum” level of things, often to the point that if the system only just achieved its targets, the end user would still be unhappy. As an example, AWS has an SLA for its compute service. It makes it clear there is no effective guarantee for uptime for a single EC2 instance (a managed virtual machine8). AWS states that it makes its best efforts to ensure 90% uptime for a given instance, but if that isn’t achieved, then it just doesn’t charge you for the given hour in which the instance was unavailable. Now, if your EC2 instances were constantly failing to reach 90% availability in a given hour, causing significant system instability, you might not be getting charged, but you also wouldn’t be very happy. In my experience, AWS in practice achieves far in excess of what the SLA outlines, as is often the case with SLAs.
Service-level objectives
Mapping an SLA down to a team is problematic, especially if the SLA is somewhat broad and cross-cutting. At a team level, we instead talk about service-level objectives (SLOs). SLOs define what the team signs up to provide. Achieving the SLOs of every team across the organization will satisfy (and likely greatly exceed) the requirements of the organization’s SLAs. Example SLOs could include things like expected uptime or acceptable response times for a given operation.
It is too simplistic to think of SLOs as being what a team needs to do for the organization to achieve its SLAs. Yes, if the entire organization achieves all of its SLOs, we would assume that all the SLAs have also been achieved, but SLOs can speak to other goals not outlined in the SLA—or they might be aspirational, they could be inward facing (trying to carry out some internal change). SLOs can often reflect something that the team itself wants to achieve that may have no relation to an SLA.
Service-level indicators
To determine if we are meeting our SLOs, we need to gather real data. This is what our service-level indicators (SLI) are. An SLI is a measure of something our software does. It could, for example, be a response time from a process, a customer being registered, an error being raised to the customer, or an order being placed. We need to collect and surface these SLIs to make sure we are meeting our SLOs.
Error budgets
When we try new things, we inject more potential instability into our systems. As such, a desire to maintain (or improve) system stability could result in change being discouraged. Error budgets are an attempt to avoid this problem by being clear about how much error is acceptable in a system.
If you have already decided on an SLO, then working out your error budget should be pretty clear. For example, you might say that your microservice needs to be available 99.9% of the time per quarter, on a 24/7 basis. That means you are actually allowed to be down for 2 hours and 11 minutes per quarter. In terms of that SLO, this is your error budget.
Error budgets help give you a clear understanding of how well you are achieving (or not) an SLO, allowing you to make better decisions about what risks to take. If you are well under your error budget for the quarter, perhaps you are OK with rolling out that microservice written in a new programming language. If you’ve already exceeded your error budget, maybe you put off that rollout, and instead focus more of the team’s time on improving the reliability of your system.
Error budgets are as much about giving teams breathing room to try new things as anything.
Alerting
On occasion (hopefully rarely, but likely more than we’d like), something will happen in our systems that will require a human operator to be notified to take action. A microservice may have unexpectedly become unavailable, we might be seeing a larger number of errors than we’d expect, or perhaps the entire system has become unavailable for our users. In these situations, we need people to be made aware of what’s happening so they can try and fix things.
The problem is that with a microservice architecture, given the larger number of calls, the larger number of processes, and the more complex underlying infrastructure, there will often be things going wrong. The challenge in a microservice environment is working out exactly what types of problems should cause a human to be informed and exactly how they should be told.
Some problems are worse than others
When something goes wrong, we want to know about it. Or do we? Are all problems the same? As the sources of problems increase, it can become more important to be able to prioritize these issues to decide if, and how, a human operator should be involved. Often the biggest question I find myself asking when it comes to alerting is, “Should this problem cause someone to be woken up at 3 a.m.?”
I saw one example of this thinking while spending some time on the Google campus many years ago. In the reception area of one of the buildings in Mountain View was an old rack of machines, there as a sort of exhibit. I noticed a couple of things. First, these servers weren’t in server enclosures; they were just bare motherboards slotted into the rack. The main thing I noticed, though, was that the hard drives were attached by Velcro. I asked one of the Googlers why that was. “Oh,” he said, “the hard drives fail so much we don’t want them screwed in. We just rip them out, throw them in the bin, and velcro in a new one.”
The systems Google built assumed that hard drives would fail. It optimized the design of these servers to ensure that hard drive replacement was as easy as possible. As the system had been built to tolerate the failure of a hard drive, while it was important that the drive was replaced eventually, chances are a single hard drive failure wasn’t going to cause any significant issues that would be visible to the user. With thousands of servers in a Google data center, it would be someone’s daily task to just walk along a row of racks and replace hard drives as they went. Sure, the drive failure was an issue, but one that could be dealt with in a routine fashion. A hard drive failure was considered routine—not worth calling someone about outside of regular work hours, but perhaps just something they needed to be told about during their normal working day.
As your sources of potential issues increase, you’ll need to get better at prioritizing what things cause what types of alerts. Otherwise, you may well find yourself struggling to separate the trivial from the urgent.
Alert fatigue
Often, too many alerts can cause significant issues. In 1979, there was a partial meltdown of a reactor at the Three Mile Island nuclear power station in the US. The investigation into the incident highlighted the fact that the operators of the facility were so overwhelmed by the alerts they were seeing that it was impossible to determine what action needed to be taken. There was an alert indicating the fundamental problem that needed to be addressed, but this wasn’t something that was obvious to the operators, as so many other alerts were going off at the same time. During the public hearing into the incident, one of the operators, Craig Faust, recalled that “I would have liked to have thrown away the alarm panel. It wasn’t giving us any useful information.” The report into the incident concluded that the control room “was greatly inadequate for managing an accident.”9
More recently, we have seen this issue of too many alerts being raised in the context of a series of incidents with the 737 Max aircraft that included two separate air crashes that killed 346 people in total. The initial report10 into the issues by the US National Transportation Safety Board (NTSB) drew attention to the confusing alerts that were triggered in real-world conditions and were considered to be contributing factors in the crashes. From the report:
Human factors research has identified that, for non-normal conditions, such as those involving a system failure with multiple alerts, where there may be multiple flight crew actions required, providing pilots with understanding as to which actions must take priority is a critical need. This is particularly true in the case of functions implemented across multiple airplane systems because a failure in one system within highly integrated system architectures can present multiple alerts and indications to the flight crew as each interfacing system registers the failure...Thus, it is important that system interactions and the flight deck interface be designed to help direct pilots to the highest priority action(s).
So here we’re talking about operating a nuclear reactor and flying an aircraft. I suspect that many of you right now are wondering what this has to do with the system you are building. Now it’s possible (if not likely) that you aren’t building safety-critical systems like this, but there is a lot we can learn from these examples. Both involve highly complex, interrelated systems in which a problem in one area can cause a problem in another. And when we generate too many alerts, or we don’t give operators the ability to prioritize what alerts should be focused on, disaster can follow. Overwhelming an operator with alerts can cause real issues. From the report again:
In addition, research into pilot responses to multiple/simultaneous anomalous situations, along with data from accidents, indicates that multiple competing alerts may exceed available mental resources and narrow attentional focus leading to delayed or inadequately prioritized responses.
So think twice about simply throwing up more alerts to an operator—you might not get what you want.
Toward better alerting
So we want to avoid having too many alerts, as well as having alerts that aren’t useful. What guidelines can we look at to help us create better alerts?
Steven Shorrock expands on this subject in his article “Alarm Design: From Nuclear Power to WebOps,”11 which is a great read and a good jumping-off point for more reading in this area. From the article:
The purpose of [alerts] is to direct the user’s attention towards significant aspects of the operation or equipment that require timely attention.
Drawing on work from outside software development, we have a useful set of rules from, of all places, the Engineering Equipment and Materials Users Association (EEMUA), which has come up with as good a description of what makes for a good alert as I’ve seen:
- Relevant
-
Make sure the alert is of value.
- Unique
-
Ensure that the alert isn’t duplicating another.
- Timely
-
We need to get the alert quickly enough to make use of it.
- Prioritized
-
Give the operator enough information to decide in what order the alerts should be dealt with.
- Understandable
-
The information in the alert needs to be clear and readable.
- Diagnostic
-
It needs to be clear what is wrong.
- Advisory
-
Help the operator understand what actions need to be taken.
- Focusing
-
Draw attention to the most important issues.
Looking back over my career to times when I’ve worked in production support, it’s depressing to think how rarely the alerts I’ve had to deal with follow any of these rules.
All too often, unfortunately, the people providing information to our alerting systems and the people actually on the receiving ends of our alerts are different people. From Shorrock again:
Understanding the nature of alarm handling, and the associated design issues, can help you—the expert in your work—to be a more informed user, helping to bring about the best alarm systems to support your work.
One technique that can help reduce the number of alerts vying for our attention involves shifting how we think about which issues require us to bring them to operators’ attention in the first place. Let’s explore this topic next.
Semantic Monitoring
With semantic monitoring, we are defining a model for what the acceptable semantics of our system are. What are the properties the system has to have for us to think it is operating within acceptable means? To a great extent, semantic monitoring requires a shift in our behavior. Rather than looking for the presence of errors, we instead need to be constantly asking one question: is the system behaving the way that we expect? If it is behaving correctly, then this better helps us understand how to prioritize dealing with the errors we are seeing.
The next thing to work out is how do you define a model for a correctly behaving system. You can get super formal with this approach (quite literally, with some organizations making use of formal methods for this), but making some simple value statements can get you a long way. For example, in the case of MusicCorp, what has to be true for us to be satisfied that the system is working correctly? Well, perhaps we say that:
-
New customers can register to join.
-
We are selling at least $20,000 worth of products per hour during our peak time.
-
We are shipping orders out at a rate that is normal.
If these three statements can prove to be correct, then broadly speaking we feel that the system is operating well enough. Coming back to our earlier discussions of SLAs and SLOs, our model for semantic correctness would be expected to greatly exceed our obligations in an SLA, and we would expect to have concrete SLOs that allow us to track against this model. Put another way, making these statements about how we expect our software to be acting will go a long way toward our identifying SLOs.
One of the biggest challenges is in getting agreement as to what this model is. As you can see, we aren’t talking about low level things like “disk usage shouldn’t exceed 95%”; we’re making higher-level statements about our system. As the operator of the system, or the person who wrote and tested the microservice, you may not be in a position to decide what these value statements should be. In a product-driven delivery organization, this is where the product owner should come in—but it might be your job as the operator to make sure the discussion with the product owner actually happens.
Once you’ve decided on what your model is, then it comes down to working out if the current system behavior meets this model. Broadly speaking, we have two key ways to do this—real user monitoring and synthetic transactions. We’ll look at synthetic transactions in a moment, as they fall under the umbrella of testing in production, but let’s look at real user monitoring first.
Real user monitoring
With real user monitoring, we look at what is actually happening in our production system and compare that with our semantic model. In MusicCorp, we’d look at how many customers signed up, how many orders we sent, and so on
The challenge with real user monitoring is that often the information we need isn’t available to us in a timely manner. Consider the expectation that MusicCorp should be selling at least $20,000 in products per hour. If this information is locked away in a database somewhere, we may not be able to collect this information and act on it accordingly. This is why you may need to get better at exposing access to information that you would previously consider to be “business” metrics to your production tooling. If you can emit a CPU rate to your metrics store, and this metric store could be used to alert on this condition, then why can’t you also record a sale and a dollar value into this same store?
One of the main drawbacks of real user monitoring is that it is fundamentally noisy. You are getting a lot of information—sifting through it to find out if there is a problem can be difficult. It’s also worth realizing that real user monitoring tells you what already happened, and as a result you may not catch an issue til after it occurred. If a customer failed to get registered, that is an unhappy customer. With synthetic transactions, another form of testing in production that we’ll look at in a moment, we have the opportunity to not just cut down on the noise but also catch issues before our users are aware of them.
Testing in Production
Not testing in prod is like not practicing with the full orchestra because your solo sounded fine at home.12
Charity Majors
As we’ve covered multiple times throughout the book, from our discussion of concepts like canary deployments in “Canary Release” to our look at the balancing act with regard to pre- and post-production testing, carrying out some form of testing in production can be an incredibly useful—and safe—activity. We’ve looked at a number of different types of in-production testing in this book, and there are more forms besides, so I felt that it would be useful to summarize some of the different types of testing in production we’ve already looked at and also share some other examples of testing in production that are commonly used. It surprises me how many people who are scared by the concept of testing in production are already doing it without really realizing they are.
All forms of testing in production are arguably a form of “monitoring” activity. We are carrying out these forms of testing in production to ensure that our production system is running as we expect, and many forms of testing in production can be incredibly effective in picking up problems before our users even notice.
Synthetic transactions
With synthetic transactions, we inject fake user behavior into our production system. This fake user behavior has known inputs and expected outputs. For MusicCorp, for example, we could artificially create a new customer and then check that the customer was successfully created. These transactions would be fired on a regular basis, giving us the chance to pick up problems as quickly as possible.
I first did this back in 2005. I was part of a small Thoughtworks team that was building a system for an investment bank. Throughout the trading day, lots of events came in that represented changes in the market. Our job was to react to these changes and look at the impact on the bank’s portfolio. We were working under some fairly tight deadlines, a sour goal was to complete all our calculations less than 10 seconds after the event arrived. The system itself consisted of around five discrete services, at least one of which was running on a computing grid that, among other things, was scavenging unused CPU cycles on around 250 desktop hosts in the bank’s disaster recovery center.
The number of moving parts in the system meant a lot of noise was being generated from many of the lower-level metrics we were gathering. We also didn’t have the benefit of scaling gradually or having the system run for a few months to understand what “good” looked like in terms of low-level metrics like CPU rate or response time. Our approach was to generate fake events to price part of the portfolio that was not booked into the downstream systems. Every minute or so, we used a tool called Nagios to run a command-line job that inserted a fake event into one of our queues. Our system picked it up and ran all the various calculations just like any other job, except the results appeared in the “junk” book, which was used only for testing. If a repricing wasn’t seen within a given time, Nagios reported this as an issue.
In practice, I’ve found the use of synthetic transactions to perform semantic monitoring like this to be a far better indicator of issues in systems than alerting on the lower-level metrics. They don’t replace the need for the lower-level detail, though—we’ll still want that information when we need to find out why a synthetic transaction failed.
Implementing synthetic transactions
In the past, implementing synthetic transactions was a fairly daunting task. But the world has moved on, and the means to implement them is at our fingertips! You are running tests for your systems, right? If not, go read Chapter 9 and come back. All done? Good!
If we look at the tests we have that test a given service end to end, or even our whole system end to end, we have much of what we need to implement semantic monitoring. Our system already exposes the hooks needed to launch the test and check the result. So why not just run a subset of these tests, on an ongoing basis, as a way of monitoring our system?
There are some things we need to do, of course. First, we need to be careful about the data requirements of our tests. We may need to find a way for our tests to adapt to different live data if it changes over time, or else set a different source of data. For example, we could have a set of fake users we use in production with a known set of data.
Likewise, we have to make sure we don’t accidentally trigger unforeseen side effects. A friend told me a story about an ecommerce company that accidentally ran its tests against its production ordering systems. It didn’t realize its mistake until a large number of washing machines arrived at the head office.
A/B testing
With an A/B test, you deploy two different versions of the same functionality, with users seeing either the “A” or the “B” functionality. You are then able to see which version of the functionality performs best. This is commonly used when trying to decide between two different approaches for how something should be done—for example, you might try two different customer registration forms to see which one is more effective in driving sign-ups.
Canary release
A small portion of your user base gets to see the new release of functionality. If this new functionality works well, you can increase the portion of your user base that sees the new functionality to the point that the new version of the functionality is now used by all users. On the other hand, if the new functionality doesn’t work as intended, you’ve impacted only a small portion of your user base and can either revert the change or try to fix whatever problem you have identified.
Parallel run
With a parallel run, you execute two different equivalent implementations of the same functionality side by side. Any user request is routed to both versions, and their results can be compared. So instead of directing a user to either the old or the new version, as in a canary release we execute both versions—but the user sees only one. This allows for a full comparison between the two different versions, which is incredibly useful when we want a better understanding of aspects like the load characteristics of a new implementation of some key functionality.
Smoke tests
Used after the software is deployed into production but before it is released, smoke tests are run against the software to make sure it is working appropriately. These tests are normally fully automated and can range from very simple activities like making sure a given microservice is up and running to actually executing full-blown synthetic transactions.
Synthetic transactions
A full-blown, fake user interaction is injected into the system. It’s often very close to the sort of end-to-end test you might write.
Chaos engineering
A topic we’ll discuss more in Chapter 12, chaos engineering can involve injection of faults into a production system to ensure that it is able to handle these expected issues. The best-known example of this technique is probably Netflix’s Chaos Monkey, which is able to turn off virtual machines in production, with the expectation that the system is robust enough that these shutdowns don’t interrupt the end-user functionality.
Standardization
As we’ve covered previously, one of the ongoing balancing acts you’ll need to pull off is where to allow for decisions to be made narrowly for a single microservice versus where you need to standardize across your system. In my opinion, monitoring and observability is one area in which standardization can be incredibly important. With microservices collaborating in lots of different ways to provide capabilities to users using multiple interfaces, you need to view the system in a holistic way.
You should try to write your logs out in a standard format. You definitely want to have all your metrics in one place, and you may want to have a list of standard names for your metrics too; it would be very annoying for one service to have a metric called ResponseTime, and another to have one called RspTimeSecs, when they mean the same thing.
As always with standardization, tools can help. As I’ve said before, the key is to make it easy to do the right thing—so having a platform with many of the basic building blocks in place, like log aggregation, makes a lot of sense. Increasingly, much of this falls to the platform team, the role of which we explore more fully in Chapter 15.
Selecting Tools
As we’ve already covered, there are potentially a host of different tools you may need to bring to bear to help improve the observability of your system. But as I’ve already touched on, this is a fast-emerging space, and it’s highly likely that the tooling we’ll be using in the future will look very different from what we have now. With platforms like Honeycomb and Lightstep leading the way in terms of what observability tooling for microservices looks like, and with the rest of the market to an extent playing catch-up, I fully expect this space to see a lot of churn in the future.
So it’s quite possible you’ll need different tools from what you have right now if you’re only just embracing microservices, and it’s possible you’ll want different tooling in the future too, as the solutions in this space continue to improve. With that in mind, I want to share a few thoughts about criteria that I think are important for any tooling in this area to have.
Democratic
If you have tools that are so hard to work with only experienced operators can make use of them, then you limit the number of people who can participate in production activities. Likewise, if you pick tools that are so expensive as to prohibit their use in any situation other than critical production environments, then developers will not have exposure to these tools until it’s too late.
Pick tools that consider the needs of all the people whom you will want using them. If you really want to move to a model of more collective ownership of your software, then the software needs to be usable by everyone in the team. Making sure that whatever tooling you pick will also be used in development and test environments will go a long way toward making this goal a reality.
Easy to Integrate
Getting the right information out of your application architecture and the systems you run on is vital, and as we’ve already covered, you may need to be extracting more information than before, and in different formats. Making this process as easy as possible is crucial. Initiatives such as OpenTracing have helped in terms of providing standard APIs that client libraries and platforms can support, making integration and portability across toolchains easier. Of special interest, as I’ve discussed, is the new OpenTelemetry initiative, which is being driven by a large number of parties.
Picking tools that support these open standards will ease integration efforts and also perhaps help make it easier to change vendors later on.
Provide Context
When looking at a piece of information, I need the tool to provide me with as much context as possible to help me understand what needs to happen next. I really like the following categorization system for different types of context that I found via a Lightstep blog post:13
- Temporal context
-
How does this look compared to a minute, hour, day, or month ago?
- Relative context
-
How has this changed in relation to other things in the system?
- Relational context
-
Is something depending on this? Is this depending on something else?
- Proportional context
-
How bad is this? Is it large or small scoped? Who is impacted?
Real-Time
You can’t wait ages for this information. You need it now. Your definition of “now” can of course vary somewhat, but in the context of your systems, you need information quickly enough that you have a chance of spotting a problem before a user does, or at the very least of having the information at hand when someone does complain. In practice, we’re talking about seconds, not minutes or hours.
Suitable for Your Scale
Much of the work in the space of distributed systems observability has been inspired by work done in large-scale distributed systems. This unfortunately can lead to us trying to re-create solutions for systems of much larger scale than our own without understanding the trade-offs.
Systems with massive scale will often have to make specific trade-offs to reduce the functionality of their systems in order to handle the scale they operate at. Dapper, for example, had to make use of a highly aggressive random sampling of data (effectively “dropping” a lot of information) to be able to cope with Google scale. As Ben Sigelman, founder of LightStep and creator of Dapper, puts it:14
Google’s microservices generate about 5 billion RPCs per second; building observability tools that scale to 5B RPCs/sec therefore boils down to building observability tools that are profoundly feature poor. If your organization is doing more like 5 million RPCs/sec, that’s still quite impressive, but you should almost certainly not use what Google uses: at 1/1000th the scale, you can afford much more powerful features.
You also ideally want a tool that can scale as you scale. Again, cost effectiveness can come into play here. Even if your tool of choice can technically scale to support the expected growth of your system, can you afford to keep paying for it?
The Expert in the Machine
I’ve talked a lot about tools in this chapter, perhaps more than in any other chapter in the book. This is partly due to the fundamental shift from viewing the world purely in terms of monitoring to instead thinking about how to make our systems more observable; this change in behavior requires tooling to help support it. It would be a mistake, however, to see this shift as being purely about new tools, as I hope I’ve already explained. Nonetheless, with a large number of different vendors vying for our attention, we also have to be cautious.
For over a decade now, I have seen multiple vendors claim some degree of smarts in terms of how their system will be the one that will magically detect problems and tell us exactly what we need to do to fix things. This seems to come in waves, but with the recent buzz around machine learning (ML) and artificial intelligence (AI) only increasing, I’m seeing more claims around automated anomaly detection being made. I am dubious as to how effective this can be in a fully automated fashion, and even then it would be problematic to assume that all the expertise you need could be automated away.
Much of the drive around AI has always been to try and codify expert knowledge into an automated system. The idea that we can automate away expertise might be attractive to some, but it’s also a potentially dangerous idea in this space, at least with our current understanding. Why automate away expertise? So then you don’t have to invest in having expert operators run your system. I’m not trying to make some point here about the upheaval of labor caused by technological advancement—more that people are selling this idea now, and companies are buying this idea now, in the hope that these are fully solvable (and automatable) problems. The reality is that right now, they aren’t.
I worked recently with a data science–focused startup in Europe. The startup was working with a company that provided bed-monitoring hardware, which could gather various pieces of data about a patient. The data scientists were able to help see patterns in the data, showing odd clusters of patients that could be determined by correlating various facets of the data. The data scientists could say “these patients seem related” but had no awareness as to what the meaning of that relationship was. It took a clinician to explain that some of these clusters referred to patients who were, in general, more sick than others. It required expertise to identify the cluster, and a different expertise to understand what this cluster meant and put that knowledge into action. Coming back to our tooling for monitoring and observability tooling, I could see such a tool alerting someone to the fact that “something looks odd,” but knowing what to do with that information still requires a degree of expertise.
While I’m sure that features such as “automated anomaly detection” may well continue to improve, we have to recognize that right now, the expert in the system is, and will remain for some time, a human. We can create tools that can better inform the operator of what needs to be done, and we can provide automation to help the operator carry out their decisions in a more effective manner. But the fundamentally varied and complicated environment of a distributed system means that we need skilled and supported human operators. We want our experts to use their expertise in asking the right questions and making the best decisions they can. We shouldn’t be asking them to use their expertise to deal with the shortcomings of poor tools. Nor should we succumb to the convenient notion that some fancy new tool will solve all our problems.
Getting Started
As I’ve outlined, there is a lot to think about here. But I want to provide a basic starting point for a simple microservice architecture in terms of what and how you should capture things.
To start off with, you want to be able to capture basic information about the hosts your microservices are running on—CPU rate, I/O, and so on—and make sure you can match a microservice instance back to the host it is running on. For each microservice instance, you want to capture response times for its service interfaces and record all downstream calls in logs. Get correlation IDs into your logs from the start. Log other major steps in your business processes. This will require that you have at least a basic metric and log aggregation toolchain in place.
I’d hesitate to say that you need to start with a dedicated distributed tracing tool. If you have to run and host the tool yourself, this can add significant complexity. On the other hand, if you can make use of a fully managed service offering easily, instrumenting your microservices from the start can make a lot of sense.
For key operations, strongly consider creating synthetic transactions as a way of better understanding if the vital aspects of your system are working properly. Build your system with this capability in mind.
All of this is just the basic information gathering. More importantly, you need to make sure you can sift this information to ask questions of the running system. Are you able to say with confidence that the system is properly working for your users? Over time, you’ll need to collect more information and improve your tooling (and the way you use it) to better improve the observability of your platform.
Summary
Distributed systems can be complicated to understand, and the more distributed they are, the more difficult the task of production troubleshooting becomes. When the pressure is on, alerts are blazing, and customers are screaming, it’s important you have the right information available to you to work out what the hell is going on and what you need to do to fix it.
As your microservice architecture becomes more complex, it becomes less easy to know in advance what problems may happen. Instead, you will frequently be surprised by the types of problems you will encounter. It thus becomes essential to shift your thinking away from the mostly (passive) activity of monitoring and toward actively making your system observable. This involves not just potentially changing your toolset but also shifting away from static dashboards to more dynamic slicing and dicing activities.
With a simple system, the basics will get you a long way. Get log aggregation in from the start, and get correlation IDs in your log lines too. Distributed tracing can follow later, but be on the lookout for when the time comes to put that into place.
Shift your understanding of system or microservice health away from a binary state of “happy” or “sad”; realize instead that the truth is always more nuanced than that. Switch from having every little problem generating an alert to thinking more holistically about what is acceptable. Strongly consider embracing SLOs and alerting based on these precepts to reduce alert fatigue and properly focus attention.
Above all, this is about accepting that not all things are knowable before you hit production. Get good at handling the unknown.
We’ve covered a lot, but there is more to dig into here. If you want to explore the concepts of observability in more detail, then I recommend Observability Engineering by Charity Majors, Liz Fong-Jones, and George Miranda.15 I also recommend both Site Reliability Engineering16 and The Site Reliability Workbook17 as good jumping-off points for a wider discussion around SLOs, SLIs, and the like. It’s worth noting that these last two books are very much written from a viewpoint of how things are (or were) done at Google, and that means these concepts won’t always translate. You probably aren’t Google and probably don’t have Google-sized problems. That said, there is still a lot to recommend in these books.
In the next chapter, we’ll take a different, albeit still holistic view of our systems and consider some of the unique advantages—and challenges—that fine-grained architectures can provide in the area of security.
1 Honestly Black Lives Matter (@honest_update), October 7, 2015, 7:10 p.m., https://oreil.ly/Z28BA.
2 Fire as a cause of system outage isn’t a totally far-fetched idea. I once helped in the aftermath of a production outage caused by a storage area network (SAN) catching fire. That it took several days for us to be told a fire had occurred is a story for another day.
3 I didn’t say I was succeeding.
4 Leslie Lamport, “Time, Clocks, and the Ordering of Events in a Distributed System,” Communications of the ACM 21, no. 7 (July 1978): 558–65, https://oreil.ly/qzYmh.
5 See the analysis Kyle Kingsbury did on Elasticsearch 1.1.0 in “Jepsen: Elasticsearch,” https://oreil.ly/uO9wU and on Elasticsearch 1.5.0 in “Jepsen: Elasticsearch 1.5.0,” https://oreil.ly/8fBCt.
6 Renato Losio, “Elastic Changes Licences for Elasticsearch and Kibana: AWS Forks Both,” InfoQ, January 25, 2021, https://oreil.ly/VdWzD.
7 Charity Majors, “Metrics: Not the Observability Droids You’re Looking For,” Honeycomb (blog), October 24, 2017, https://oreil.ly/TEETp.
8 Mostly. AWS does now provide bare metal instances, which messes with my brain a bit.
9 United States President’s Commission on the Accident at Three Mile Island, The Need for Change, the Legacy of TMI: Report of the President’s Commission on the Accident at Three Mile Island (Washington, DC: The Commission, 1979).
10 National Transportation Safety Board, Safety Recommendation Report: Assumptions Used in the Safety Assessment Process and the Effects of Multiple Alerts and Indications on Pilot Performance (Washington, DC: NTSB, 2019).
11 Steven Shorrock, “Alarm Design: From Nuclear Power to WebOps,” Humanistic Systems (blog), October 16, 2015, https://oreil.ly/RCHDL.
12 Charity Majors (@mipsytipsy), Twitter, July 7, 2019, 9:48 a.m., https://oreil.ly/4VUAX.
13 “Observability: A Complete Overview for 2021,” Lightstep, accessed June 16, 2021, https://oreil.ly/a1ERu.
14 Ben Sigelman, “Three Pillars with Zero Answers—Towards a New Scorecard for Observability,” Lightstep (blog post), December 5, 2018, https://oreil.ly/R3LwC.
15 Charity Majors, Liz Fong-Jones, and George Miranda, Observability Engineering (Sebastopol: O’Reilly, 2022). At the time of writing, this book is in early release.
16 Betsy Beyer et al., eds., Site Reliability Engineering: How Google Runs Production Systems (Sebastopol: O’Reilly, 2016).
17 Betsy Beyer et al., eds., The Site Reliability Workbook (Sebastopol: O’Reilly, 2018).