6.5 Using Vector Graphics in HTML Documents
If you want to use vector graphics on the web, the XML format called Scalable Vector Graphics (SVG) is available for this purpose. The advantage of SVG is that a graphic never loses quality when you zoom in or out. For this reason, an SVG graphic can be printed in high quality on a printer. Unlike other graphics in JPEG or PNG format, for example, you can create and edit SVG files in a simple text editor.
Because SVG is in plain text in an XML syntax and thus platform-independent, you can also create such a graphic in PHP, change it dynamically with JavaScript, or format it with CSS. In practice, this format is very suitable for cartography and illustrations of all kinds, such as logos, icons, scientific charts, program flow charts, technical drawings, and graph visualizations, among others.
6.5.1 Adding SVG as a Graphic Reference Using <img>
The easiest way to include an existing SVG graphic might be to use it as a graphic reference with the <img> tag and the src attribute. You learned about the img element in detail in Section 6.1, and it works with SVG graphics just as it does with ordinary JPEG, PNG, or GIF images, except that you need to include an SVG resource instead.
For this purpose, here’s a simple HTML document to which an SVG graphic has been added as a graphic reference with the <img> tag:
...
<h1>SVG as graphic reference</h1>
<p>
  <img src="logo.svg" width="100" height="50" alt="50%"><br>
  <img src="logo.svg" alt="100%"><br>
  <img src="logo.svg" width="400" height="200" alt="200%">
</p>
...
Listing 6.8 /examples/chapter006/6_5_1/index.html
In the example and in Figure 6.16, you can see that the quality of the SVG graphic always remains the same, even if you’ve scaled the size of the display with the attributes width and height. Try it out for yourself by setting the width to 4,000 pixels and the height to 2,000 pixels, for example. The original size of the SVG file logo.svg is 200 × 100 pixels.
Editors for Editing SVG Graphics
You can create SVG using applications such as Adobe Illustrator (www.adobe.com/products/illustrator.html) or the free Inkscape (https://inkscape.org). There are also tools online, such as SVG-edit (https://github.com/SVG-Edit/svgedit), which I used to create the SVG graphics for this book. Nevertheless, you can also write and modify SVG completely manually, using an ordinary text editor. After all, SVG is written with XML. Editors such as Inkscape or SVG-edit are ideal for learning SVG because you can then view the XML code in the text editor and thus better understand the structure of the format.
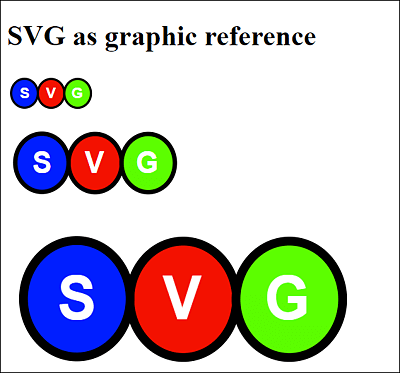
Figure 6.16 SVG Added as a Graphic Reference via <img>
6.5.2 Embedding SVG Directly into the Web Page Using <svg>
With HTML, it’s also possible to embed SVG directly into the HTML document. SVG itself provides different tags, for example, for circles, ellipses, rectangles, polygons, lines, elements for paths, texts, and animations.
You can write the HTML elements <svg>...</svg> anywhere in the document body between <body> and </body>. The SVG syntax with the SVG elements must be written between <svg> and </svg>. Taking all of this into consideration, a simple example looks as follows:
...
<body>
<h1>Embedding SVG graphics directly</h1>
<p>
  <svg width="300" height="100">
    <ellipse ry="45" rx="140" cy="50" cx="150"
             fill="red" stroke-width="10" stroke="black"/>
    <text text-anchor="middle" font-size="60"
          y="67" x="150" fill="black">SVG</text>
  </svg>
</p>
</body>
...
Listing 6.9 /examples/chapter006/6_5_2/index.html
In this example, we describe an ellipse filled with red color and black text with the SVG tags <ellipse ... /> and <text ... />. Figure 6.17 shows what it looks like in the web browser.
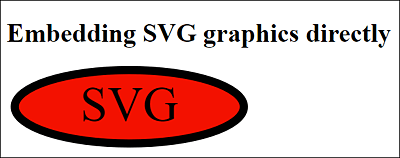
Figure 6.17 Here, an SVG Graphic Was Created That’s Directly Embedded in the HTML Document
6.5.3 SVG Tags for Vector Graphics
In between <svg> and </svg>, you must follow the rules for XML documents and keep in mind that the documents are case sensitive. In addition, you must close the standalone SVG tags using the / character, for example, <circle ... />). Unlike HTML, SVG syntax is very precise, and an error will usually result in incorrect or even no rendering at all of the SVG graphic.
6.5.4 Overview of Graphical SVG Elements
This section provides a brief overview of the graphical elements in SVG. The goal here is just to show you how to include SVG elements in an HTML document and use them with basic shapes.
Coordinate System
In an SVG graphic, the coordinate system has its origin at the top left. Coordinate data with an x-axis thus points to the right, and those with a y-axis point downward. You define the coordinate system at the beginning in the opening <svg> tag via width and height.
For all graphical SVG elements, you can specify an outline (stroke-width; stroke; stroke-linecap; stroke-dasharray), transparency (opacity), and fill color (fill) using the relevant attributes.
The graphic elements in SVG are as follows:
-
<path .../>
A path consists of a line described by various combinations of elliptic arcs, quadratic and cubic curves, and various distances. -
<circle .../>
Defines a circle described by a radius (r) and the position of the center (cx, cy). Let’s take a look at a simple example:<svg height="200" width="200">
<circle cx="100" cy="100" r="90"
stroke="black" stroke-width="3" fill="purple" />
</svg> -
<ellipse .../>
Defines an ellipse with the two semi-axis radii, which, as with the circle, are described by the position of the center point (cx, cy). The radius is described with a horizontal (rx) and a vertical (ry) radius:<svg height="300" width="100">
<ellipse cx="50" cy="150" rx="45" ry="140"
style="fill:yellow;stroke:black;stroke-width:3" />
</svg> -
<rect .../>
The name says it all. This element defines a rectangle over the upper-left corner (x, y) with width and height. Rounded corners are also possible. For example, for a simple rectangle you could write the following:<svg width="410" height="200">
<rect x="5" y="5" width="390" height="150"
style="fill:red;stroke-width:3;stroke:black" />
</svg>By the way, the properties within style are different from those of classic CSS.
-
<line .../>
Defines a simple straight line across the coordinates of two endpoints (from x1, y1 to x2, y2). The following shows a simple example:<svg height="100" width="250">
<line x1="0" y1="0" x2="250" y2="100"
style="stroke:blue;stroke-width:3" />
</svg> -
<polygon .../>
This element allows you to describe a polygon via the different endpoints. You pass the individual x/y points to the point attribute. If, on the other hand, you need a line with different points that don’t connect at the end, <polyline .../> would be the right choice for you. For example, you can implement a simple triangle as follows: -
<text ...>...</text>
This element allows you to define a text. You specify the position of the beginning of the text with x and y. Using font-family, you can define the font, while font-size defines the size of the font. Let’s take a look at a simple example:<svg height="100" width="500">
<text x="5" y="80" fill="red" font-size="60">
A text with SVG
</text>
</svg>
Units of Measurement and Color Values
By default, the unit of measurement is px for pixels if no other specifications have been made. Nevertheless, you can force this unit by writing pt (for point), pc (for pica), mm (for millimeters), cm (for centimeters), in (for inches), em (relative unit of measure), or ex (relative unit of measure) after the specified value.
When you specify the fill color via fill, the same color values apply as with CSS, and you can use #FF00FF, rgb(100,0,100), rgb(100%, 20%, 80%), or just the color name blue.
6.5.5 Further Notes on Using SVG
Besides the graphical elements, there’s much more you can describe with SVG. For example, there’s the option to group multiple graphical elements via <g> and </g>, which allows you to apply transformations or styling to all elements grouped together.
You can style the elements either via the individual attributes or via the style attribute, similar to CSS. A transformation is also available. For example, you can use transform="rotate(...)" to rotate text and any shapes. In addition, SVG also provides an animation model.
Furthermore, you’ll find filters that allow you to add various effects to the SVG graphic. Thus, blurring, shadows, or illuminations are no problem with SVG. Linear and radial color gradients can also be defined and displayed.
6.5.6 Mathematical Formulas Using MathML
Mathematical formulas can be integrated directly into a web page using HTML via MathML. The implementation of MathML works similar to SVG and is put into effect using existing MathML tags to describe a mathematical formula. The MathML tags need to be written between <math> and </math>.
Unfortunately, support for MathML hasn’t really reached web browsers yet (currently only Firefox and Safari), but using MathJax (www.mathjax.org), you can fix the problem by writing the following in the HTML document head:
...
<script
  src="http://cdn.mathjax.org/mathjax/latest/MathJax.js?config=TeX-AMS-MML_
      HTMLorMML">
</script>
...
Here’s a simple mathematical formula that demonstrates the use of MathML in practice:
...
<head>
...
<script
  src="http://cdn.mathjax.org/mathjax/latest/MathJax.js?config=TeX-AMS-MML_
      HTMLorMML">
</script>
</head>
...
<h1>MathML for mathematical formulas</h1>
<p>
A simple mathematical formula:
    <math>
      <mrow>
        <msup><mi>a</mi><mn>2</mn></msup>
        <mo>+</mo>
        <msup><mi>b</mi><mn>2</mn></msup>
        <mo>=</mo>
        <msup><mi>c</mi><mn>2</mn></msup>
      </mrow>
    </math>
</p>
...
Listing 6.10 /examples/chapter006/6_5_6/index.html
You can see the example in Figure 6.18 during execution.
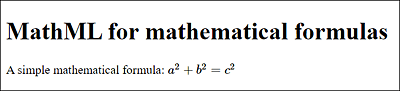
Figure 6.18 The Formula Was Formatted with MathML
I won’t go any deeper into MathML and the various tags available because the topic is quite specialized. For a comprehensive overview of MathML, see the W3C website at www.w3.org/TR/MathML3/.