Chapter 7. Container Orchestration
Throughout this book, you ran many different Docker containers on your development machine. Each time that you ran them, you did so using the same mechanism: manually running docker commands in your terminal. Of course, this is fine for doing local development, and perhaps it can be used to run a single service instance in production, but when it comes to running an entire fleet of services, this approach is going to get rough.
This is where a container orchestration tool comes into play. Loosely put, a container orchestration tool manages the lifetimes of many ephemeral containers. Such a tool has many unique responsibilities and must take into consideration situations like the following:
-
Containers need to scale up and down as load increases and decreases.
-
New containers are occasionally added as additional services are created.
-
New versions of containers need to be deployed to replace old versions.
-
A single machine may not handle all the containers required by an organization.
-
Like-containers should be spread across multiple machines for redundancy.
-
Containers should be able to communicate with one another.
-
Incoming requests for like-containers should be load balanced.
-
If a container is deemed unhealthy, it should be replaced by a healthy one.
Container orchestration works great with stateless services, like a typical Node.js service where instances can be destroyed or re-created without having many side effects. Stateful services, like databases, require a little more care to run in a container orchestration tool since there are concerns like persisting storage across deploys or resharding data as instances come and go. Many organizations choose to only run application code within a container orchestrator and to rely on a dedicated machine to run their databases.
In this chapter, you’ll only deploy stateless application code to a container orchestration tool. There are a few different tools available, but it seems one of them has surpassed the others in popularity.
Introduction to Kubernetes
Kubernetes is an open source container orchestration tool created by Google. Each major cloud PaaS has a way of exposing or otherwise emulating Kubernetes for its customers. Even the Docker company appears to have embraced Kubernetes by packaging it into their Docker Desktop products.
Kubernetes Overview
Kubernetes is a very powerful tool, one that requires many moving parts in order to function. Figure 7-1 is a high-level overview of some of the concepts that make up Kubernetes.
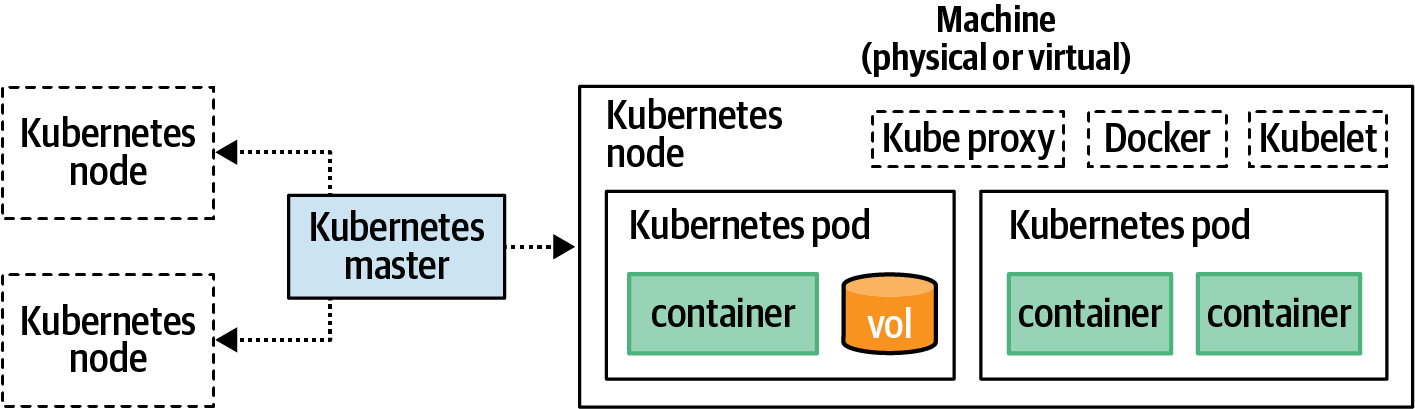
Figure 7-1. Overview of a Kubernetes cluster
Each of the components in this diagram has a hierarchical relationship and can be spread across multiple machines. Here’s an explanation of the different components and how they relate to one another:
- Container
-
As you might have guessed, a container in Kubernetes is equivalent to the containers you’ve been working with so far. They are an isolated environment that encapsulates and runs an application. Kubernetes works with a few different container formats such as Docker and rkt.
- Volume
-
A volume in Kubernetes is pretty much equivalent to a Docker volume. It provides a way to mount a filesystem in a semipermanent way outside of a container. Volumes won’t be covered in this chapter since a typical stateless Node.js service shouldn’t require a persistent volume. That said, they are certainly useful in a variety of situations.
- Pod
-
A pod represents an application instance. Typically a pod will only contain a single container, though it is possible to have multiple containers in one pod. A pod can also contain any volumes required by the pod’s containers. Each pod has its own IP address, and if multiple containers exist in the same pod, they’ll each share an address. A pod is the smallest unit that the Kubernetes API allows you to interact with.
- Node
-
A node is a worker machine—be it physical or virtual—that is part of the overall Kubernetes cluster. Each node needs to have a container daemon (such as Docker), the Kubernetes daemon (called Kubelet), and a network proxy (Kube Proxy) running on the machine. Different nodes may have different memory and CPU available, just as different pods might have different memory and CPU requirements.
- Master
-
The master represents a set of services that are run on a master node. The master exposes an API, which is what outside clients communicate with, such as the
kubectlcommand you’ll use throughout this chapter. The master delegates commands to the Kubelet processes running on individual nodes. - Cluster
-
A cluster represents the overall collection of the master and its various associated nodes. It’s technically possible to use a single cluster for different environments like staging and production by designating which pods belong to which environment. That said, it’s usually safer to maintain multiple clusters to prevent accidental cross-communication, especially if you ever plan on testing a cluster outside of production.
Kubernetes Concepts
When you interact with Kubernetes, you do so by declaring the desired state of the cluster. For example, you can tell it that you want 10 instances of the recipe-api service at version 0.0.3 to be running. You do not instruct the cluster how to achieve that state. For example, you don’t tell it to increase the current instance count of six by adding four entries. It’s ultimately up to Kubernetes to decide how to reach the desired state. It’s also up to Kubernetes to decide how long until that state is reached.
There are many additional concepts—beyond that of architecture—that you must understand before you can fluently run your applications on Kubernetes. The Kubernetes API exposes various resources in the cluster as objects. For example, when you deploy (verb) an application, you’re creating a deployment (noun). Here is a high-level list of the most important resources that you’ll work with throughout the rest of the chapter:
- Scheduling
-
Scheduling is the process by which Kubernetes determines the best node to assign newly created pods to. The default scheduler used in Kubernetes is called
kube-scheduler. Upon encountering a newly created pod, the scheduler examines available nodes. It considers the free CPU and memory of the node, as well as the CPU and memory requirements of the pod (if specified). A compatible node is then chosen to host the pod. If no nodes have capacity for the pod, then it can remain in a scheduled state where it waits for a node to become available. - Namespaces
-
A namespace is a Kubernetes mechanism for logically dividing a cluster into smaller, semi-isolated collections. By default, there are
default,kube-system, andkube-publicnamespaces created. Later, when you run a dashboard, an additionalkubernetes-dashboardnamespace is created. These can be used for environment namespaces likestagingandproduction. In this chapter you’ll deploy applications to thedefaultnamespace. - Labels
-
Labels are key/value pairs that are assigned to various resources, such as pods or nodes. They don’t need to be unique, and multiple labels can be assigned to an object. For example, a Node.js application could have the labels
platform:nodeandplatform-version:v14. A node might use labels likemachine:physicalorkernel:3.16. Theapplabel is how you’ll differentiate an instance of web-api from recipe-api. - Selectors
-
Selectors declare the requirements of a pod. For example, a particular pod might have the requirement that it run on a physical machine instead of a virtual machine since it needs to perform some extremely time-sensitive work. In this case, the selector might be
machine:physical. - Stateful sets
-
Kubernetes does work with stateful services, and stateful sets are intended to make this process convenient. They provide features often required by stateful services, such as consistent host names and persistent storage. The Node.js apps you’ll deploy in this chapter won’t use stateful sets.
- Replica sets
-
A replica set maintains a list of pods, creating new ones or deleting existing ones until the desired number of replicas has been met. It uses a selector to figure out which pods to manage.
- Deployments
-
A deployment manages a replica set. It can deploy new versions of an application, scale the number of instances, or even roll back to a previous version of an application.
- Controllers
-
Controllers tell Kubernetes how to change from one state to another. Replica sets, deployments, stateful sets, and cron jobs are each examples of a controller.
- Service
-
A service is a resource that exposes a set of pods to the network. It’s a lot like a reverse proxy, but instead of targeting a hostname and port, a service uses a selector to target pods. A Kubernetes service isn’t the same concept as the “service” used throughout this book to refer to a running process on a network. In this chapter, those will be referred to as applications.
- Ingress
-
An ingress resource manages external network access to a service within a Kubernetes cluster.
- Probe
-
A probe is a lot like the HAProxy health check that you worked with before. It can be used to tell if a pod is healthy and if it’s ready to receive traffic after being started.
As you can see, Kubernetes is an extremely powerful and malleable tool for deploying application containers. Kubernetes supports many primitives out of the box. There are often many ways to do the same thing in Kubernetes. For example, different environments can be simulated using either namespaces or labels. An application can be deployed using one or more replica sets. Many complex and opinionated patterns can be adopted for deploying to Kubernetes, yet only a subset of these features are required to get a distributed application running in production.
This list contains the most important concepts for an application developer to worry about. That said, it doesn’t even include everything required to get Kubernetes running in a high-throughput production environment! For example, Kubernetes also depends on the Etcd service. Instead of configuring several complex services to get Kubernetes running locally, you’ll instead depend on the much simpler Minikube. Minikube sacrifices some features, like the ability to run multiple nodes, but simplifies other things, like not having to configure Etcd and combining the master node with a worker node.
Starting Kubernetes
To continue on with this chapter, you’ll need to have Minikube and Kubectl installed on your development machine. Check out Appendix C for details on how to install them. Run the following commands in your terminal once you’re done to confirm they’re installed:
$minikube version$kubectl version --client
Now that you have a version of Kubernetes running on your development machine, you’re ready to start interacting with it.
Getting Started
Now that you have Minikube installed, you’re ready to run it. Execute the following command:
# Linux:$minikube start# MacOS:$minikube start --vm=true
This command might take a minute to finish. In the background, it’s downloading necessary containers and starting the Minikube service. It actually runs a Docker container dedicated to Minikube within your already-running Docker daemon.1 You can see this happening by running the docker ps command, though you might not get any results back if running Minikube on macOS.
In my case, I get the output shown in Table 7-1.
Container ID |
|
Image |
|
Command |
|
Ports |
|
Names |
|
Next, it’s time to take a look at some of the architecture used by Kubernetes. Run the following command to get a list of the nodes that currently make up your Kubernetes cluster:
$ kubectl get podsIn my case, I get the message “no resources found in default namespace,” and you should get the same thing. This is because no pods are currently running in the default namespace of the cluster. Kubectl uses the default namespace by default. That said, there are several pods already running in the cluster. These are pods required by Minikube itself. To see them, run the following slightly modified command:
$kubectl get pods --namespace=kube-system
In my case, I get nine entries, including the following:
NAME                               READY   STATUS    RESTARTS   AGE
coredns-66bff467f8-8j5mb           1/1     Running   6          95s
etcd-minikube                      1/1     Running   4          103s
kube-scheduler-minikube            1/1     Running   5          103s
You should get similar results, though the names and age and restart count will most likely be different.
Next, recall that another important feature of Kubernetes is the nodes, which represent the machines that ultimately run pods. Also recall that Minikube is a convenient way to run Kubernetes locally on a single node. Run the following command to get a list of nodes in your Kubernetes cluster:
$ kubectl get nodesIn my case, I get the following results:
NAME       STATUS   ROLES    AGE     VERSION
minikube   Ready    master   3m11s   v1.18.0
Here, a single node named minikube is present. Again, your results should be very similar.
Minikube comes with its own Docker daemon. This can make it a little confusing when working with containers on your local machine. For example, when you previously ran docker ps, you saw that a single new Docker container was started for your Minikube installation. You’ve also got a bunch of images in your local Docker daemon left over from the other chapters. However, there are other docker containers running inside of the Docker daemon that comes with Minikube, and it has its own isolated collection of images.
Minikube does come with a convenient tool to configure your docker CLI to switch to using the Minikube docker service. This tool works by exporting some environment variables that the docker CLI makes use of.
If you’re curious to see what these environment variables actually look like, run the command minikube -p minikube docker-env. In my case, I get the following
output:
export DOCKER_TLS_VERIFY="1"
export DOCKER_HOST="tcp://172.17.0.3:2376"
export DOCKER_CERT_PATH="/home/tlhunter/.minikube/certs"
export MINIKUBE_ACTIVE_DOCKERD="minikube"
You should get slightly different values but with the same environment variable names. Now, to actually apply these changes to your current shell session, run the following command to execute the export statements:
$eval$(minikube -p minikube docker-env)
Your docker CLI is now configured to use Minikube! Just keep in mind that any time you switch to a new terminal shell, you’ll revert back to using your system Docker daemon.
To prove that your docker CLI is now communicating with a different daemon, run the commands docker ps and docker images. In the output, you should see a whole bunch of k8s containers and images listed. Also, note that you shouldn’t see any of the previous containers or images you’ve worked with in this book (if you temporarily switch to a new terminal window and run those two commands again, you’ll see your previous containers and images).
Finally, even though you and I both love to work in the terminal, sometimes it takes a GUI to allow one to fully appreciate the complexity of a particular system. Minikube does come with such a graphical dashboard. It allows you to interact with the Kubernetes API using a browser. It also makes browsing the different types of resources a breeze and allows you to administer the cluster.
Run the following command in a spare terminal window to launch the dashboard:
$ minikube dashboardThis command might take a minute to run. In the background it creates a new Kubernetes namespace called kubernetes-dashboard and launches a few pods in it. Once the command is complete, it will both attempt to open a web browser to the dashboard and print out a URL to the dashboard. Copy the URL and visit it manually if your browser doesn’t automatically open. Figure 7-2 is a screenshot of the overview dashboard screen.
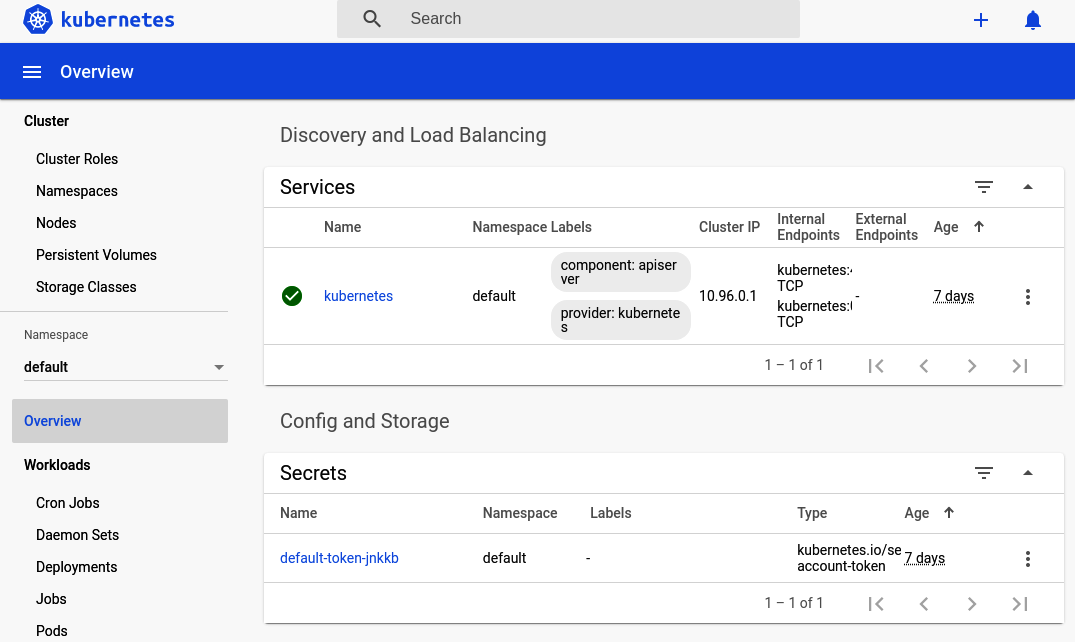
Figure 7-2. Kubernetes dashboard overview
Now is a good time to click around the interface and get familiar with the different screens. The sidebar is split into these different sections:
- Cluster
-
The cluster section lists attributes that affect the entire cluster globally, regardless of the selected namespace. This includes the list of nodes available in the cluster. Click the Nodes entry in the sidebar to see a list of nodes. In this case, you should just see the minikube node listed like when you ran the
kubectl get nodescommand. - Namespace
-
The namespace drop-down menu allows you to select which namespace the dashboard is viewing. Currently it is set to default. This is the namespace you’ll work with the most in this chapter. For now, select the kube-system entry. This will let you see some actual entries in the dashboard.
- Overview
-
The overview is the screen that you first saw when you opened the dashboard. Click it again now that you’re in the kube-system namespace. This screen contains a list of interesting entries in the namespace, as well as graphs about the health of those entries. On this screen, you should see four green circles (which are health pie charts) displaying stats on Daemon Sets, Deployments, Pods, and Replica Sets. Scroll down further on this screen and you will see individual entries making up each category. The overview screen only shows categories that contain resources, which is why when you first visited this screen in the default namespace it was so empty.
- Workloads
-
Workloads contains entries for the guts of a Kubernetes cluster. Click the Pods entry in the list. Here you can see a list of the different pods required to run Minikube. In the new list of pods, click the “etcd-minikube” pod. This takes you to a new screen with more information about this specific pod, such as the labels it uses, the IP address, and how many times Kubernetes has restarted it. At the end of the screen, it even gives you details about the container, such as the command it executed when starting the container.
- Discovery and load balancing
-
This section contains two entries, Ingresses, and Services. Recall that ingresses allow external requests to be passed to a service and that a service is essentially a reverse proxy for a set of pods. Click the Services entry to view the services required by Minikube. In this case, you should see a single entry called “kube-dns.” Click that entry to view more information about the service, such as the pods associated with it. In this case, there are two separate “coredns-*” pods running. Those two pods are managed by a “coredns-*” replica set.
- Config and storage
-
This section contains entries for performing configuration management, storage, and even secrets management. These entries won’t be covered in this chapter, though they’re definitely useful for many organizations.
Once you’re done poking around the dashboard, change the Namespace drop-down menu back to default. In the next section, you will deploy an application of your own, and it will be available in the default namespace. You’ll mostly interact with Kubernetes via the terminal for the rest of the chapter, but feel free to open the dashboard if you ever need a visualization of the state of your cluster.
Deploying an Application
You’re now ready to deploy an application to Kubernetes, and the kubectl CLI is the only tool that you’ll need to make it happen.
This utility can be used in two common ways. The first way is by passing various subcommands to it. For example, the kubectl get pods command you’ve been using has a subcommand of get, and the object type passed to that subcommand is pods. The other way of using this utility is by using the apply subcommand and passing in a flag for a configuration file. You’ll get to configuration files shortly, but for now, it’s time to use subcommands.
Kubectl Subcommands
For this first deployment, you’ll use a few different kubectl subcommands to interact with the Kubernetes API. These commands allow you to interact with Kubernetes without needing to write files to disk. This approach is perhaps akin to running docker run commands in your terminal. For this first deployment, you’ll run a generic hello world application to whet your appetite. This application is part of the Kubernetes documentation, but don’t worry, becuase you’ll be deploying real Node.js applications soon enough.
Recall that the deployment controller is commonly used for deploying applications to Kubernetes. This type of resource is likely the one that you’ll interact with the most as you work with a Kubernetes cluster on a day-to-day basis.
To create your very first deployment, run the following commands. Try to run them quickly so that you can view the status of the Kubernetes cluster while the deployment is in progress:
$kubectl create deployment hello-minikube\--image=k8s.gcr.io/echoserver:1.10$kubectl get deployments$kubectl get pods$kubectl get rs
The first command is what creates your deployment. The actual creation of the deployment resource is pretty quick, and the command should exit almost immediately. However, it still needs to do a bunch of background work before it’s truly complete. For example, the echoserver image needs to be downloaded and a container needs to be instantiated.
If you were able to run the subsequent commands quickly enough, you should see the status of the Kubernetes cluster while it’s trying to get things into the desired state. On my machine, I see the following command output:
$ kubectl get deployments
  NAME             READY   UP-TO-DATE   AVAILABLE   AGE
  hello-minikube   0/1     1            0           3s
$ kubectl get pods
  NAME                            READY STATUS            RESTARTS AGE
  hello-minikube-6f5579b8bf-rxhfl 0/1   ContainerCreating 0        4s
$ kubectl get rs
  NAME                        DESIRED   CURRENT   READY   AGE
  hello-minikube-64b64df8c9   1         1         0       0s
As you can see, the creation of the resources is immediate. In this case, a pod resource named hello-minikube-6f5579b8bf-rxhfl was immediately created. However, the actual pod isn’t up and ready yet. The READY column lists the value for that pod as 0/1. This means that zero of the desired one pods have been created. Note that in this case the deployment “owns” the replica set, and the replica set “owns” the pod. While you technically only requested that a deployment be created when you ran the command, it implicitly creates dependent resources of other types.
Once a minute or two passes, the cluster will most likely have finished creating the other resources. So, run those three kubectl get commands again. When I run those commands a second time, I get these results—though this time I’ve added the -L app flag to show the pod’s app label:
$ kubectl get deployments
  NAME             READY   UP-TO-DATE   AVAILABLE   AGE
  hello-minikube   1/1     1            1           7m19s
$ kubectl get pods -L app
  NAME                READY  STATUS   RESTARTS  AGE    APP
  hello-minikube-123  1/1    Running  0         7m24s  hello-minikube
$ kubectl get rs
  NAME                        DESIRED   CURRENT   READY   AGE
  hello-minikube-64b64df8c9   1         1         1       7m25s
In this case, enough time has passed that the cluster was able to reach the desired state. The images were downloaded, and containers have been instantiated. Your hello-minikube application is now up and running! That said, you can’t easily interact with it. To do that, you first need to create a service.
Recall that a service is like a reverse proxy for containers matching a certain selector. Run the following commands to create a new service and then to list the services:
$kubectl expose deployment hello-minikube\--type=NodePort --port=8080$kubectl get services -o wide
Here is the list of services available on my machine:
NAME           TYPE      ... PORT(S)        AGE  SELECTOR
hello-minikube NodePort  ... 8080:31710/TCP 6s   app=hello-minikube
kubernetes     ClusterIP ... 443/TCP        7d3h <none>
In this case, the kubernetes entry is used by the Kubernetes cluster itself. The hello-minikube entry is the one that belongs to your hello-minikube application. The type of this service is set to NodePort, which essentially forwards the specified port on the node machine to the port used by the container within the pod.
The SELECTOR column for this service lists the selectors that are used to target pods. In this case, the selector was implicitly created and it targets pods with an app label set to hello-minikube. As you saw previously, a label of app was implicitly set to hello-minikube on the pods when you created the deployment. These are operations provided by Kubectl to make interacting with the API easier.
The service that you created is ready almost immediately. With it created, you’re now ready to send it an HTTP request. But what URL should you request? In this case, you’ll need a bit of help from the minikube CLI to get the URL of the hello-minikube service. Run the following commands—the first one will display the service’s URL, and the second will make an HTTP request:
$minikube service hello-minikube --url$curl`minikube service hello-minikube --url`
In my case, I see that the URL to the service is http://172.17.0.3:31710. The hello-minikube HTTP service provides a bunch of information when you make the request. Assuming you didn’t receive an error, the request was a success!
Note that in this case there is no concept of ownership between the service and the other resources. The service is only loosely related to the pods since only their selector and labels happen to match. The service could technically match other pods as well, if any existed.
At this point it’s worth visiting the Kubernetes dashboard once again and viewing the resources that you’ve created. Check out the Deployments, Pods, and Replica Sets screens in the Workloads section, as well as the Services screen in the Discovery and Load Balancing sections of the dashboard.
Now that you’re done with the hello-minikube service, it’s time to tear it down. Run the following commands to delete the service and deployment resources that you previously created:
$kubectl delete services hello-minikube$kubectl delete deployment hello-minikube
When you delete the deployment, it will automatically delete the resources that it owns (in this case, the pods and the replica set). Once that’s done, run these commands to get a list of resources one final time:
$kubectl get deployments$kubectl get pods$kubectl get rs
Depending on how quickly you run the commands, you may see that the pod still exists. But if you do see it, the status of the pod should be listed as Terminating. Run the command a few more times and you should then see that the pod has disappeared entirely. Most of the interactions you have with Kubernetes will require time before the cluster can change from the existing state to your desired state.
Now that you’re familiar with running Kubectl commands to interact with your Kubernetes cluster, you’re ready to use more powerful configuration files.
Kubectl Configuration Files
The second approach for interacting with the Kubernetes API makes use of configuration files. This allows you to declaratively describe subsets of your Kubernetes cluster using YAML files, an approach reminiscent of running docker-compose commands. These interactions make use of the kubectl apply -f <FILENAME>
subcommand.
When you ran the other Kubectl commands, you were mostly working with a single resource at a time, like when you created the service, or sometimes multiple resources, like when the pod and replica set were created when you made a deployment. When working with configuration files, several potentially unrelated resources can be created at the same time.
In this section, you’ll deploy and run the recipe-api application that you previously built, this time with a few added niceties:
-
You’ll run five redundant replicas of the application at once.
-
A Kubernetes service will point to the instances.
-
Kubernetes will automatically restart unhealthy application replicas.
But first, you’ll need to build a Docker image and push it to the Kubernetes Docker service. Visit your recipe-api directory and build a new version of the image by running the following commands:
$cdrecipe-api$eval$(minikube -p minikube docker-env)# ensure Minikube docker$docker build -t recipe-api:v1 .
A Docker image tagged as recipe-api:v1 is now available in your Kubernetes Docker daemon.
Now you’re ready to create a configuration file for your application. First, create a file named recipe-api/recipe-api-deployment.yml. This file describes the deployment of the service, including the number of replicas to maintain, the port number, and a URL to use as a health check.
Now that you’ve created the deployment configuration file, begin by adding the content in Example 7-1 to it.
Example 7-1. recipe-api/recipe-api-deployment.yml, part one
apiVersion:apps/v1kind:Deploymentmetadata:name:recipe-apilabels:app:recipe-api

This section of the YAML file defines a deployment.

The name of this deployment is recipe-api.

The deployment has a label of
app=recipe-api.
The file begins by defining the deployment itself. The values should be pretty straightforward. So far, the file suggests that it’s being used to create a recipe-api deployment.
Next, add the content in Example 7-2 to the file.
Example 7-2. recipe-api/recipe-api-deployment.yml, part two
spec:replicas:5selector:matchLabels:app:recipe-apitemplate:metadata:labels:app:recipe-api
Five application replicas will run at once.
This section describes how the replica set will work. In particular, Kubernetes will need to run five replicas of the pods. The matchLabels selector is set to recipe-api, which means it will match pods with that label.
Now add the final content from Example 7-3 to the file. Note that the first line, spec, should have an indentation of four spaces; it’s a sibling property to the metadata field.
Example 7-3. recipe-api/recipe-api-deployment.yml, part three
#### note the four space indentspec:containers:-name:recipe-apiimage:recipe-api:v1ports:-containerPort:1337livenessProbe:httpGet:path:/recipes/42port:1337initialDelaySeconds:3periodSeconds:10
The pod’s only container uses the recipe-api:v1 image.
The container listens on port 1337.
The
livenessProbesection configures a health check.
This section of the file defines the container used by the pod and is a bit more complex than the previous sections. The name of the container is set to recipe-api and it is configured to use the recipe-api:v1 image, which is the image you most recently built and tagged.
The livenessProbe section defines the health check used to determine if the container is healthy or not. In this case, it’s configured to wait three seconds after starting the container, and then it makes an HTTP GET request every 10 seconds to the /recipes/42 endpoint. Note that this URL was chosen merely because it’s already present in the producer-http-basic.js application; consult with “Load Balancing and Health Checks” for building a better health check endpoint.
Now that your file is finished, it’s time to tell the Kubernetes cluster to apply the changes represented within. Run the following command:
$ kubectl apply -f recipe-api/recipe-api-deployment.ymlKubectl reads the file and, assuming it doesn’t find any typos, instructs Kubernetes to apply the changes. The same rules apply when running any other Kubectl commands to change the state of the cluster: changes aren’t immediate. Run this next command a few times until the output changes and your pods are marked with a status of Running:
$ kubectl get podsI get the following output on my machine:
NAME                          READY   STATUS    RESTARTS   AGE
recipe-api-6fb656695f-clvtd   1/1     Running   0          2m
... OUTPUT TRUNCATED ...
recipe-api-6fb656695f-zrbnf   1/1     Running   0          2m
The Running status signals that the pod is both running and currently passing its liveness health probes. To view more information about a pod’s health check, run the following command, replacing <POD_NAME> with the name of your pod (recipe-api-6fb656695f-clvtd in my case):
$kubectl describe pods <POD_NAME>|grep Liveness
I get the following liveness information in return:
Liveness: http-get http://:1337/recipes/42
  delay=3s timeout=1s period=10s #success=1 #failure=3
Next, create another file named recipe-api/recipe-api-network.yml, this time to define the Kubernetes service that will point to the pods that you’ve created. The service could have been defined within the same file by placing it in a separate YAML section, but the file was already long enough. Within this file, add the content from Example 7-4.
Example 7-4. recipe-api/recipe-api-network.yml
apiVersion:v1kind:Servicemetadata:name:recipe-api-servicespec:type:NodePortselector:app:recipe-apiports:-protocol:TCPport:80targetPort:1337
The service is named recipe-api-service.
This file describes a single service named recipe-api-service. It is a NodePort service, just like the one you previously defined. It targets pods matching the app=recipe-api selector and will forward requests to port 1337.
Apply the changes represented in this configuration file the same way you did for the previous one, by running this command with a new filename:
$ kubectl apply -f recipe-api/recipe-api-network.ymlOnce that’s done, run the kubectl get services -o wide command again. You should see an entry just like you saw when previously defining a service using the kubectl expose command, except this time the name of the service is a little longer.
Congratulations! You’ve now defined your Node.js recipe-api application using Kubernetes configuration files and have successfully deployed it to your local Kubernetes cluster. With that out of the way, you are now ready to deploy your web-api application.
Service Discovery
The web-api application is a little more complex than recipe-api. This application will still run redundant copies and require a service, but it will also need to communicate with the recipe-api service, and it will need to accept ingress connections from the outside world. To keep the configuration file short, it won’t contain the health check portion.
Enabling ingress connections for your cluster requires that you manually enable the feature. Run the following commands to do so:
$minikube addonsenableingress$kubectl get pods --namespace kube-system|grep ingress
The first command instructs Minikube to enable the ingress add-on, which is a way of extending the capabilities of Minikube. In this case, it creates a new container that uses the Nginx web server to perform ingress routing. The second command just shows you where the container lives. In this case, Kubernetes launches the Nginx container within the kube-system namespace. You don’t technically need to know where it runs, you’re just looking under the hood.
Many other ingress controllers are available, such as the beloved HAProxy covered in “Reverse Proxies with HAProxy”, though the default Nginx option is maintained directly by the Kubernetes project. Different ingress controllers support different features, but ultimately the controller configures some sort of reverse proxy to map incoming requests to a service.
By enabling ingress, you’re able to make requests to the web-api service by making a curl request to a single hostname instead of having to use the minikube CLI to locate the service’s host and port. This makes it easier to route requests from external clients to the appropriate node and container.
The relationship between these different Kubernetes resources can get a little complex. Figure 7-3 contains a visual overview of them. External requests are passed through web-api-ingress, which then passes the request to the web-api-service. This service passes the request to one of the web-api pods. The pod then sends a request to the recipe-api service, which then passes the request to a recipe-api pod. The mechanism by which the web-api application finds and communicates with the recipe-api application is called service discovery and is largely taken care of by Kubernetes.
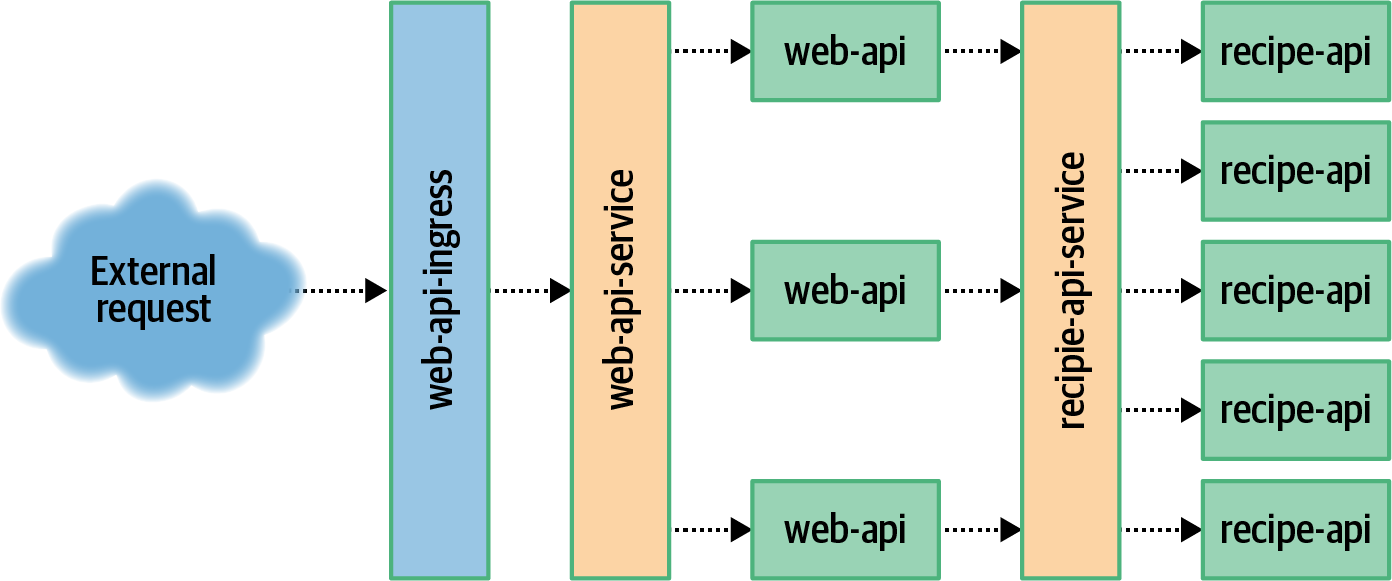
Figure 7-3. Service discovery overview
The first thing you need to do to get your web-api service ready for Kubernetes is to create a Dockerfile. Previously, when you worked with the project, you had created one for the Zipkin variant of the application. This time, you need one for the basic HTTP server. For this Dockerfile, you can copy the existing recipe-api file and make some changes. Copy the file and enter the web-api directory by running these commands:
$cp recipe-api/Dockerfile web-api/Dockerfile$cdweb-api
Next, modify the final line of the web-api/Dockerfile. Currently it’s still referencing the old producer-http-basic.js file and should instead reference the consumer-http-basic.js file:
CMD [ "node", "consumer-http-basic.js" ]With the Dockerfile out of the way, it’s now time to create the Kubernetes configuration files. First up is the one that defines the deployment. Create a new file named web-api/web-api-deloyment.yml. It starts off fairly similar to the one you created for recipe-api, except that the app name has been changed to web-api. Add the content in Example 7-5 to this file to get it started.
Example 7-5. web-api/web-api-deployment.yml, part one
apiVersion:apps/v1kind:Deploymentmetadata:name:web-apilabels:app:web-apispec:replicas:3selector:matchLabels:app:web-apitemplate:metadata:labels:app:web-api
This time the service will have three replicas.
So far, so good. Now it’s time to define the pod’s container. Add the content in Example 7-6 to finish the file. Note that the first line, spec, has four spaces of indentation and is a sibling to the previous metadata field.
Example 7-6. web-api/web-api-deployment.yml, part two
#### note the four space indentspec:containers:-name:web-apiimage:web-api:v1ports:-containerPort:1337env:-name:TARGETvalue:"recipe-api-service"
Environment variable configuration
This part of the deployment configuration file has diverged a bit from the previous file. Most notably you’ve added an env section to the container configuration. This directly translates into the environment variable feature that you previously used when running Docker containers directly. In this case, the TARGET environment variable has been set to recipe-api-service.
This might seem a bit interesting at first. The TARGET variable represents the host portion of a URL. And, since the value is set to recipe-api-service without a port, this means that the URL being requested by the application will look like http://recipe-api-service:80/ since HTTP uses a default port of 80.
An application running in Kubernetes can communicate with a service using a host named after the service it wishes to communicate with. This is pretty similar to how Docker works as well since both use a DNS service, except that Docker only pulls this off for containers running on the same machine. Kubernetes is able to achieve this regardless of which node in the cluster the applications are running on. This works because the Kube Proxy daemon running on each node forwards requests to other nodes. This is more impressive in a larger multinode Kubernetes cluster than in your current single-node Minikube cluster.
Now that your deployment configuration file is complete, you’re ready to modify your network configuration file. This file will begin similarly to the previous one you created. For now, add the content from Example 7-7 to the file.
Example 7-7. web-api/web-api-network.yml, part one
apiVersion:v1kind:Servicemetadata:name:web-api-servicespec:type:NodePortselector:app:web-apiports:-port:1337
This first section defines a service named web-api-service, which will forward incoming requests to port 1337 to the matching port 1337 within the web-api pods.
Example 7-8 contains the second half of the network file and is a bit more complex. In this case, it begins with three hyphens (---). This is a YAML convention for specifying that multiple documents exist within the same file. Essentially this allows you to concatenate related resource creation tasks within the same file. Add this content to your file.
Example 7-8. web-api/web-api-network.yml, part two
---apiVersion:networking.k8s.io/v1beta1kind:Ingressmetadata:name:web-api-ingressannotations:nginx.ingress.kubernetes.io/rewrite-target:/$1spec:rules:-host:example.orghttp:paths:-path:/backend:serviceName:web-api-serviceservicePort:1337
Nginx-specific configuration, such as URL rewriting, is supplied.
Additional virtual host routing rules are supplied.
This configuration file is intentionally more complex than it has to be in order to convey how the reverse proxy provided by the ingress controller can be configured in a very granular fashion.
First, notice the metadata.annotations configuration. In this case, it has an Nginx-specific line for configuring how incoming URLs can be rewritten before being passed to the service. In this example, the path from the incoming URL is passed through unchanged and, in fact, the entire annotations section can be removed and the configuration file would work just the same. However, within a more complex organization, you might need the ability to modify incoming requests.
The second set of configuration allows for routing based on virtual hosts. This configuration is universal and all ingress controllers should be able to use it. In this case, only requests destined for the domain example.org will match the rule. The configuration gets even more complex, matching paths beginning with / (this is also essentially a no-op). Finally, matching requests are passed to web-api-service. Note that the rule section can be simplified greatly to send any request, regardless of hostname and path, to the same service. By configuring this section of the ingress controller, you can apply the API facade pattern to expose multiple backend services using a single interface.
Now that your files have been configured, you’re ready to build the image for your web-api service and to deploy it to your Kubernetes cluster.
Run the following commands to do just that:
$eval$(minikube -p minikube docker-env)# ensure Minikube docker$docker build -t web-api:v1 .$kubectl apply -f web-api-deployment.yml$kubectl apply -f web-api-network.yml
Again, the pod creation step may take a minute to finish. Run the kubectl get pods command until your newly created web-api instances are running. Once that’s done, you’re ready to make a request using the ingress controller.
To make a request via ingress (instead of directly requesting the service), you’ll first need to get the IP address that the ingress is listening on. Run the following command to get this address:
$ kubectl get ingress web-api-ingressI get the following output when I run the command:
NAME              CLASS    HOSTS         ADDRESS      PORTS   AGE
web-api-ingress   <none>   example.org   172.17.0.3   80      21s
In my case, the IP address that I need to send requests to is 172.17.0.3. If you don’t see an IP address listed, you may need to wait a moment and run the command again. Also, note that the port is set to 80, which is the default port of an HTTP ingress.
Now you’re ready to make a request via ingress. Execute the following command, replacing <INGRESS_IP> with the IP address you obtained from the previous
command:
$curl -H"Host: example.org"http://<INGRESS_IP>/
If all goes to plan, you’ll receive the JSON payload that you’ve seen throughout this book. The consumer_pid and producer_pid values aren’t that interesting since each of the Docker containers runs your application with a process ID of 1. Rest assured that the two different Kubernetes services that the requests are being passed through are routing requests to the individual pods using round robin.
The IP address of the ingress controller will remain stable throughout the lifetime of the Kubernetes cluster. Even though pods will come and go, each of them getting new IP addresses, the IP address of the ingress remains the same.
If you wanted, you could run a reverse proxy on your machine, accepting incoming requests from port 80, and proxying the requests to the IP address of the ingress controller. This is how Kubernetes can be used in production to expose applications running within the cluster.
Of course, not just any resource within the cluster is exposed via ingress. Instead, you must define exactly which services are exposed. This is useful for segregating shallow upstream services, like the web-api, from internal downstream services, like recipe-api.
Modifying Deployments
Deployments are the resources that you’re most likely to interact with on a regular basis as an application developer. As you saw in the previous sections, modifying a deployment can trigger changes to an underlying replica set and pods.
The deployments that you’ve worked with so far all have names. Run the kubectl get deployments command and you will see two entries returned, one named recipe-api and the other named web-api. Those names were provided directly by the commands you ran. However, the names of dependent resources have been a little more dynamic. For example, on my machine, my recipe-api deployment has a replica set named recipe-api-6fb656695f, which in turn has a pod named recipe-api-6fb656695f-clvtd.
Since the deployment has a stable name, you’re able to modify it by reusing that same name. This section covers a few of the common ways that you’re likely to modify deployments as an application developer. Much like when you deployed an application using either configuration files or standard kubectl commands, you’re also able to modify deployments using both approaches.
Scaling Application Instances
The most basic way to modify a deployment is to scale the number of instances. In Kubernetes parlance, each redundant instance of an application is referred to as a replica. So, when you scale a deployment, you’re changing the number of pod replicas within that deployment.
You’re currently running five replicas of the recipe-api application. Run the following commands to get a list of your pods, to scale the number of replicas to 10, and to get the new list of pods:
$kubectl get pods -lapp=recipe-api$kubectl scale deployment.apps/recipe-api --replicas=10$kubectl get pods -lapp=recipe-api
In this case, you should see that Kubernetes creates the five new pods, and depending on how quickly you ran the final command, some of them will have a status of ContainerCreating. Wait some time and run the final command again, and their statuses should have changed to Running.
You could modify that command to set the number of replicas back down to five,
but there’s another way to modify a deployment. The recipe-api/recipe-api-deployment.yml file that was used to first create the deployment can also be used to modify it. Specifically, when you run the kubectl apply command, it’s not just limited to creating resources. Really, it instructs the Kubernetes cluster to make whatever changes are necessary to then resemble the resource definitions in the specified configuration file.
In this case, the state of the cluster is currently different than that of the configuration file. Specifically, the file wants a replica count of 5, but the cluster has a replica count of 10. To scale the number of replicas back down to five, run the same kubectl apply command again:
$ kubectl apply -f recipe-api/recipe-api-deployment.ymlThe output for the apply command can take on three forms:
deployment.apps/recipe-api created
deployment.apps/recipe-api configured
deployment.apps/recipe-api unchanged
The first line is what you had encountered previously when running kubectl apply. This line states that a new resource has been created. This time, however, you should have received the second line of output. This line means that the resource represented in the configuration file was found—using the resource’s name—and that the resource was modified. The final line is what you’ll see if the cluster currently resembles the state desired by the file and no action is necessary. Go ahead and run that kubectl apply command one more time. This time you should get the unchanged line in response.
Note that as the number of pod replicas grows and shrinks, the service is still able to route requests to each of the available pods. Once a pod is terminated, it should no longer receive any requests. Once a pod has been added, it will wait for the health check to pass (which have been enabled for the recipe-api) before it begins receiving requests.
Kubernetes has an advanced feature called the Horizontal Pod Autoscaler. This is used to dynamically scale the number of replicas based on various criteria such as CPU usage or even based on custom metrics like the ones you previously generated in “Metrics with Graphite, StatsD, and Grafana”. This is an advanced feature supported by Kubernetes that you may consider using for production applications, but it won’t be covered here.
Deploying New Application Versions
You’ll also probably find yourself in a situation where you need to deploy newer versions of an application. Since Kubernetes deals with applications encapsulated in a container, this means building new versions of an application’s Docker image, pushing the image to a Docker server, and then instructing Kubernetes to deploy the new version of an application container based on the image.
When you deploy a new version of an application, you don’t want to kill off the old deployment resource and create a new one. Instead, you want to piggy back on it and replace the pods that belong to that deployment.
Before you can deploy a new version of the application, you first need to create it. For the sake of illustration, you can do this by simply adding a new endpoint to the existing application code. Run the following commands to add a new endpoint and to build a web-api:v2 version of your application:
$cdweb-api$echo"server.get('/hello', async () => 'Hello');"\>> consumer-http-basic.js$eval$(minikube -p minikube docker-env)# ensure Minikube docker$docker build -t web-api:v2 .
Next, edit the web-api/web-api-deployment.yml file. Once inside, modify the spec.template.spec.container.image property
and change it from image: web-api:v1 to image: web-api:v2.
Once you’ve made that change, run the following command to deploy the changes and to watch the pods deploy:
$kubectl apply -f web-api-deployment.yml$kubectl get pods -w -lapp=web-api
The -w flag tells Kubectl to watch the changes being made to the Kubernetes cluster, and it will keep drawing output as changes are made to the web-api pods in your
cluster. Once the process is finally complete you can kill the watch operation with
Ctrl + C.
Figure 7-4 displays a timeline of what you should see in your terminal. To start off, you have three instances of v1 running. When you ran the command to apply the deployment, new v2 pods were created. Eventually, the desired number of v2 pods were created and deemed healthy. Kubernetes then switches the service over from v1 to v2. Once that’s done, Kubernetes handles the termination of the v1 pods. Finally, all the old pods are gone and only the new pods are running.
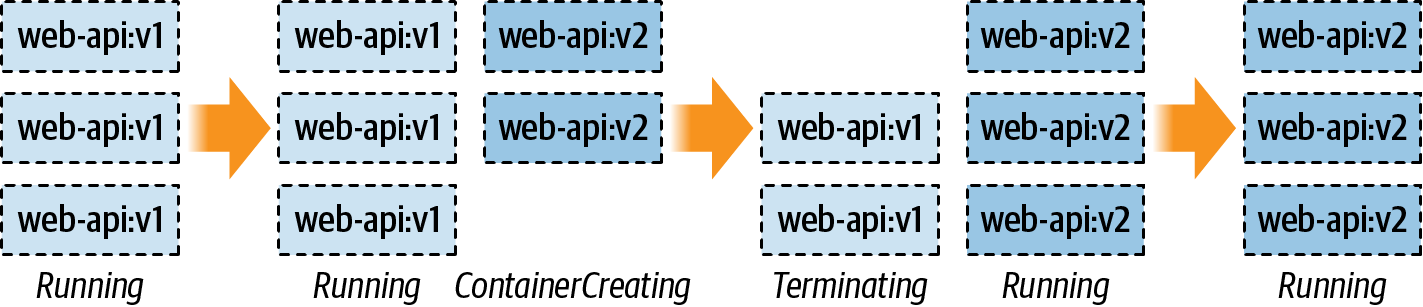
Figure 7-4. How deployments affect pod state
At this point, you can send a request to one of your pods by using the existing web-api-service service.
You can do so by running the following command to request your newly added /hello route:
$curl`minikube service web-api-service --url`/hello
You should see the message “Hello” displayed in your terminal.
One thing to note is that when you deployed a new version of the application, the old replica set has been left behind! It has been updated to have a scale of zero. You can see this happen when you run the following command to list your replica sets:
$kubectl get rs -lapp=web-api
In my case, I get the following replica sets in return:
NAME                 DESIRED   CURRENT   READY   AGE
web-api-6cdc56746b   0         0         0       9m21s
web-api-999f78685    3         3         3       3m8s
Here the new replica set web-api-999f78685 has three instances and the old set web-api-6cdc56746b has zero. You can also see this happen when you read the list of pods in your cluster. By default the pods are named with the following pattern when they’re created as part of a deployment: <DEPLOYMENT>-<REPLICA_SET>-<RANDOM>.
The replica set names are actually fairly consistent. If you were to, for example, modify the web-api-deployment.yml file to revert it back to having an image of web-api:v1, the previous replica set would get used again and the new replica set would get scaled down to zero.
Rolling Back Application Deployments
If you’re anything like me, you will occasionally merge some bad code, forget to catch an exception, or will otherwise release a faulty version of an application to production. When this happens, such a broken version needs to be reverted to a previous known-good version of the application. This act of reverting a bad version to a good version is known as a rollback.
Docker already maintains a list of previous images, which is nice, but an image doesn’t contain everything required to represent a container. For example, the web-api service requires some metadata such as environment variables and a port to listen on—things that are defined in the deployment YAML file. If you had lost this YAML file and only had the Docker image, would you be confident that you could rebuild and deploy a properly configured container? What if you were also dealing with the stress of a production incident?
Luckily for you and me, Kubernetes retains information about previous deployments. This allows you to roll back to a previous deployment by executing a few commands.
But first, it’s time to release a broken application. This version of the application adds a new endpoint /kill that causes the process to immediately exit. Run the following commands to amend the web-api service with the new route and to build a new version of the container:
$cdweb-api$echo"server.get('/kill', async () => { process.exit(42); });"\>> consumer-http-basic.js$eval$(minikube -p minikube docker-env)# ensure Minikube docker$docker build -t web-api:v3 .
Once your image has been built, you’re ready to perform another deployment. Edit the web-api-deployment.yml file again, this time changing the image line from web-api:v2 to web-api:v3. Once that’s done, run the following command to perform another deployment:
$kubectl apply -f web-api-deployment.yml --record=true
Note that this time the --record=true flag has been added. You’ll see what this flag is used for in a moment. Once the new version of the application deploys, you’re ready to test the new endpoint. Make the following request:
$curl`minikube service web-api-service --url`/kill
Once you run that command, you should get an error back that curl received an empty reply from the server. Next, run the command kubectl get pods -l app=web-api to get a list of your pods again. When I run this command, I get the following results:
NAME                       READY   STATUS    RESTARTS   AGE
web-api-6bdcb55856-b6rtw   1/1     Running   0          6m3s
web-api-6bdcb55856-ctqmr   1/1     Running   1          6m7s
web-api-6bdcb55856-zfscv   1/1     Running   0          6m5s
Notice how the second entry has a restart count of one, while the others have a restart count of zero. This is because the container had crashed and Kubernetes automatically restarted it for me. Depending on how quickly you ran the command, you might either see the restart count set to one or the count set to zero but with a status of Error—an indication that Kubernetes hasn’t yet restarted the container.
The investigative methods were a little contrived, but at this point you’ve confirmed that v3 of the application is broken and that it should be rolled back. In a production setting, you would hopefully be proactively alerted, like what you had set up in “Alerting with Cabot”.
Kubectl provides a subcommand for viewing a deployment’s history. Run the following command to get the history of your web-api deployment:
$kubectl rollouthistorydeployment.v1.apps/web-api
When I run the command, I get the following results:
REVISION  CHANGE-CAUSE
7         <none>
8         <none>
9         kubectl apply --filename=web-api-deployment.yml --record=true
You should get three different values in your revision column from what I have. In this case, I can see that there are three revisions, each with an incrementing counter to identify it, and that the third revision displays the command I had executed in the Change Cause column. The --record=true flag tells Kubectl to keep track of the command used to trigger the deployment. This can be more useful if the filename contains the application version, for example.
In my case, revision number 9 is the last one that I made, which must correlate to v3 of the application. The one before it, revision 8, therefore must correlate to v2 of the application. So, in order to deploy a working version of the application, I need to roll back from release 9 to release 8.
Run the following command to roll back your application deployment, replacing <RELEASE_NUMBER> with the second release number in your list (in my case, 8):
$kubectl rollout undo deployment.v1.apps/web-api\--to-revision=<RELEASE_NUMBER>
Once you run that command, you should get the output message of deployment.apps/web-api rolled back. Once that happens, run the kubectl rollout history deployment.v1.apps/web-api command again to see your list of deployments. In my case, I get the following list:
REVISION  CHANGE-CAUSE
7         <none>
9         kubectl apply --filename=web-api-deployment.yml --record=true
10        <none>
In this example, revision 8 has been removed from the list and has been moved to the end as revision 10. Think of this as a timeline where older revisions are at the top and newer revisions are at the bottom and where revision counts always increment and duplicate revisions aren’t listed.
To prove that the pods have been reverted to v2 of the application, make that same curl request to /kill one more time. This time, instead of taking out a server, you should get a 404 error.
And there you have it; you’ve successfully reverted a bad application deployment!
Now that you’re done with Kubernetes, you can either leave it running on your machine or clean up all the services that are currently running in the background. Personally, I find that my battery life is cut in half with it running. Run the following commands to delete all of the Kubernetes objects that you’ve created:
$kubectl delete services recipe-api-service$kubectl delete services web-api-service$kubectl delete deployment recipe-api$kubectl delete deployment web-api$kubectl delete ingress web-api-ingress$minikube stop$minikube delete
You should also switch to the terminal where you had run minikube dashboard and kill it with Ctrl + C.
You might also want to disable Kubernetes if you’re using Docker Desktop. Open the GUI preferences panel, visit the Kubernetes section and uncheck the Enable Kubernetes option, and then apply the changes.
1 The MacOS variant also installs the HyperKit hypervisor, which is necessary to later use the Ingress feature.