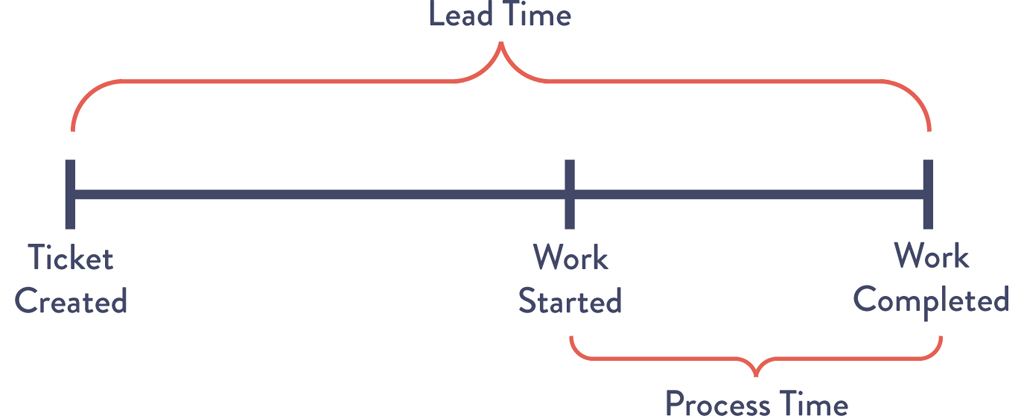
Figure 1.1: Lead Time vs. Process Time of a Deployment Operation
1
AGILE, CONTINUOUS DELIVERY, AND THE THREE WAYS
In this chapter, we present an introduction to the underpinning theory of Lean Manufacturing, as well as the Three Ways—the principles from which the observed DevOps behaviors can be derived.
Our focus here is primarily on theory and principles, describing many decades of lessons learned from manufacturing, high-reliability organizations, high-trust management models, and others, from which DevOps practices have been derived. The resulting concrete principles and patterns, and their practical application to the technology value stream, are presented in the remaining chapters of the book.
The Manufacturing Value Stream
One of the fundamental concepts in Lean is the value stream. We will define it first in the context of manufacturing and then extrapolate how it applies to DevOps and the technology value stream.
Karen Martin and Mike Osterling define a value stream in their book Value Stream Mapping: How to Visualize Work and Align Leadership for Organizational Transformation as “the sequence of activities an organization undertakes to deliver upon a customer request,” or “the sequence of activities required to design, produce, and deliver a good or service to a customer, including the dual flows of information and material.”1
In manufacturing operations, the value stream is often easy to see and observe: it starts when a customer order is received and the raw materials are released onto the plant floor. To enable fast and predictable lead times in any value stream, there is usually a relentless focus on creating a smooth and even flow of work, using techniques such as small batch sizes, reducing work in process (WIP), preventing rework to ensure defects are not passed to downstream work centers, and constantly optimizing systems toward global goals.
The Technology Value Stream
Many principles and patterns that enable the fast flow of work in physical processes are equally applicable to technology work (and, for that matter, for all knowledge work). In DevOps, we typically define our technology value stream as the process required to convert a business hypothesis into a technology-enabled service or feature that delivers value to the customer.
The input to our process is the formulation of a business objective, concept, idea, or hypothesis, and it starts when we accept the work in Development, adding it to our committed backlog of work.
From there, Development teams that follow a typical Agile or iterative process will likely transform that idea into user stories and some sort of feature specification, which is then implemented in code into the application or service being built. The code is then checked into the version control repository, where each change is integrated and tested with the rest of the software system.
Because value is created only when our services are running in production, we must ensure that we are not only delivering fast flow, but that our deployments can also be performed without causing chaos and disruptions, such as service outages, service impairments, or security or compliance failures.
Focus on Deployment Lead Time
For the remainder of this book, our attention will be on deployment lead time, a subset of the value stream described above. This value stream begins when any engineer* in our value stream (which includes Development, QA, IT Operations, and Infosec) checks a change into version control and ends when that change is successfully running in production, providing value to the customer and generating useful feedback and telemetry.
The first phase of work that includes design and development is akin to Lean Product Development and is highly variable and highly uncertain, often requiring high degrees of creativity and work that may never be performed again. Because of this, we expect high variability of process times. In contrast, the second phase of work, which includes testing, deployment, and operations, is akin to Lean Manufacturing. It strives to be predictable and mechanistic, with the goal of achieving work outputs with minimized variability (e.g., short and predictable lead times, near zero defects).
Instead of large batches of work being processed sequentially through the design/development value stream and then through the test/operations value stream (such as when we have a large-batch waterfall process or long-lived feature branches), our goal is to have testing, deployment, and operations happening simultaneously with design/development, enabling fast flow and high quality. This method succeeds when we work in small batches and build quality into every part of our value stream.†
Defining Lead Time vs. Processing Time
In the Lean community, lead time is one of two measures commonly used to measure performance in value streams, with the other being processing time (sometimes known as touch time or task time).‡
Whereas the lead time clock starts when the request is made and ends when it is fulfilled, the process time clock only starts when we begin work on the customer request—specifically, it omits the time that the work is in queue, waiting to be processed (Figure 1.1).
Figure 1.1: Lead Time vs. Process Time of a Deployment Operation
Because lead time is what the customer experiences, we typically focus our process improvement attention there instead of on process time. However, the proportion of process time to lead time serves as an important measure of efficiency—achieving fast flow and short lead times almost always requires reducing the time our work is waiting in queues.
The Common Scenario: Deployment Lead Times Requiring Months
Many teams and organizations find themselves in situations where deployment lead times require months. This is especially common in large, complex organizations that are working with tightly coupled, monolithic systems, often with scarce integration test environments, long test and production environment lead times, high reliance on manual testing, and multiple required approval processes. When this occurs, our value stream may look like Figure 1.2:
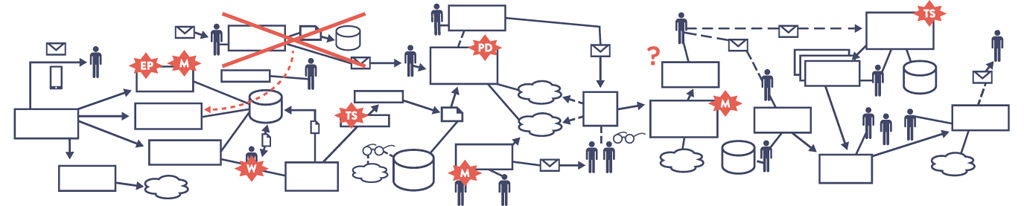
Figure 1.2: A Technology Value Stream with a Deployment Lead Time of Three Months
Source: Damon Edwards, “DevOps Kaizen,” 2015.
When we have long deployment lead times, heroics are required at almost every stage of the value stream. We may discover that nothing works at the end of the project when we merge all the Development team’s changes together, resulting in code that no longer builds correctly or passes any of our tests. Fixing each problem requires days or weeks of investigation to determine who broke the code and how it can be fixed, and still results in poor customer outcomes.
Our DevOps Ideal: Deployment Lead Times of Minutes
In the DevOps ideal, developers receive fast, constant feedback on their work, enabling them to quickly and independently implement, integrate, and validate their code and have the code deployed into the production environment (either by deploying the code themselves or by others).
We achieve this by continually checking small code changes into our version control repository, performing automated and exploratory testing against it and deploying it into production. This enables us to have a high degree of confidence that our changes will operate as designed in production and that any problems can be quickly detected and corrected.
This is most easily achieved when we have architecture that is modular, well encapsulated, and loosely coupled so that small teams are able to work with high degrees of autonomy, with failures being small and contained, and without causing global disruptions.
In this scenario, our deployment lead time is measured in minutes, or, in the worst case, hours. Our resulting value stream map should look something like Figure 1.3.
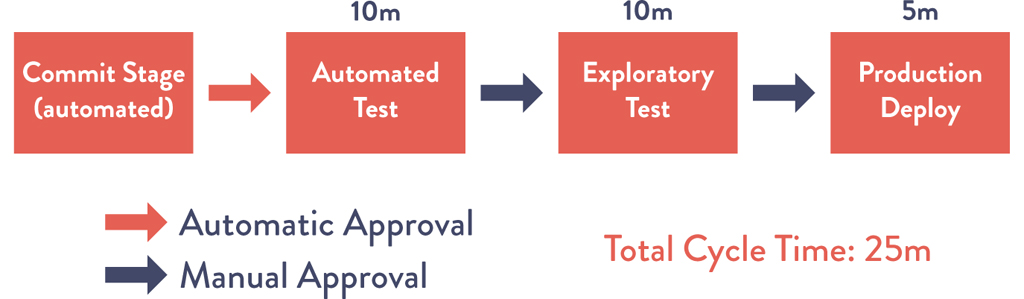
Figure 1.3: A Technology Value Stream with a Lead Time of Minutes
Observing “%C/A” as a Measure of Rework
In addition to lead times and process times, the third key metric in the technology value stream is percent complete and accurate (%C/A). This metric reflects the quality of the output of each step in our value stream.
Karen Martin and Mike Osterling state that “the %C/A can be obtained by asking downstream customers what percentage of the time they receive work that is ‘usable as is,’ meaning that they can do their work without having to correct the information that was provided, add missing information that should have been supplied, or clarify information that should have and could have been clearer.”3
Continuous Learning
Flow Metrics to Measure Delivery of Business Value
When measuring the end-to-end value of any value stream it is important to stay away from proxy metrics (counting the number of lines of code committed or solely the frequency of deployments). While these metrics can reveal local optimizations, they don't directly link to business outcomes such as revenue.
Using flow metrics provides a look into the end-to-end value of your software delivery, making software products and value streams as visible as widgets on a production line. In his book Project to Product: How to Survive and Thrive in the Age of Digital Disruption with the Flow Framework, Dr. Mik Kersten describes flow metrics as: flow velocity, flow efficiency, flow time, flow load, and flow distribution:4
•Flow velocity: number of flow items (e.g., work items) that are completed in a set time period. Helps to answer whether value delivery is accelerating.
•Flow efficiency: the proportion of flow items actively worked on to the total time that has elapsed. Identifies inefficiencies like long wait times and helps teams see if work upstream is in a wait state or not.
•Flow time: a unit of business value pulled by a stakeholder through a product’s value stream (i.e., features, defects, risks, and debts).Helps teams see if time to value is getting shorter.
•Flow load: number of active or waiting flow items in a value stream. This is similar to a measure of work in progress (WIP) based on flow items. High flow load leads to inefficiencies and to reduced flow velocity or increased flow time. Helps teams see if demand is outweighing capacity.
•Flow distribution: the proportion of each flow item type in a value stream. Each value stream can track and adjust these depending on their needs in order to maximize the business value being delivered.
The Three Ways: The Principles Underpinning DevOps
The Phoenix Project: A Novel about IT, DevOps, and Helping Your Business Win presents the Three Ways as the set of underpinning principles from which all the observed DevOps behaviors and patterns are derived (Figure 1.4).
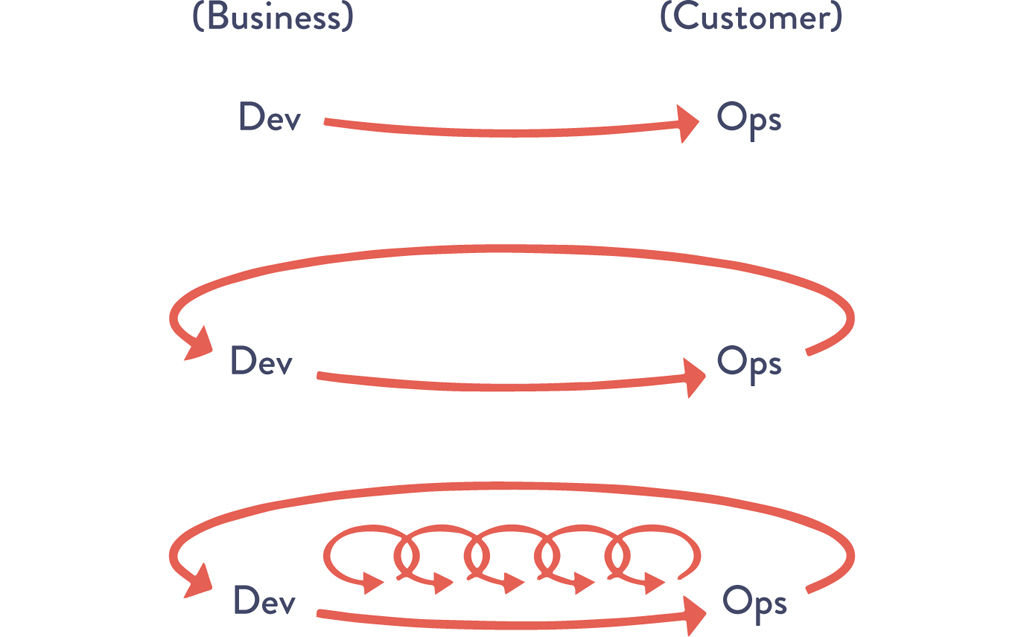
Figure 1.4: The Three Ways
Source: Gene Kim, “The Three Ways: The Principles Underpinning DevOps,” ITRevolution.com (blog), August 22, 2012, http://itrevolution.com/the-three-ways-principles-underpinning-devops/.
The First Way enables fast left-to-right flow of work from Development to Operations to the customer. In order to maximize flow, we need to make work visible, reduce our batch sizes and intervals of work, build in quality by preventing defects from being passed to downstream work centers, and constantly optimize for global goals.
By speeding up flow through the technology value stream, we reduce the lead time required to fulfill internal or customer requests, especially the time required to deploy code into the production environment. By doing this, we increase the quality of work as well as our throughput and boost our ability to innovate and out-experiment the competition.
The resulting practices include continuous build, integration, test, and deployment processes, creating environments on demand, limiting work in process (WIP), and building systems and organizations that are safe to change.
The Second Way enables the fast and constant flow of feedback from right to left at all stages of our value stream. It requires that we amplify feedback to prevent problems from happening again, or that we enable faster detection and recovery. By doing this, we create quality at the source and generate or embed knowledge where it is needed—this allows us to create ever-safer systems of work where problems are found and fixed long before a catastrophic failure occurs.
By seeing problems as they occur and swarming them until effective countermeasures are in place, we continually shorten and amplify our feedback loops, a core tenet of virtually all modern process improvement methodologies. This maximizes the opportunities for our organization to learn and improve.
The Third Way enables the creation of a generative, high-trust culture that supports a dynamic, disciplined, and scientific approach to experimentation and risk-taking, facilitating the creation of organizational learning, both from our successes and failures. Furthermore, by continually shortening and amplifying our feedback loops, we create ever-safer systems of work and are better able to take risks and perform experiments that help us learn faster than our competition and win in the marketplace.
As part of the Third Way, we also design our system of work so that we can multiply the effects of new knowledge, transforming local discoveries into global improvements. Regardless of where someone performs work, they do so with the cumulative and collective experience of everyone in the organization and throughout the organization’s history.
Continuous Learning
Research Supported: The Three Ways
The Three Ways aren’t just a good idea: research has shown that adopting these strategies leads to superior outcomes for both organizations and people.
In a six-year study led by co-author Dr. Nicole Forsgren in the 2014–2019 State of DevOps Reports, with Puppet and then DORA and published in the book Accelerate: The Science of Lean and DevOps, data shows there are better outcomes by combining capabilities and practices like continuous integration, test, deployment, and working in small batches (the First Way), fast feedback and monitoring (the Second Way), and a generative culture (the Third Way).5
The Three Ways help teams become elite performers by shipping software faster and more reliably, helping contribute to their organization’s revenue, market share, and customer satisfaction. Elite performers are twice as likely to meet or exceed their organizational performance goals. The Three Ways also improve the well-being of those doing the work. By adopting these practices, the research from the State of DevOps Reports shows decreased burnout and deployment pain.6
 CASE STUDY: NEW TO SECOND EDITION
Approaching Cruising Altitude: American Airlines’ DevOps Journey (Part 1) (2020)
American Airlines’ DevOps journey grew out of a series of questions, the first being simply “What is DevOps?”
“We were really starting at the very bottom, at the very beginning,” Maya Leibman, Executive Vice President and Chief Information Officer of American Airlines related at the DevOps Enterprise Summit-London 2020.7
To get started, the team did their research but, most importantly, they stopped making excuses. In the beginning of DevOps, most examples were coming from digital-native companies like Netflix and Spotify. It was easy for the team to discount their accomplishments—after all, they were born in the cloud. But as more traditional enterprises, companies like Target, Nordstrom, and Starbucks, got on board, American Airlines knew they didn’t have any excuses left.
The team started by,
1. setting concrete goals
2. formalizing their toolchain
3. bringin in coaches and mentors from outside the company
4. experimenting and automating
5. conducting immersive practical training (to learn while they were doing)
All of this was tied to their ultimate goal, which was to deliver value faster.
As Leibman said:
There were so many times when a business counterpart would bring something to the table, a new idea, and they’d say, “Oh this is what we want to do but it’s going to take IT six months or a year to get it done.” And those experiences just killed me. So the impetus behind this was really “how do we not be the long tent pole.” We knew there was a better way of working that would help us achieve that.8
Next, they decided what outputs they were going to measure:9
•deployment frequency
•deployment cycle time
•change failure rate
•development cycle time
•number of incidents
•mean time to recover (MTTR)
Early successes in value stream mapping helped team members better understand the end-to-end processes of the system and inspired motivation. From these successes, they built energy around how to attack issues and improve them. They also conducted immersive learning opportunities across IT.
These initial successes, learning about DevOps and starting to actually practice some elements of it, led them to the second big question on their DevOps journey: Finance, friend or foe?
The current finance approval process was cumbersome and lengthy, with months of approval cycles. “I used to describe it as a process that’s designed to make you give up,” said Leibman.10
The process looked like this:11
•No projects approved without Finance’s involvement.
•Projects were approved but no headcount added to do them (and no other priorities were stopped).
•Requests were given equal scrutiny regardless of size or risk.
•Requests were given equal scrutiny, even if the request was a top corporate priority and there was no question that it was going to be done.
•Projects were often completed before they were approved.
Even Finance knew that the process needed to change, but a lack of trust between Finance and IT caused a block. To help shed light on where the money was being spent and to build trust with Finance, the team undertook a cost mapping exercise and assigned all the costs to their products, including the costs to run them.
After this exercise, the IT team was able to better see where money was actually being invested and question whether that was the best use of it. And Finance was able to gain the visibility they needed to trust there weren’t large amounts of waste.
This visibility built the trust needed for experimentation. Finance took four product teams and gave them a set budget for the year. The teams defined the OKRs and used the budget for the top priorities they felt met those OKRs. This allowed the team to test before rollout and focus on accountability and outcomes, and Finance was able to gain even more visibility.
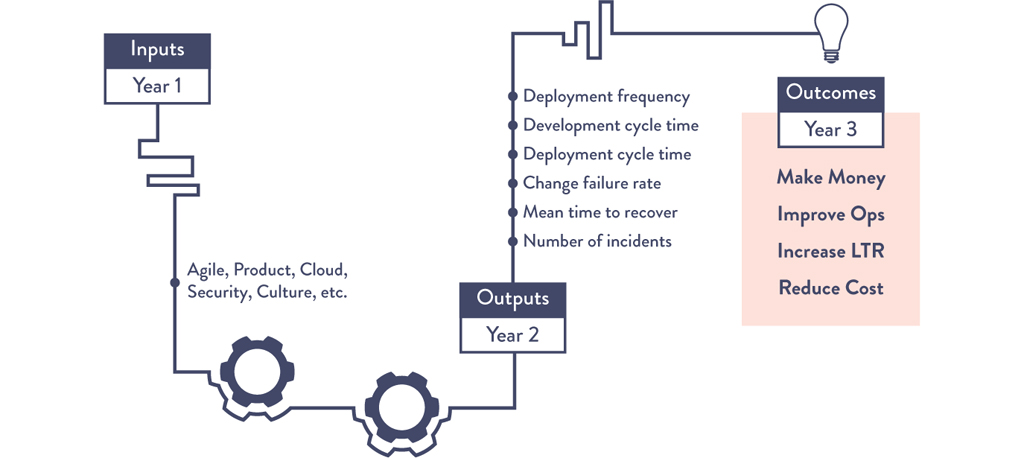
Figure 1.5: American Airlines’ DevOps Transformation Journey
Source: With permission of Ross Clanton
This success allowed them to scale the new model against all of their products and define a new funding process. “This was a huge accelerator in our journey,” said Leibman.12
With Finance on board and new processes in place, American Airlines discovered the third question in their DevOps journey: How do we know what the score is? With each small success, the team wanted to better understand how they were doing overall. In other words, they wanted to know what the score was.
For the American Airlines team, year one of their DevOps journey was really focused on inputs: learning about Agile/DevOps, focusing on products, cloud, and security, etc. Year two of their journey focused more on outputs, including the metrics they began measuring, like deployment frequency and mean time to recover. Finally in year three they started to focus not just on inputs and outputs but on outcomes. “At the end of the day, what do we really want to do?” said Leibman.
They came up with the following outcomes: make money, improve Ops, increase LTR, and reduce cost.13
In year one, one of our objectives was X% of people are going to go to Agile training. That really represents an input. In year two, as we started focusing more on outputs, the objectives sort of changed to X% of teams are going to up their agile maturity from this level to this level. And by the time we got to year three, agile wasn’t even an objective anymore. We realized the inputs and outputs are great, we have to measure them, but ultimately we have to be focused on the outcome.14
This finally led to the fourth question in their DevOps journey: What’s a product? It was clear that it was time to flesh out their taxonomy. This proved to be one of the most challenging moments of their journey. There were lots of opinions and no single right answer. In the end, they decided to just get started, put something on paper, organize around it, and fix it as they learned. And ultimately, this all led to their fifth question: Does this feel way bigger than DevOps? To answer that and to show some specific product success examples, we’ll continue the American Airlines journey later in the book.
This study illustrates applying the Three Ways by using value stream mapping to help optimize flow, selecting outcomes to measure in order to establish fast feedback, and creating immersive learning experiences to build a culture of continual learning and experimentation.
Conclusion
In this chapter, we described the concepts of value streams, lead time as one of the key measures of effectiveness for both manufacturing and technology value streams, and the high-level concepts behind each of the Three Ways, the principles that underpin DevOps.
In the following chapters, the principles for each of the Three Ways are described in greater detail. The first of these principles is Flow, which focuses on how we create the fast flow of work in any value stream, whether it’s in manufacturing or technology work. The practices that enable fast flow are described in Part III.
Going forward, engineer refers to anyone working in our value stream, not just developers. |
|
In fact, with techniques such as test-driven development, testing occurs even before the first line of code is written. |
|
In this book, the term process time will be favored for the same reason Karen Martin and Mike Osterling cite: “To minimize confusion, we avoid using the term cycle time as it has several definitions synonymous with processing time and pace or frequency of output, to name a few.”2 |