18.13 Support Tools and Analytics
Since being included in search results is so essential for a website to be successful, the major search engines provide tools that furnish insight that cannot be gained elsewhere. These tools may require you to register and log in, but they do not (always) require you to make changes to your webpages or provide data, beyond what is already publically accessible.
18.13.1 Search Engine Webmaster Tools
As we learned, search engines are complicated systems that crawl websites and index them behind the scenes. Having access to search engine systems that can tell you your site was crawled, how your site is indexed, and what traffic is being directed to your pages is very useful. As search engines change their weighting of various factors, these tools provide feedback as warnings and messages to highlight ways you can improve your site for the search engine’s purposes. For instance, the screenshot in Figure 18.41 shows Bing’s dashboard for our book’s site; the listing on the left illustrates the wide range of tools available, including information about:
Figure 18.41 Screenshot from Bing’s webmaster tools showing a range of stats
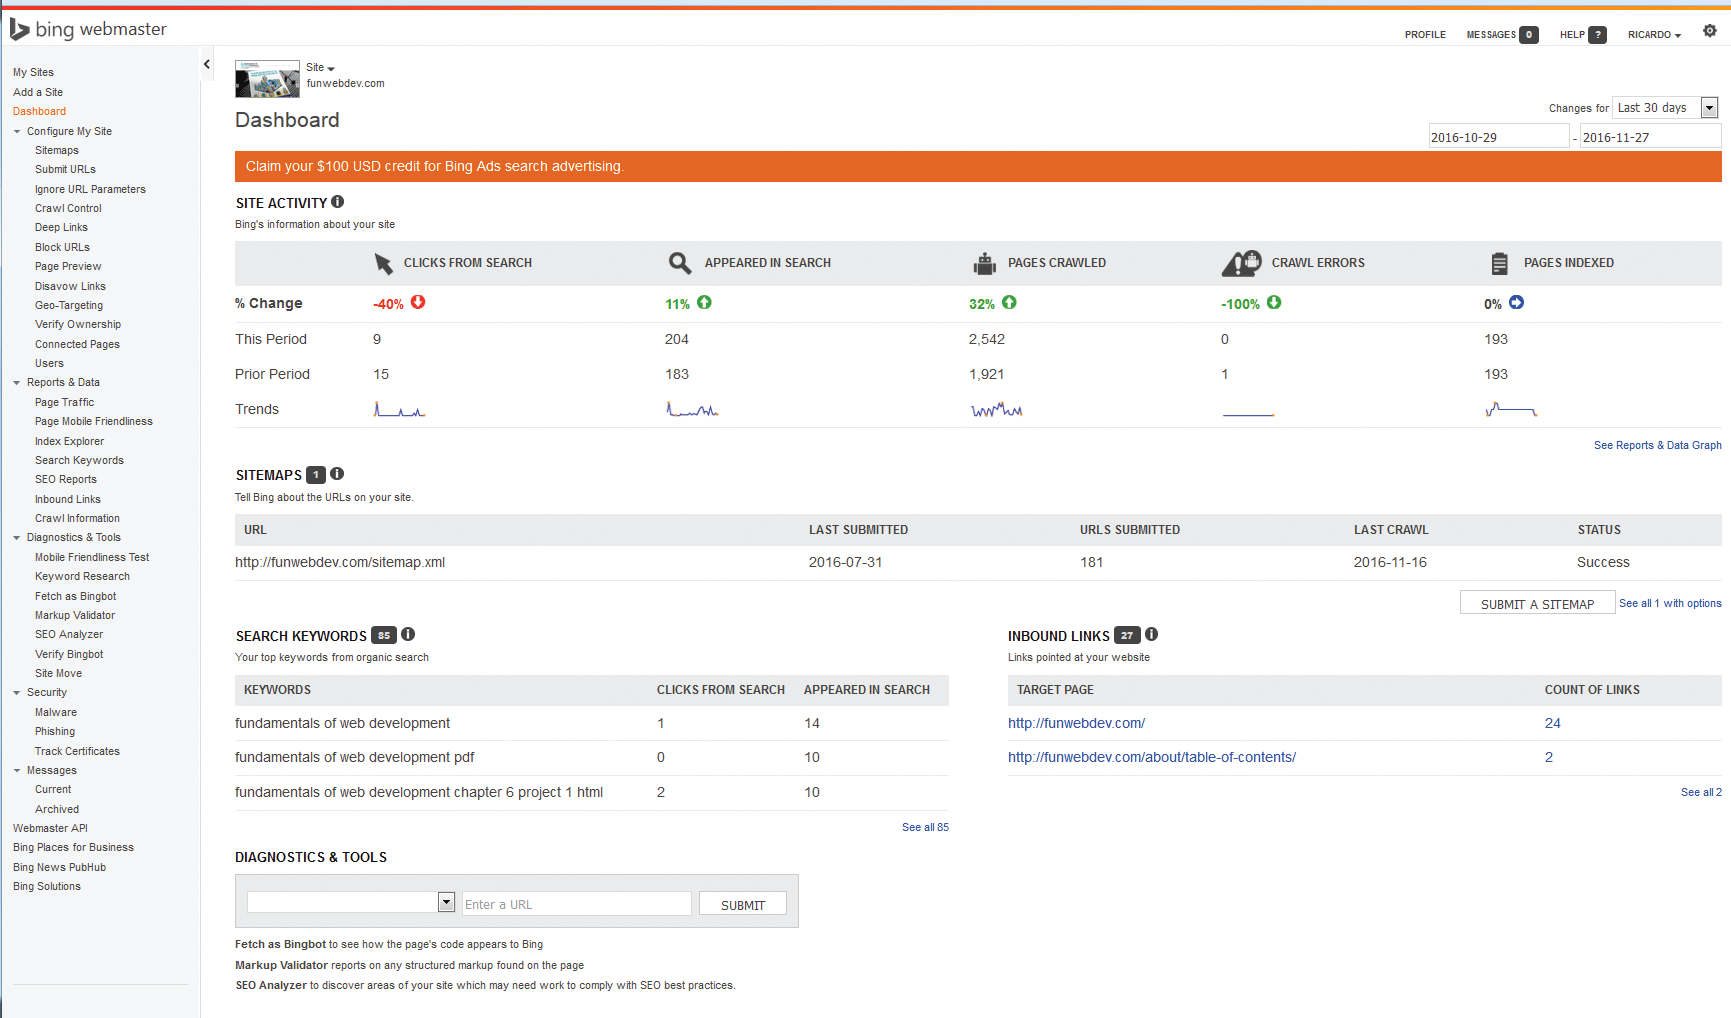
Indexed terms and weights
Indexing errors that were encountered
Search ranking and traffic
Frequency of being crawled
Response time during the crawls
To sign up for these types of tools, go to www.google.com/
18.13.2 Analytics
Analytics refers to the class of useful software tools that provide website owners with data-driven information about their websites to help them make and assess change to their sites. The ability to track whether a search engine optimization has been successful, a marketing campaign had an impact on traffic, or whether a new design is more effective in keeping visitors at the site than an old one are all important questions that analytics can help provide answers to.
Some examples of how analytics can be used include:
Tracking the bandwidth usage of each site you manage
Identifying the sites that are driving traffic to your site
Identifying popular URLs in your domain
Isolating and analyzing search engine crawler traffic
Seeing which search terms from search engines are being used to land on your site
Identifying which pages are the most popular for arriving (landing pages)
Tracking the flow of users as they click through your website
Categorizing visitors as new or returning (based on IP address, response codes)
Whether you manage your own statistics through internal analytics packages, rely on third-party tools, or adopt a combination of both, analytics is an increasingly important aspect of assessing and improving websites, making it critical knowledge for the modern web development professional.
Metrics
The field of web analytics does analysis of data, and as such has spawned some common measurements, or metrics, to help measure and compare various aspects of web traffic. Most of these metrics are included in most analytics packages, albeit to differing levels of sophistication.
Page Views is a count of all the times a page was requested, even if requested multiple times by the same user/IP address.
Unique Page Views counts page views but limits it to one request per page, per visit.
Average Visit Duration tells you how long people are spending on your site. Longer visits indicate more engagement than shorter ones.
Bounce Rate is the term given to the percentage of visitors who leave your site after visiting only one page. A high bounce rate means people are not getting past the front page, but it does not tell you why.
Internal Analytics
Back in Chapter 17, you saw how your webserver could keep track of all the requests over time using logging facilities. With all of those voluminous logs in place, there’s a lot of data that can potentially help you see patterns and trends in the data requests. For instance, the user-agent header can easily be parsed to determine the breakdown in the browser and operating systems used by your visitors. You could also figure out how many IP addresses appear more than once as return visitors, make some guesses about how long users stayed on the site, or identify potential attacks on your server.
Rather than write analysis scripts yourself, open source analysis packages such as AWStats and Webalizer allow you to download software which easily sets up periodic analysis of the log files to create bar graphs; pie charts; and lists of top users, browsers, countries, and more—all viewable through easy-to-use web interfaces as illustrated in Figure 18.42.
Figure 18.42 Screenshot of the top of the AWStats analytics report
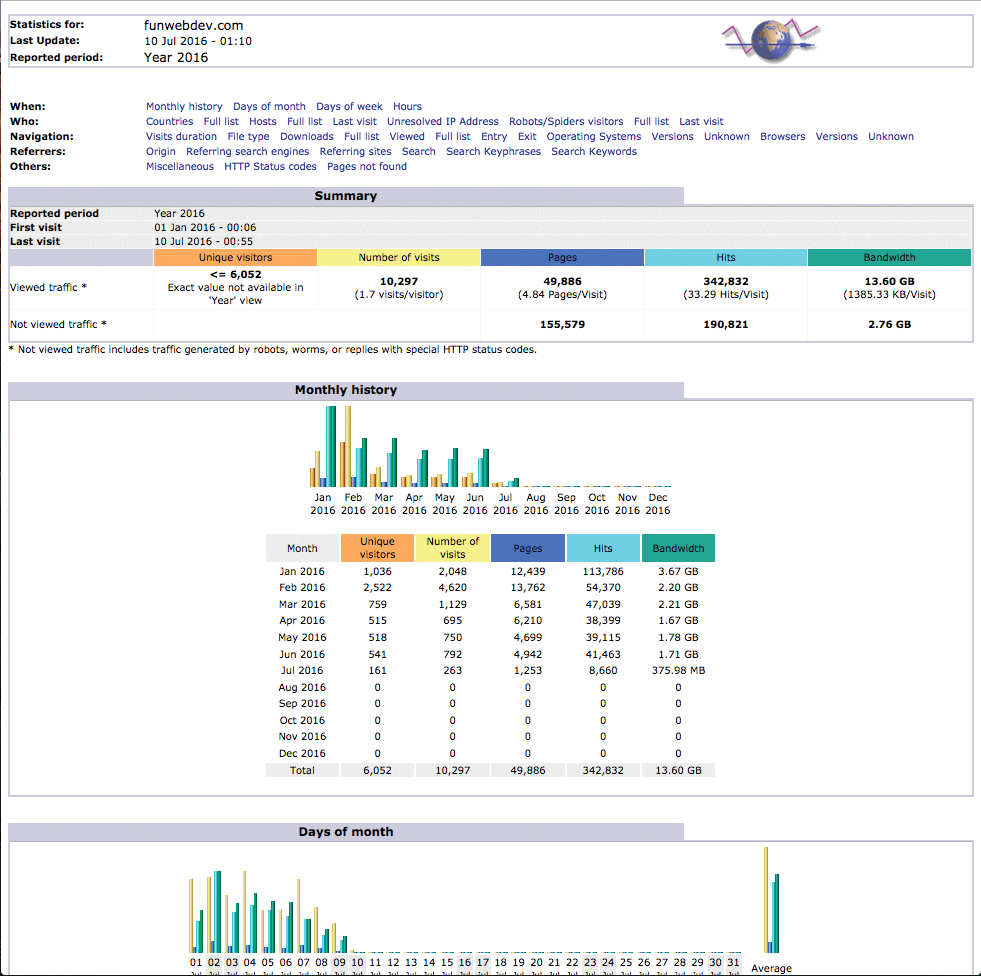
Since these systems are relatively easy to set up and use, the details of their installation are left as an exercise for the reader. Oftentimes, in simple shared hosting, these analytic tools are already installed and are accessible through the hosting company’s web portal.
18.13.3 Third-Party Analytics
Although internal analytics packages are a great option, third-party tools provide an alternative that include all of the metrics available internally, and much more sophisticated data that is only available through a larger network. In addition, these systems also manage additional logins for your clients who might want to access these statistics on their own. Third-party systems like Google Analytics analyze the same sort of traffic data, but rather than collect it from your server logs, they maintain their own logs which captures each surfer’s requests because you embed a small piece of JavaScript into each page of your site that tracks each requests directly. The specific JavaScript code to enable third party analytic tracking is provided to you directly from the provider for easy copy and paste.
The advantage of third-party analytics is the increased power of these systems and the ease of installation. The disadvantage is the lower accuracy of data (people block scripts) and disclosure of potentially valuable traffic information to the third party.
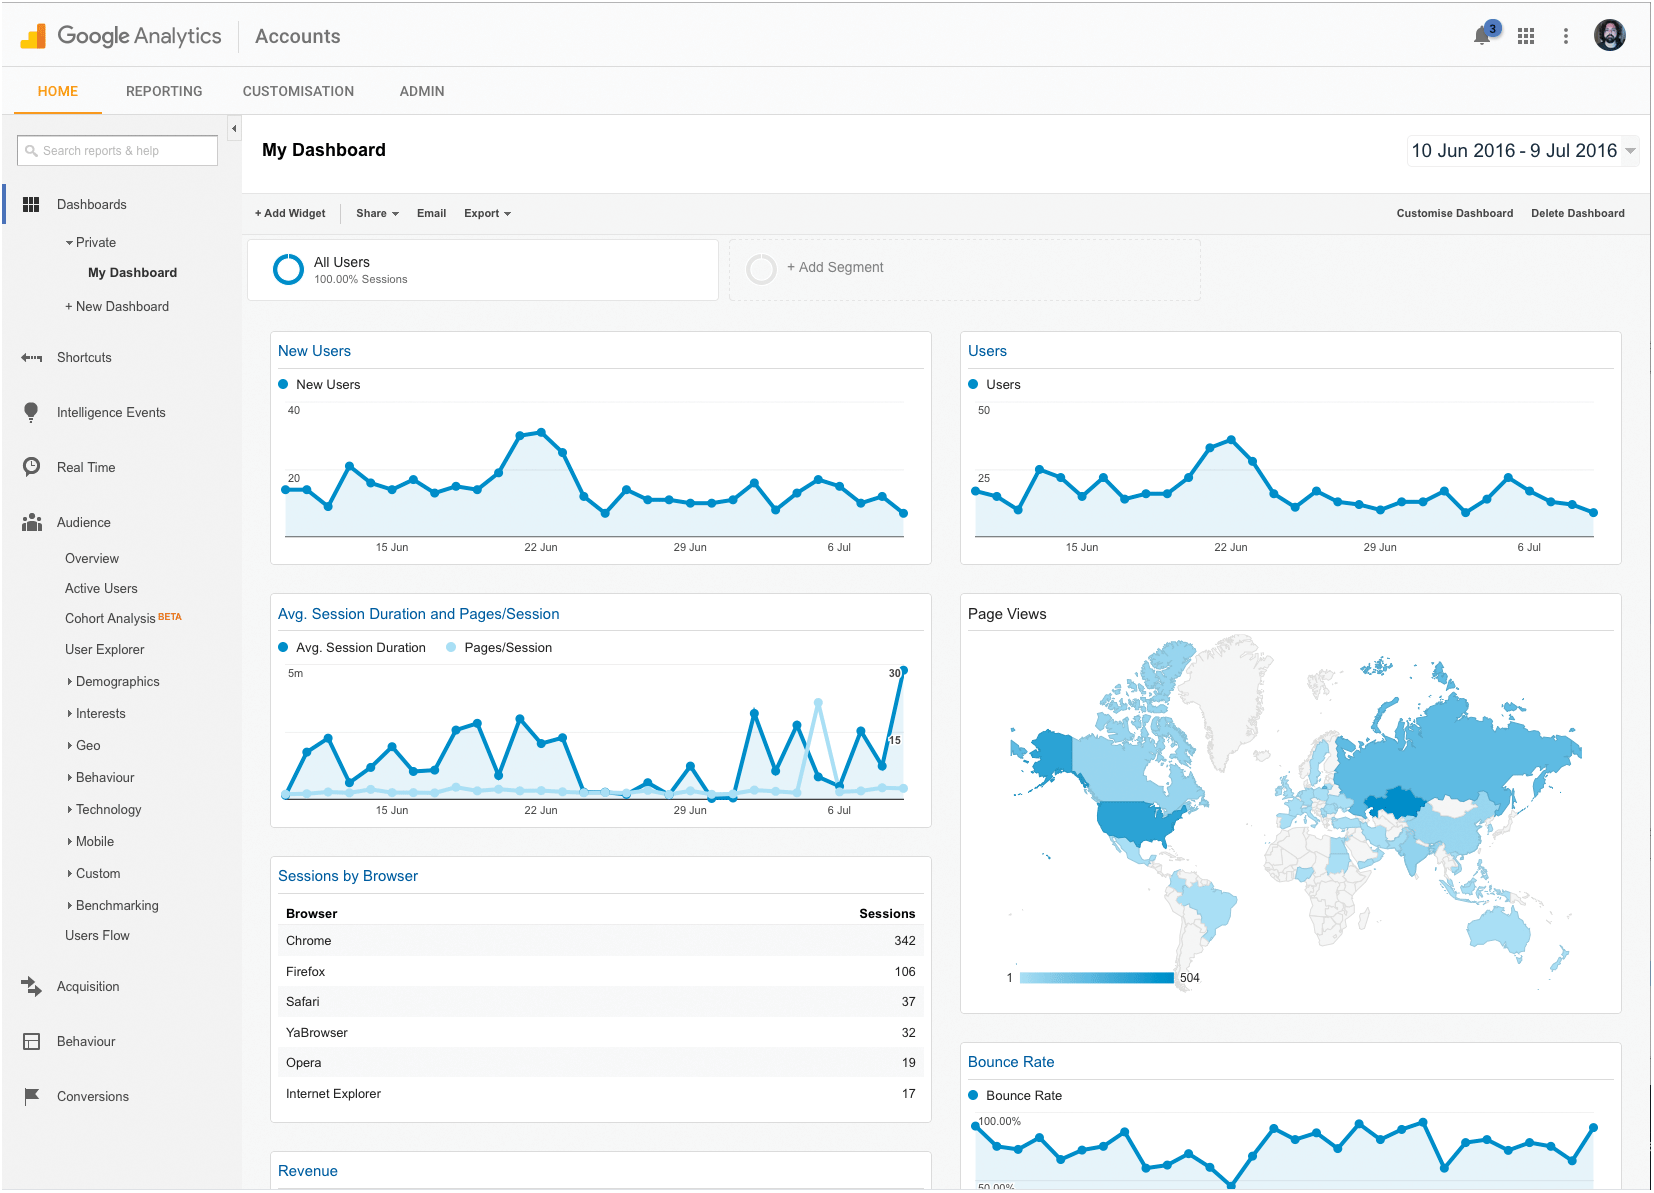
These tools are taking off in popularity, especially those offered by search engines like Google and Bing, which provide integration with other tools. Figure 18.43 shows the dashboard from Google Analytics, which as you can see, provides not only standard analysis like traffic and country of origin, but also integration with other tools.
Figure 18.43 A dashboard from the Google Analytics tool
Flow Analysis
One of the tools available from Google Analytics not yet available in the open source packages is the ability to visualize how visitors flow through your site. This lets you isolate traffic (by country, date, or browser) and see how those users are arriving at your site, how long they are staying, and which pathways through your site they are taking.
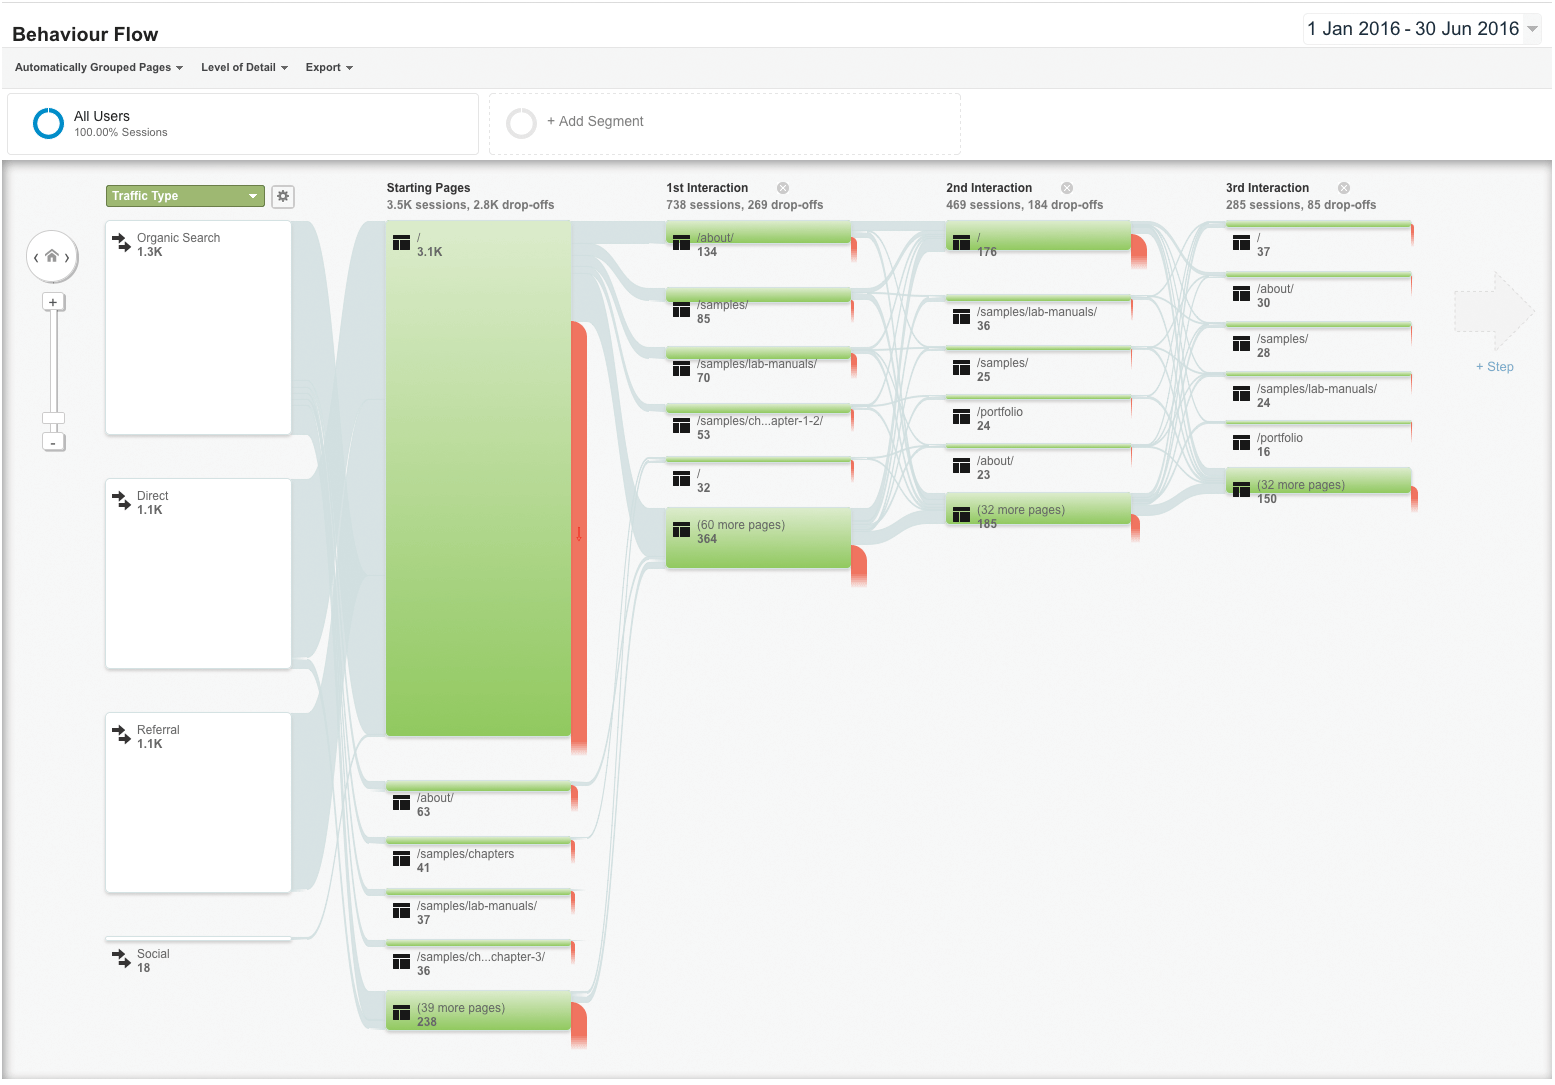
Figure 18.44 shows the traffic for the first half of 2016, breaks it into search, organic and referral traffic, and then illustrates visually how users arrive, leave, and move from page to page. Coupled with the ability to compare one time range with another, these tools provide the ability to analyze your other efforts to see if changes (structural, style, or content) have the desired impact on traffic flow.
Figure 18.44 Showing where users flow through and leave a website.
18.13.4 Performance Tuning and Rating
The importance of tuning your web pages for performance has been discussed throughout this book, and we’ve seen that making a website goes far beyond merely making it run quickly. Speed, accessibility, search engine performance, and security all factor into a real evaluation of performance. Thankfully, various tools have been developed over the decades to measure the speed and performance of your site. The Lighthouse project is one such open source tool that provides analysis across a range of categories and makes some specific technical suggestions that are easy for the web developer to integrate. The tool is built into Chrome and can also be accessed on the web (https://web.dev/measure/).
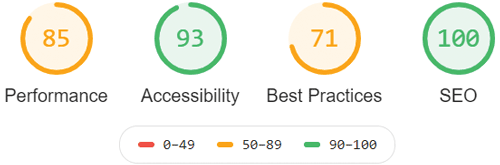
Performance, Accessibility, SEO and “best practices” are the four categories used by the lighthouse tool, and provide a great way to evaluate and improve your website. Figure 18.45 shows an initial screenshot of our own promotional website along with lists of suggestions. By applying the suggestions, the results are easily improved meaning a cleaner, faster site and a better user experience, summarized in Figure 18.46.
Figure 18.45 The Lighthouse tool showing an initial analysis for funwebdev.com
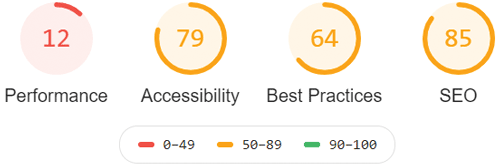
Figure 18.46 Thumbnails sequences generated by Lighthouse while analyzing the loading time of funwebdev.com

Performance (Speed)
Improving your website’s speed has been discussed throughout this book, and is probably the most common metric people think of when analysing a site. Recall that you can improve the speed of your site by optimizing the underlying PHP code, minimizing your javascript, improving your hosting infrastructure, tuning your server, setting cache correctly, using a CDN, using load distributors, deferring non-critical content, and much, much more. It’s inevitable that you’ve forgotten about one technique or another, and if you’ve used a CMS you may not even be certain what optimizations have or have not been made! Thankfully, the Lighthouse tool’s Performance category analyzes your site and presents specific suggestions that you can implement. Performance metrics determine how quickly the site seems to load using measures from user experience research that draw on human psychology, first covered in Chapter 2, to assess how fast a page seems to load and how quickly it seemingly becomes useful.
Using the browser rendering techniques from Chapter 2, Lighthouse renders successive images of the site at regular intervals while it loads. Slow loading images, layouts being moved, and colours or content being changed in CSS or Javascript show up as lower scores. Consider Figure 18.46a which shows a sequence of renderings. Suggestions to defer Javascript libraries, turn on compression and caching on our Apache server all helped us improve the loading score, which means a faster loading sequence shown in Figure 18.46b.
Accessibility
Accessibility is another issue you have learned about throughout this book, going back to Chapter 3 on HTML. Whether considering the alt text for an image, screen readers for the blind, colour contrast or applicable legislation, accessibility is really important. Thankfully Lighthouse also scores and provides feedback on a site’s accessibility, allowing you to quickly insert missing tags and adjust CSS accordingly. In our case the site had some missing alt text on some images, some missing name attributes for <a> tags, along with some colour contrast suggestions.
Seo
SEO was something we learned about earlier this chapter. Lighthouse checks for relative meta tags, robots.txt, descriptive titles, alt text for your images and canonical links among other things. It does not, however, check your outgoing links, calculate pagerank, or do any analysis on SEO beyond your content (which is still extremely valuable). In our case the WordPress plugin already took care of most of the SEO, although we were still missing a few key meta tags. If SEO matters to you, having a high SEO score in Lighthouse is essential.
Best Practices
Best Practices is the term that Lighthouse uses for everything that relates to security from Chapter 16 as well as miscellaneous practices, like using the correct DOCTYPE in your HTML. The security-related aspects of this check are helpful since they check all publicly visible Javascript libraries for vulnerabilities, something you’d have to do manually otherwise. The recommendation to serve all websites on https is another common suggestion, one that we address in Chapter 17. In our case we had lots of improvements to make, mostly related to the limitations of our shared host and several out of date plugins.
As you strive to improve your site using these tools, it can be easy to get lost in the pursuit for perfection, losing sight of the human users that actually matter. Please remember that these tools are excellent ways to metricize human experience, but they aren’t perfect. In our example summarized in Figure 18.47, we were able to improve all scores by addressing their observations but stopped short of excellent scores since we did not want to upgrade our hosting package, downgrade imagery, or replace the themes currently being used by WordPress. When using these tools, you will often be presented with suggestions that degrade your site or that require the newest technology that you may not have installed. In all cases, you either have to address the issue or simply accept the low score, and do what you can to address all other shortcomings.
Figure 18.47 The Lighthouse tool showing the final analysis for funwebdev.com