10.5 Using External APIs
So far in this chapter, you have encountered the term API multiple times. In section 10.4, you learned about using fetch() to retrieve data from external web APIs, which were simply web pages that return JSON instead of HTML. In the previous section, you learned about browser APIs, which were various objects available in the browser for performing very specific tasks, such as text-to-speech synthesis or determining the location of the user. In this section, you will be encountering yet another type of API, the external API.
What is an external API? An external API refers to objects with events and properties that perform a specific task that you can use in your pages. Unlike browser APIs, these external APIs are not built into the browser but are external JavaScript libraries that need to be downloaded or referenced and added to a page via a <script> tag. There are hundreds and hundreds of external JavaScript libraries available, and you may find that a given task your page needs to perform can be implemented more easily by using one of these libraries. In this section, we will look at two of the most popular ones: the Google Maps API and the plotly API.
10.5.1 Google Maps
The Google Maps API is very widely used. Both prior editions of this book have included a section or example on using this API. The code used to do so in the first edition (2014) no longer worked by the time of the second edition (2017). The code used in the second edition no longer works now at the time of writing (2020). Hopefully, when you use this edition, the Google Maps code still works—but it might not! The point here is that external APIs are an externality, meaning that you have no control over them and that change over time should be expected with them. Also, you will need to reference the API’s online documentation not only to learn its usage, but also to keep abreast of changes with it.
Google has several APIs for working with maps. The one with the most relevance for use within a JavaScript chapter is the Maps JavaScript API (https:/
 Note
Note
All of the Google APIs now require you to obtain an API key to use any of their APIs. The mechanism for obtaining a key has changed several times over the past decade. At present, to obtain an API key, you must first create an account with the Google Cloud Platform (GCP) and then create a project within the GCP. Once you do that, you can visit the credentials page of the APIs & Services area of GCP, and create a key via the Create Credential option. It is quite likely that the precise way to obtain an API key within the GCP may change again, so you may need to obtain up-to-date instructions from your instructor or reference instructions online from Google.
Listing 10.14 shows the minimal code necessary to display a map centered on Mount Royal University in Calgary, Canada (one of the author’s home institution). The size and shape of the map are controlled through CSS, while other options are set at initialization.
Listing 10.14 Webpage to output map centered on a location
<!DOCTYPE html>
<html>
<head>
<meta charset="utf-8"/>
<title>Chapter 10</title>
<style>
#map {
height: 500px;
}
</style>
<script>
function initMap() {
const map = new google.maps.Map(document.querySelector('#map'), {
center: {lat: 51.011179, lng: -114.132866},
zoom: 14
});
}
</script>
<script
src="https:/Notice that the API is made available to your page by referencing it in a <script> tag. For the Google Maps API, you typically provide your API key within that same <script> tag. As mentioned in the nearby note, the Maps JavaScript API requires an API key generated within the Google Cloud Platform console. Google prefers you to have a separate API key for each project.
 Pro Tip
The <script> tag can contain the keywords async and/or defer. These keywords can improve the perceived performance of pages using large JavaScript libraries. Normally, when the browser encounters a <script> element, it pauses HTML parsing while it downloads and parses the JavaScript.
The async keyword tells the browser that it can continue to parse the HTML while the JavaScript is being downloaded; when the JavaScript is being executed, the HTML will once again be paused.
The defer keyword, like the async keyword, tells the browser to continue parsing the HTML while the JavaScript is being downloaded. What's different from async is the execution of the JavaScript is deferred until the HTML has finished being parsed.
Notice also that the URL for the <script> element contains a callback querystring parameter in which we specified the name of our JavaScript function (initMap) that will be executed when the map API is loaded. Our initMap() function creates a map object via the google.maps.Map() function constructor, which is defined within the Google JavaScript API library downloaded in our <script> element. That constructor is passed the HTML element that will contain the map and a MapOptions object. While beyond the scope of this chapter, there are dozens of options you can control about the map through this object. The most important of these is the center property, which is used to specify what location to show on the map.
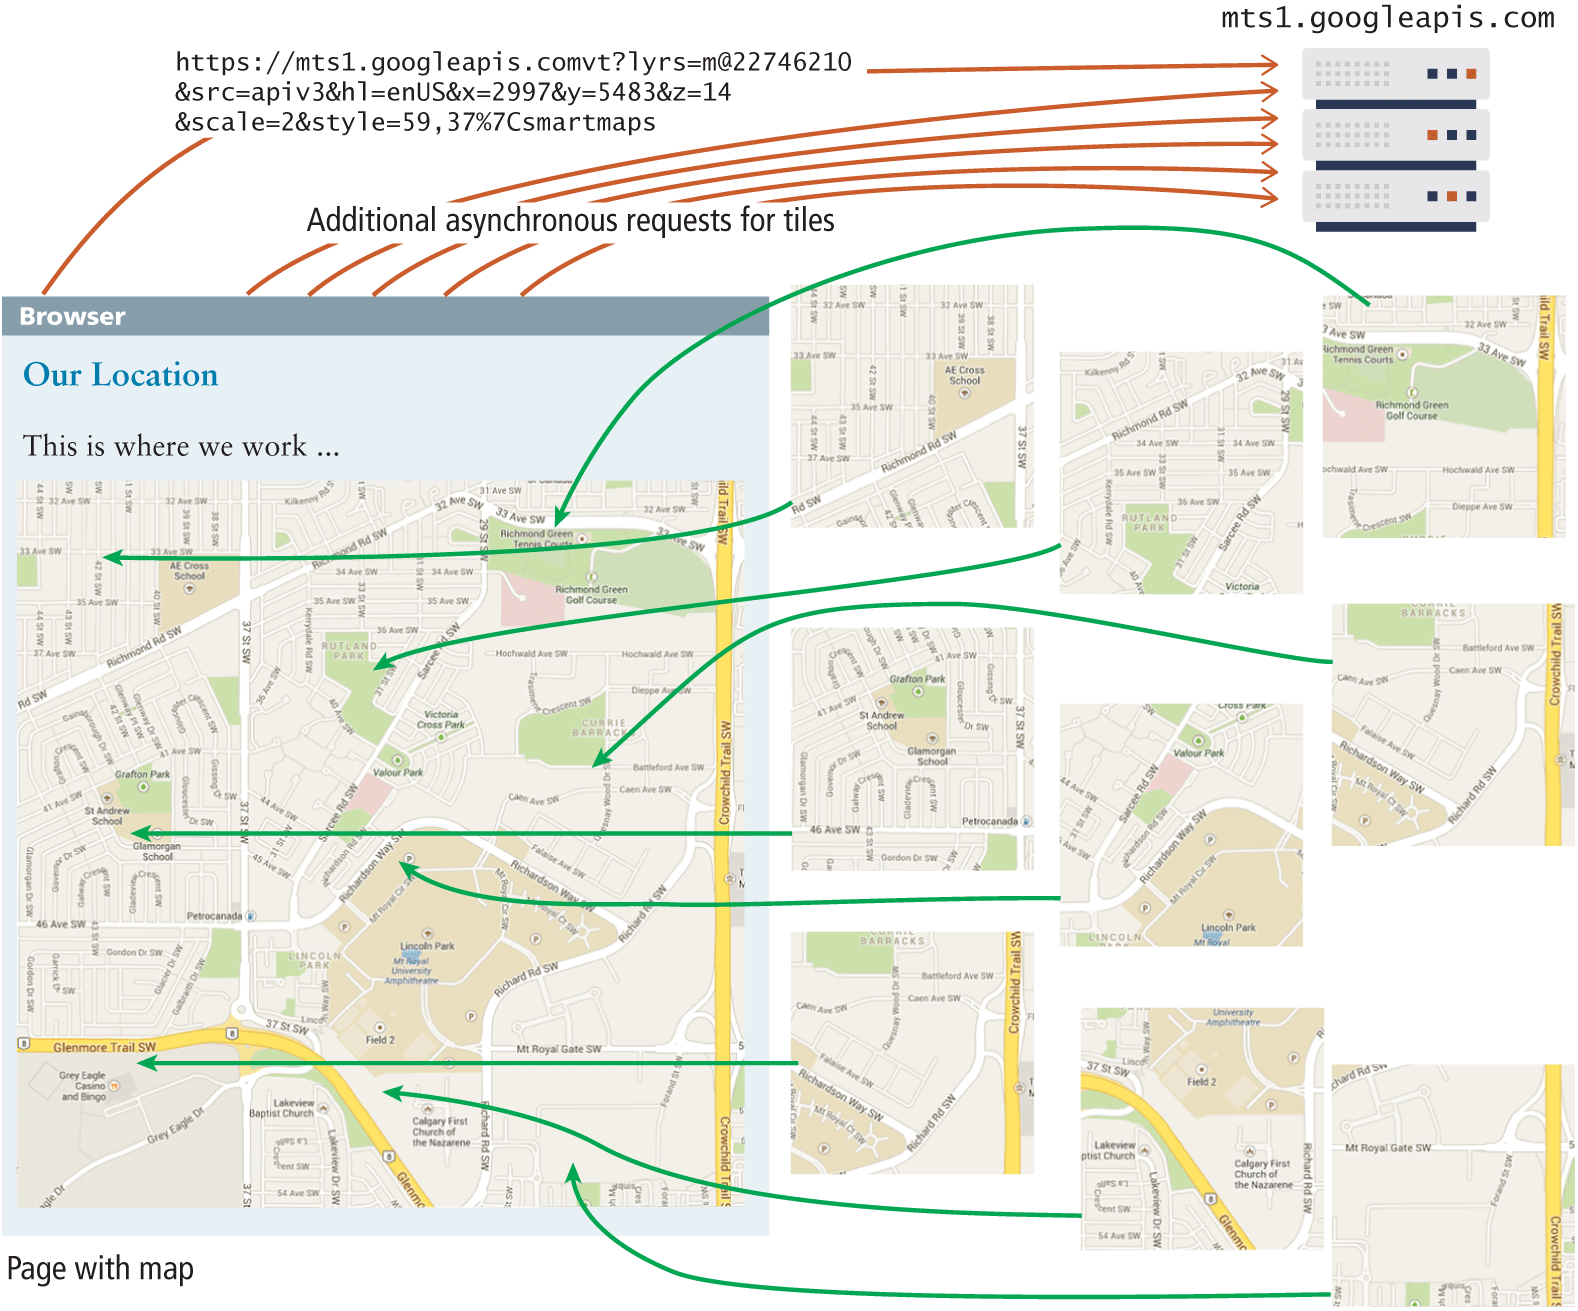
So what is happening behind the scenes with this code? What appears to be a continuous map is actually a series of image tiles that are fetched asynchronously by the API based on page events (for example, page load or mouse drag events), as shown in Figure 10.24.
The nearby Extended Example illustrates a more involved usage of Google Maps. Unlike the example in Listing 10.14, which displays the map automatically after loading via the callback query string, the extended example displays the map synchronously in response to user interaction.
Figure 10.24 Google Maps at work
10.5.2 Charting with Plotly.js
Charting is a common need for many websites. Not surprisingly, there are many external APIs that handle charting. For commercial sites that can afford the license, Highcharts is a popular choice. Plotly and c3.js are popular alternatives that are built on top of the very popular D3.js visualization library. This section makes use of Plotly, which is open-source and available in a variety of other languages besides JavaScript.
Creating a simple chart is quite straightforward. Simply include the library, add an empty <div> element that will contain the chart, and then make use of the newPlot() method, as shown in the following:
<script>
window.addEventListener("load", function() {
const data = [
{ x: [4,5,6,7,8,9,10,11],
y: [23,25,13,15,10,13,17,20]
}
];
const layout = { title:'Simple Line Chart' };
const options = { responsive: true };
Plotly.newPlot("chartDiv", data, layout, options);
});
</script>
<script src="https:/
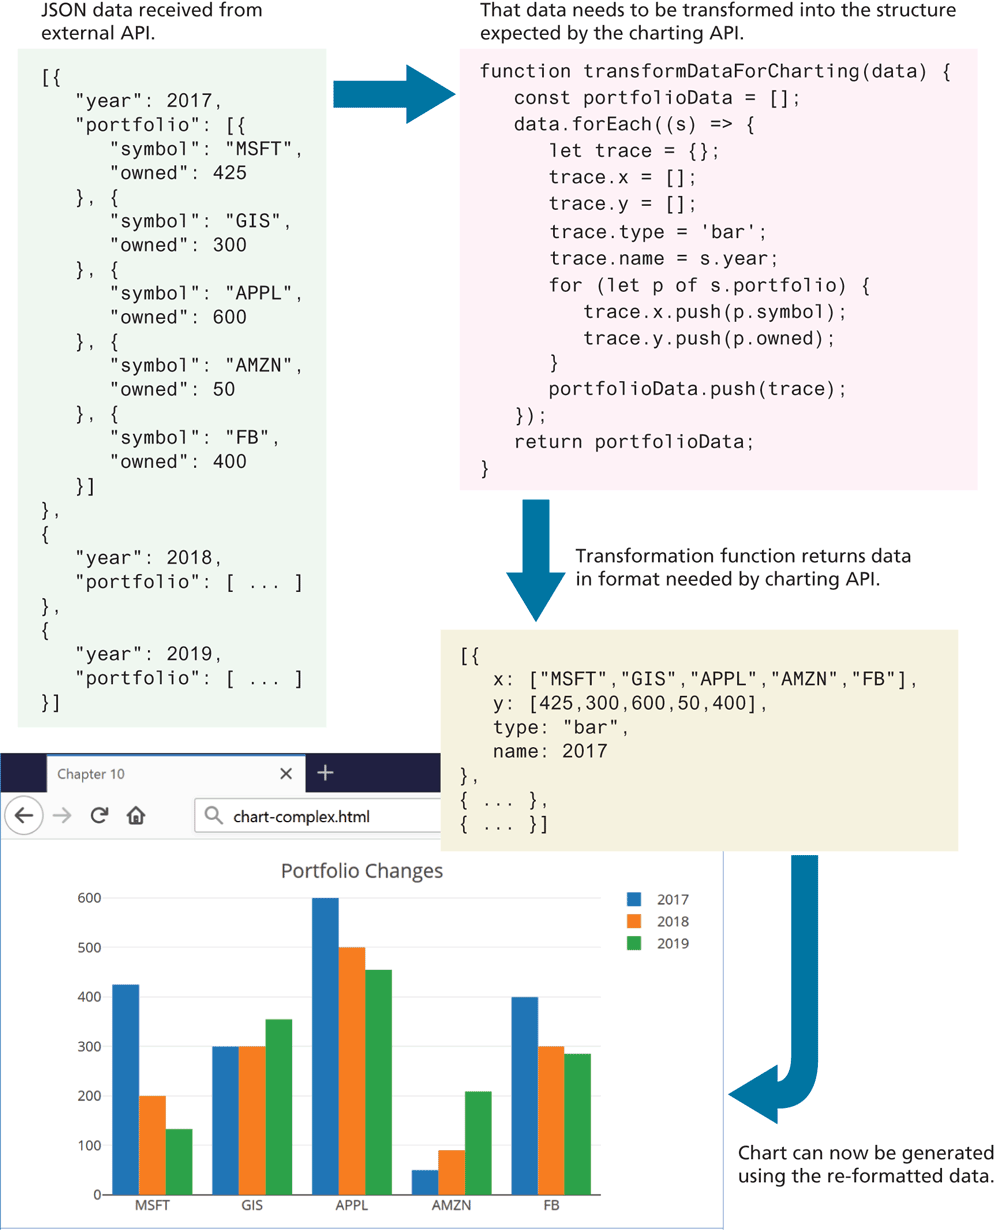
This will display a simple line chart. Listing 10.15 (see also explanation in Figure 10.26) demonstrates a more complex chart example that fetches data from an external service, and then transforms the data into a format expected by the API. This is quite typical: most APIs expect data to be in its own format and style, but the data you have is likely not structured in the required manner, so a transformation step is required.
Listing 10.15 Displaying a chart
window.addEventListener("load", async () => {
   const url = 'https://www.randyconnolly.com/funwebdev/3rd/api/stocks/sample-portfolio.json';
    try {
        let data = await fetch(url)
                   .then(async response => await response.json() );
        generateChart( transformDataForCharting(data) );
    }
    catch (err) { console.error(err) }
   /* transform data received from service into format needed for charting */
   function transformDataForCharting(data) {
      const portfolioData = [];
      data.forEach((s) => {
         let trace = {};
         trace.x = [];
         trace.y = [];
         trace.type = 'bar';
         trace.name = s.year;
         for (let p of s.portfolio) {
            trace.x.push(p.symbol);
            trace.y.push(p.owned);
         }
         portfolioData.push(trace);
      });
      return portfolioData;
   }

   /* generate the chart */
   function generateChart(portfolioData) {
      const layout = {
         title: 'Portfolio Changes',
         barmode: 'group'
      };
      const options = {
         responsive: true
      };
      Plotly.newPlot("chartDiv", portfolioData, layout, options);
   }
});
Figure 10.26 Transforming data for the chart