Long description
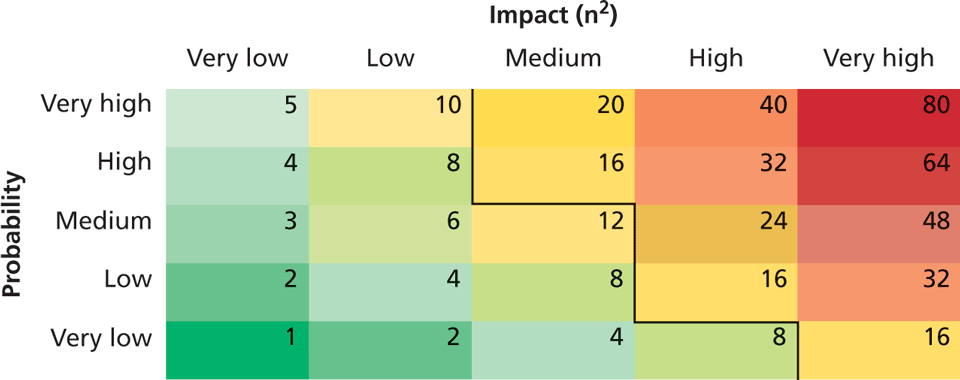
The table shows a relationship between Probability and Impact open parenthesis n squared close parenthesis. It weighs impact on the x scale and probability on the y scale. The table consists of five rows and five columns. The row headings are labeled Very high, High, Medium, Low, and Very low. The column headings are labeled Very low, Low, Medium, High, and Very high. The table values are shown as follows: Very high row, Very low column: 5. Very high row, Low column: 10. Very high row, Medium column: 20. Very high row, High column: 40. Very high row, Very high column: 80.
High row, Very low column: 4. High row, Low column: 8. High row, Medium column: 16. High row, High column: 32. High, Very high column: 64.
Medium row, Very low column: 3. High row, Medium column: 6. Medium row, Medium column: 12. Medium row, High column: 24. Medium, Very high column: 48.
Low row, Very low column: 2. Low row, Medium column: 4. Low row, Medium column: 8. Low row, High column: 16. Low, Very high column: 32.
Very low row, Very low column: 1. Very low row, Medium column: 2. Very low row, Medium column: 4. Low row, Very low column: 8. Very low, Very high column: 16.
The area with the lowest Probability and Impact is colored green. The area with highest Probability and Impact is colored red.
Back