Long description
Back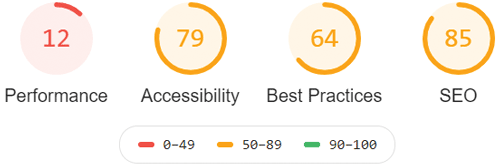
Four progress circles are shown for the following: Performance, accessibility, Best practices, S E O. In case of Performance the progress circle fills up 12 percentage. In case of Accessibility the progress circle fills up 79 percentage. In case of Best practices the progress circle fills up 64 percentage. In case of S E O the progress circle fills up 85 percentage. Below this the ranges corresponding to each shade is given. These are given as follows: Red: 0 to 49, yellow: 50- 89, Green- 90 to 100.
Back