Long description
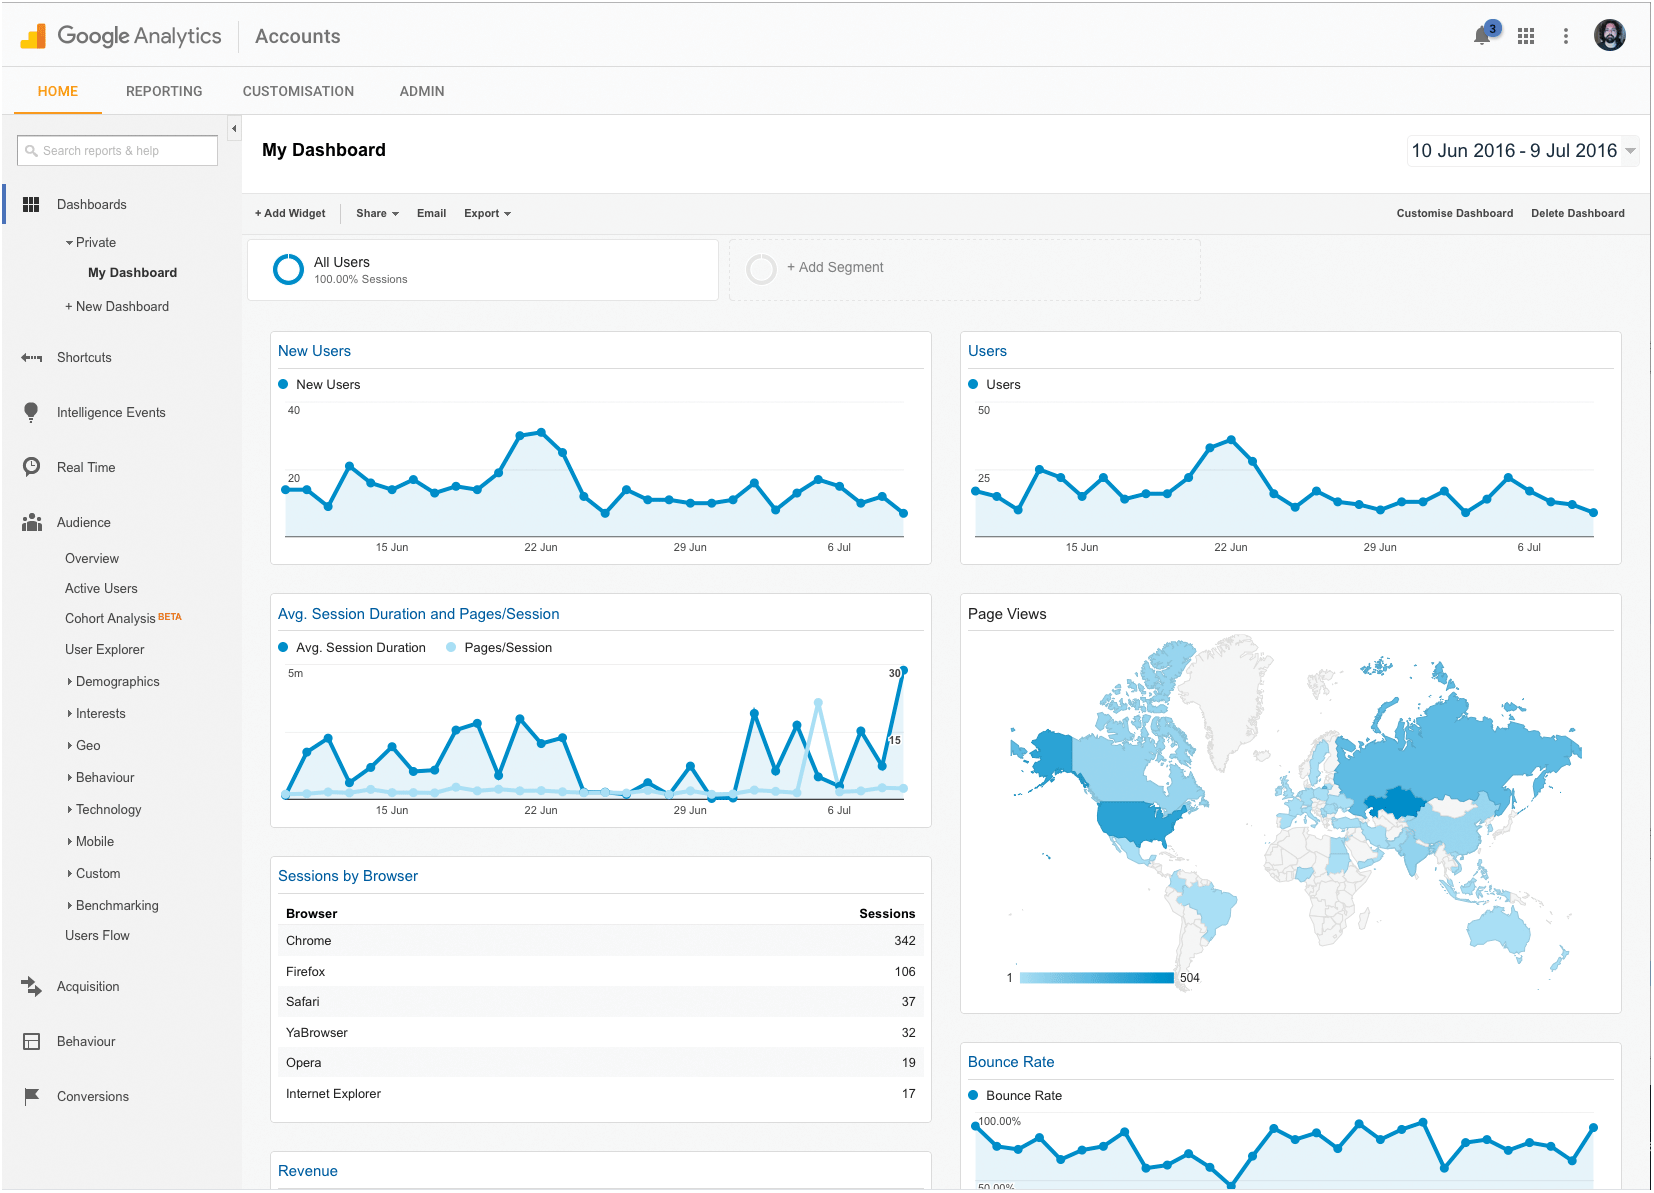
The following options are given on top of the dashboard: Home, Reporting, Customization, and Admin. On the sidebar of the dashboard, the following are included: Dashboards, private, My dashboard, New dashboard, shortcuts, Intelligence events, Real time, Audience, overview, Active users, cohort Analysis, User Explorer, Demographics, Interests, G E O, Behavior, Technology, Mobile, Custom, Benchmarking, Users flow, Acquisition, Behavior and conversions. The continuous time graph plots for the following are shown here: new users, users and Any session duration and page/session. The page views are represented next. A progress bar shown below indicates that the light blue shade denotes less number of page views and the dark blue denotes the higher page views. The bounce rate is graphically represented below this. At last the sessions by browser is shown. For the browser: Chrome, Firefox, safari, yaBrowser, Opera, Internet Explorer. The sessions corresponding to these are as follows: 342, 106, 37, 32, 19, and 17.
Back