Long description
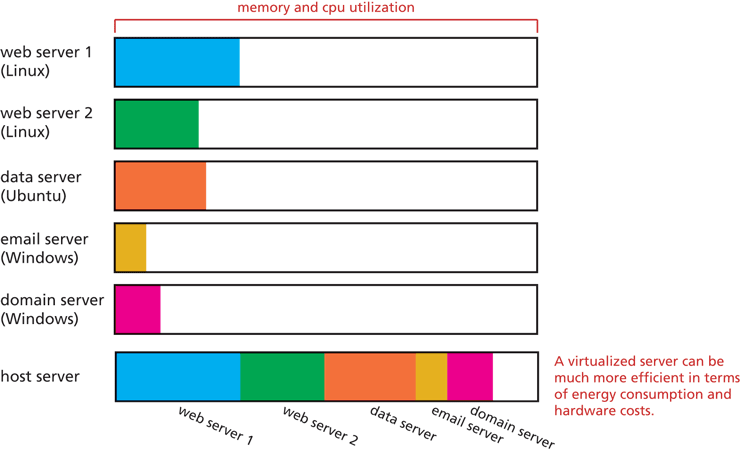
The memory and c p u utilization of of each server is shown by progress bars. The bar fills up according to the percentage of memory and c p u utilization. The progress bar corresponding to the web server 1 (Linux), fills up 30 percentage in blue shade. The progress bar corresponding to the web server 2 (Linux), fills up 20 percentage in green shade. The progress bar corresponding to the data server (Ubuntu), fills up 25 percentage in saffron shade.The progress bar corresponding to the email server (windows), fills up 10 percentage in yellow shade. The progress bar corresponding to the domain server (windows), fills up 15 percentage in pink shade. And the progress bar corresponding to the host server, fills up 30 percentage in blue shade, 20 percentage in green shade, 25 percentage in saffron shade, 10 percentage in yellow shade and 15 percentage in pink shade. Each of these progressing sections are labeled accordingly as Web server 1, web server 2, data server, email server and domain server. On the right of this progress bar it is labeled as follows: A virtualized server can be much more efficient in terms of energy consumption and hardware costs.
Back