Long description
Back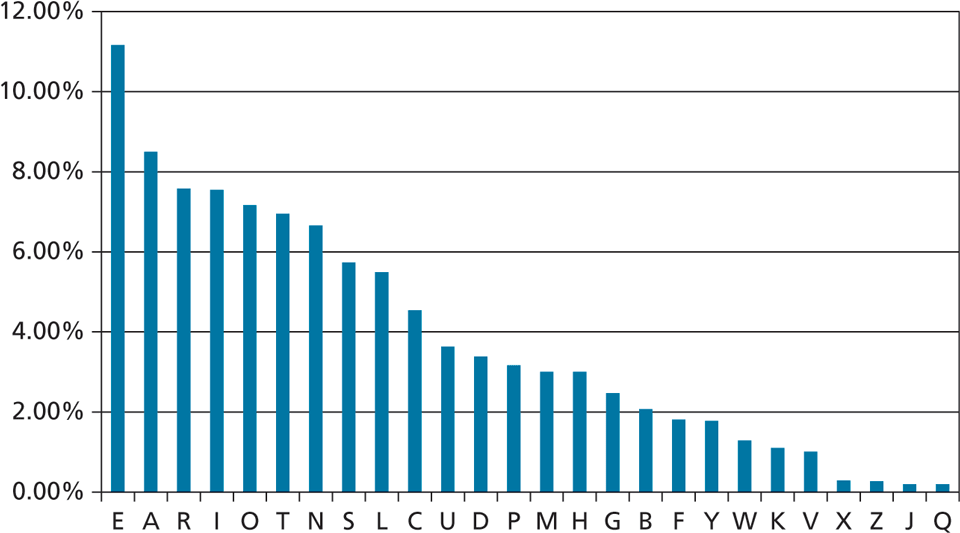
The figure shows a Bar chart, where the horizontal axis has the markings E, “A”, R, I, O, T, N, S, L, C, U, D, P, M, H, G, B, F, Y, W, K, V, X, Z, J, and Q. The vertical axis ranges from 0 percent to 12 percent in increments of 2 percent. The letter frequency is shown to be the highest at E, which gradually reduces as the range of letters moves to Q.
Back