Long description
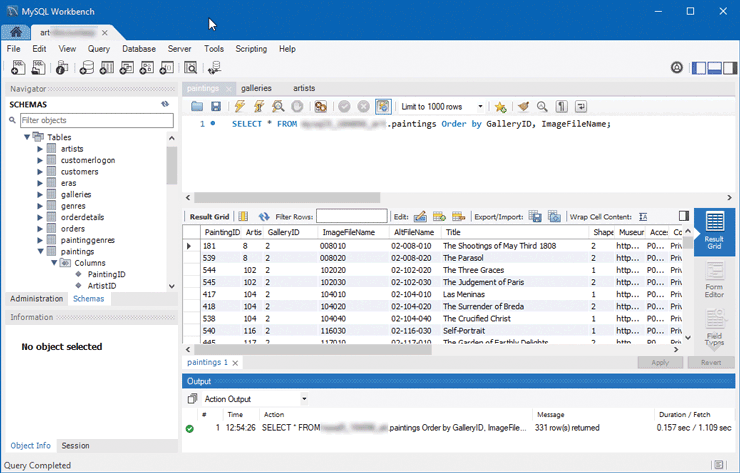
The figure consists of a browser window that shows the My S Q L workbench window. A menu toolbar is at the top of the window. The rest of the window is divided into 5 sections. Two sections that are vertically oriented are placed one below the other on the left. The first section titled SCHEMAS shows a list of tables and the columns in it. The second section below it shows the Object info related to the selected table. The third, fourth, and fifth sections are oriented horizontally and placed one below the other. The third section shows an S Q L statement. The fourth section shows the resulting grid of the S Q L statement in the third section. The fifth section shows an Action Output window that contains information about the time at which the S Q L statement was executed, the Action details, which is the S Q L statement that was executed, Message details, which shows the number of rows in the grid returned by the execution of the S Q L statements, and The Duration or Fetch details, which is the time taken to execute the S Q L statement.
Back