Long description
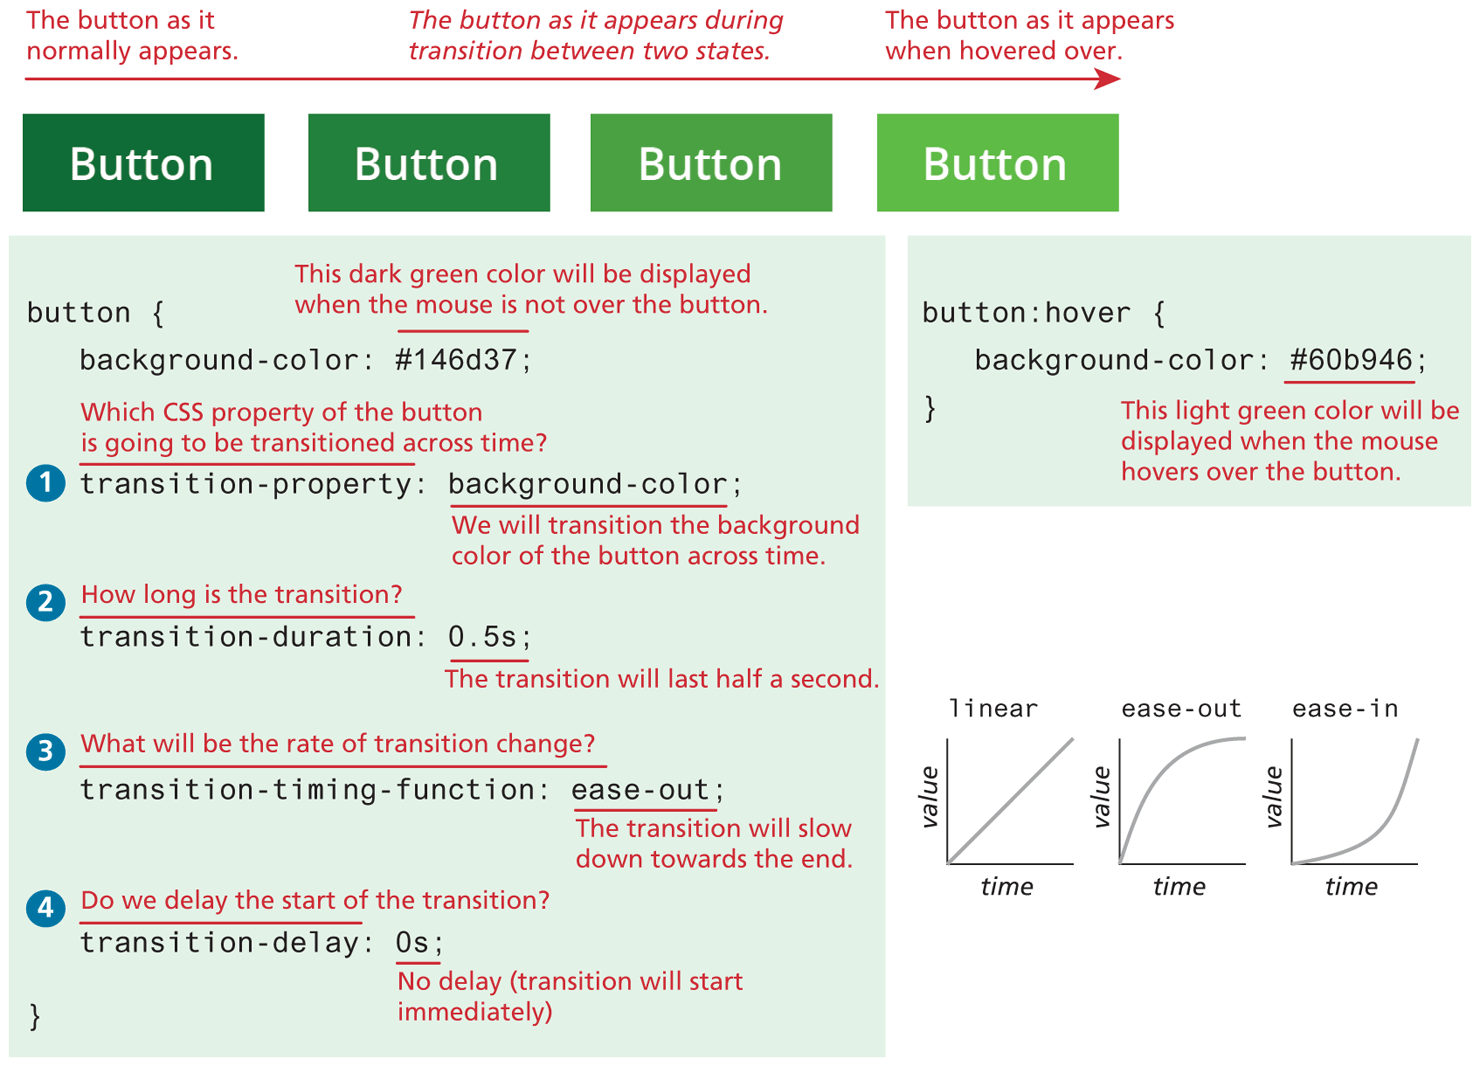
Four rectangles labeled Button are at the top of the figure. The buttons are colored in shades of green, where the intensity of the color decreases from the leftmost rectangle to the rightmost rectangle. An arrow points from the top of the leftmost rectangle to the rightmost rectangle. Note: Button as it normally appears is written at the top of the arrow, above the first button. Note: The button as it appears during transition between two states is written at the top of the arrow, above the second and third button. Note: The button as it appears when hovered over is written at the top of the arrow, above the fourth button. The sets of C S S codes for the buttons are written below.
Set 1 has six lines of codes and four questions with their responses. Line 1: button open curly brace. Line 2: background hyphen color colon hashtag 146d37 semicolon. Note: This dark green color will be displayed when the mouse is not over the button is written above hashtag 146d37. Question 1: Which CSS property of the button is going to be transitioned across time? Line 3: transition hyphen property colon background hyphen color semicolon. Response 1: We will transition the background color of the button across time. Question 2: How long is the transition? Line 4: transition hyphen duration colon 0.5 s semicolon. Response 2: The transition will last half a second. Question 3: What will be the rate of transition change? Line 5: transition hyphen timing hyphen function colon ease-out semicolon. Response 3: The transition will slow down toward the end. Question 4: Do we delay the start of the transition? Line 6: transition hyphen delay colon 0 s semicolon. Response 4: No delay (transition will start immediately). Line 7: Close curly brace.
Set 2 has three lines of code placed at the right of set 1. Line 1: button colon hover open curly brace. Line 2: background hyphen color colon hashtag 60b946 semicolon. Line 3: Close curly brace. Note: This light green color will be displayed when the mouse hovers over the button is written below hashtag 60b946. Three graphs of value versus time are placed below set 2. Graph 1 labeled linear has a straight line that starts from the origin of the axes that moves linearly toward the top right. Graph 2 labeled ease-out has a curve that starts from the origin of the axes, moves toward the top right, bends to the right, and exits the viewing window at the right. Graph 3 labeled ease-in has a curve that starts from the origin of the axes, moves slightly to the top right, bends to the left, moves toward the top right, and exits the viewing window at the top right.
Back