Long description
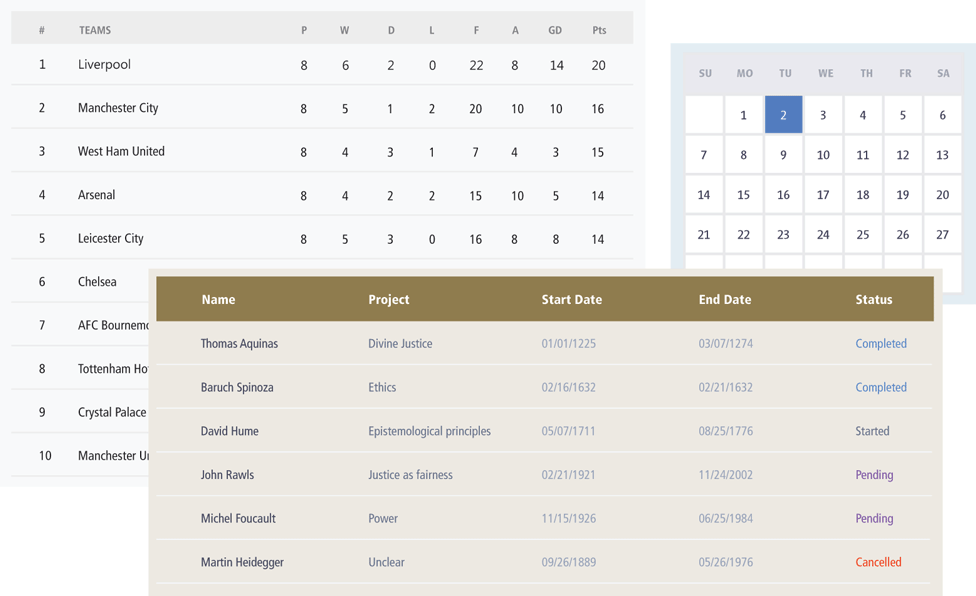
Table 1: This shows 10 rows of data with 10 columns with the column names: hash, TEAMS, P, W, D, L , F, “A”, G D, and P t s. The hash column shows numbers from 1 to 10. The TEAMS column shows a list of teams in football. The rest of the columns show numerical data.
Table 2: This table appears to the right side of Table 1 and shows the data in a calendar. The table shows 5 rows and 7 columns of data that appear in cells of the same size. The column names read as follows: S U, M O, T U, W E, T H, F R, and S “A”. Row 1, S U shows a blank cell and the rest of the cells show numbers in the ascending order. The cell in row 1, T U is highlighted indicating the date of the present day.
Table 3: This Table appears below Table 1 and Table 2 but overlaps both the tables. The table consists of 6 rows and 5 columns. The column names read as follows: Name, Project, Start Date, End Date, and Status. The column names have a solid brown colored background and the rest of the table has a solid beige colored background. The Name column shows different names of people. The Project column shows different project names. The Start Date and End Date columns show different dates in the format: month forward slash day forward slash year. The Status column have either of the values: Completed, Started, Pending, or Canceled. The data in the Status column are highlighted in different colors.
Back