21 Observability
A distributed system is never 100% healthy at any given time as there can always be something failing. A whole range of failure modes can be tolerated, thanks to relaxed consistency models and resiliency mechanisms like rate limiting, retries, and circuit breakers. Unfortunately, they also increase the system’s complexity. And with more complexity, it becomes increasingly harder to reason about the multitude of emergent behaviours the system might experience.
As we have discussed, human operators are still a fundamental part of operating a service as there are things that can’t be automated, like mitigating an incident. Debugging is another example of such a task. When a system is designed to tolerate some level of degradation and self-heal, it’s not necessary or possible to monitor every way it can get into an unhealthy state. You still need tooling and instrumentation to debug complex emergent failures because they are impossible to predict up-front.
When debugging, the operator makes an hypothesis and tries to validate it. For example, the operator might get suspicious after noticing that the variance of her service’s response time has increased slowly but steadily over the past weeks, indicating that some requests take much longer than others. After correlating the increase in variance with an increase in traffic, the operator hypothesizes that the service is getting closer to hitting a constraint, like a limit or a resource contention. Metrics and charts alone won’t help to validate this hypothesis.
Observability is a set of tools that provide granular insights into a system in production, allowing us to understand its emergent behaviours. A good observability platform strives to minimize the time it takes to validate hypotheses. This requires granular events with rich contexts, since it’s not possible to know up-front what’s going to be useful in the future.
At the core of observability, we find telemetry sources like metrics, event logs, and traces. Metrics are stored in time-series data stores that have high throughput, but struggle to deal with metrics that have many dimensions. Conversely, event logs and traces end up in transactional stores that can handle high-dimensional data well, but struggle with high throughput. Metrics are mainly used for monitoring, while event logs and traces mainly for debugging.
Observability is a superset of monitoring. While monitoring is focused exclusively on tracking the health of a system, observability also provides tools to understand and debug it. Monitoring on its own is good at detecting failure symptoms, but less so to explain their root cause (see Figure 21.1).
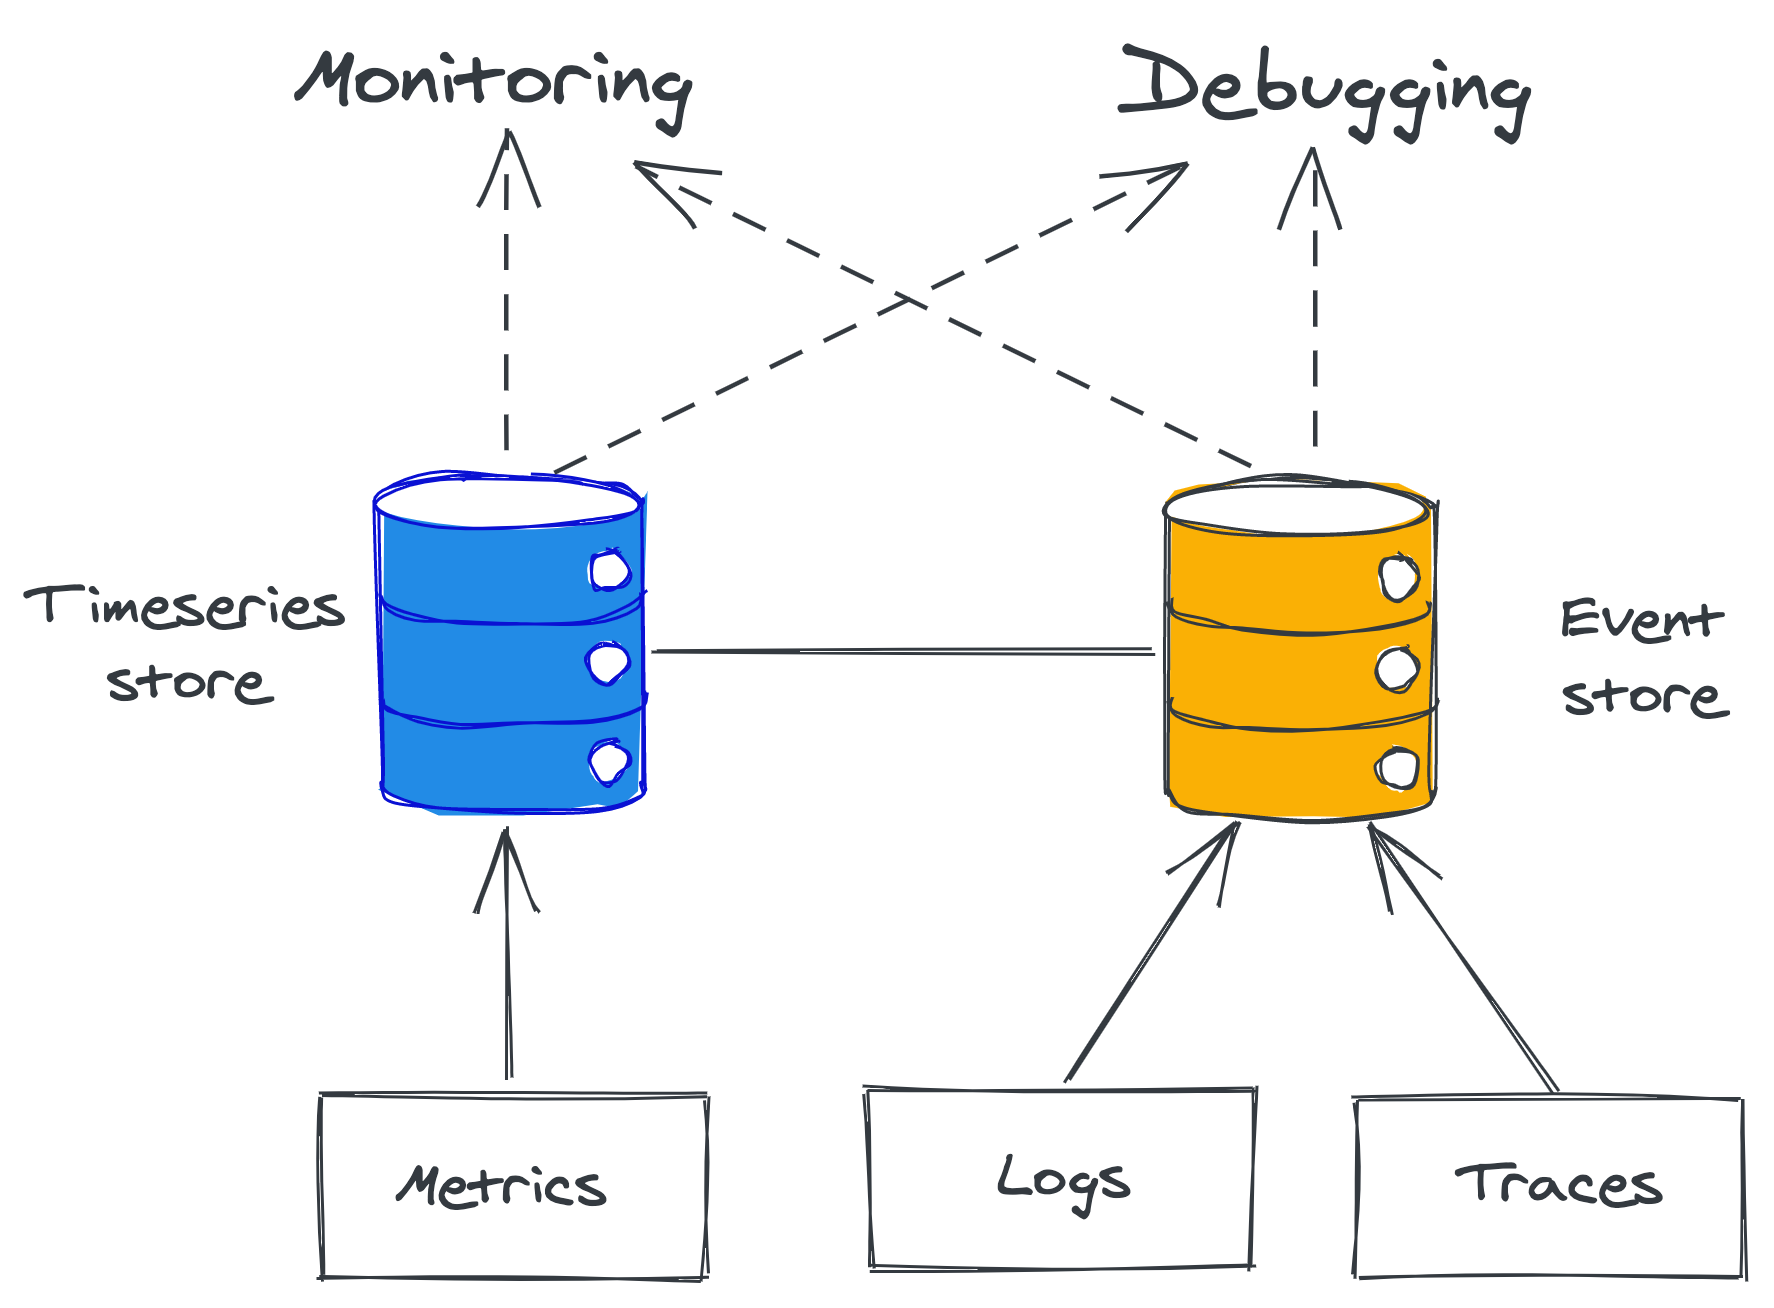
Figure 21.1: Observability is a superset of monitoring.
21.1 Logs
A log is an immutable list of time-stamped events that happened over time. An event can have different formats. In its simplest form, it’s just free-form text. It can also be structured and represented with a textual format like JSON, or a binary one like Protobuf. When structured, an event is typically represented with a bag of key-value pairs:
{
  "failureCount": 1,
  "serviceRegion": "EastUs2",
  "timestamp": 1614438079
}
Logs can originate from your services and external dependencies, like message brokers, proxies, databases, etc. Most languages offer libraries that make it easy to emit structured logs. Logs are typically dumped to disk files, which are rotated every so often, and forwarded by an agent to an external log collector asynchronously, like an ELK stack or AWS CloudWatch logs.
Logs provide a wealth of information about everything that’s happening in a service. They are particularly helpful for debugging purposes, as they allow us to trace back the root cause from a symptom, like a service instance crash. They also help to investigate long-tail behaviors that are missed by metrics represented with averages and percentiles, which can’t help explain why a specific user request is failing.
Logs are very simple to emit, particularly free-form textual ones. But that’s pretty much the only advantage they have compared to metrics and other instrumentation tools. Logging libraries can add overhead to your services if misused, especially when they are not asynchronous and logging blocks while writing to stdout or disk. Also, if the disk fills up due to excessive logging, the service instance might get itself into a degraded state. At best, you lose logging, and at worst, the service instance stops working if it requires disk access to handle requests.
Ingesting, processing, and storing a massive trove of data is not cheap either, no matter whether you plan to do this in-house or use a third-party service. Although structured binary logs are more efficient than textual ones, they are still expensive due to their high dimensionality.
Finally, but not less important, logs have a high noise to signal ratio because they are fine-grained and service-specific, which makes it challenging to extract useful information from them.
Best Practices
To make the job of the engineer drilling into the logs less painful, all the data about a specific work unit should be stored in a single event. A work unit typically corresponds to a request or a message pulled from a queue. To effectively implement this pattern, code paths handling work units need to pass around a context object containing the event being built.
An event should contain useful information about the work unit, like who created it, what it was for, and whether it succeeded or failed. It should include measurements as well, like how long specific operations took. Every network call performed within the work unit needs to be instrumented to log its response status code and response time. Finally, data logged to the event should be sanitized and stripped of potentially sensitive properties that developers shouldn’t have access to, like user content.
Collating all data within a single event for a work unit minimizes the need for joins but doesn’t completely eliminate it. For example, if a service calls another downstream, you will have to perform a join to correlate the caller’s event log with the callee’s one to understand why the remote call failed. To make that possible, every event should include the id of the request or message for the work unit.
Costs
There are various ways to keep the costs of logging under control. A simple approach is to have different logging levels (e.g.: debug, info, warning, error) controlled by a dynamic knob that determines which ones are emitted. This allows operators to increase the logging verbosity for investigation purposes and reduce costs when granular logs aren’t needed.
Sampling is another option to reduce verbosity. For example, a service could log only one every n-th event. Additionally, events can also be prioritized based on their expected signal to noise ratio; for example, logging failed requests should have a higher sampling frequency than logging successful ones.
The options discussed so far only reduce the logging verbosity on a single node. As you scale out and add more nodes, logging volume will necessarily increase. Even with the best intentions, someone could check-in a bug that leads to excessive logging. To avoid costs soaring through the roof or killing your logging pipeline entirely, log collectors need to be able to rate-limit requests. If you use a third-party service to ingest, store, and query your logs, there probably is a quota in place already.
Of course, you can always opt to create in-memory aggregates from the measurements collected in events (e.g., metrics) and emit just those rather than raw logs. By doing so, you trade-off the ability to drill down into the aggregates if needed.
21.2 Traces
Tracing captures the entire lifespan of a request as it propagates throughout the services of a distributed system. A trace is a list of causally-related spans that represent the execution flow of a request in a system. A span represent an interval of time that maps to a logical operation or work unit, and contains a bag of key-value pairs (see Figure 21.2).
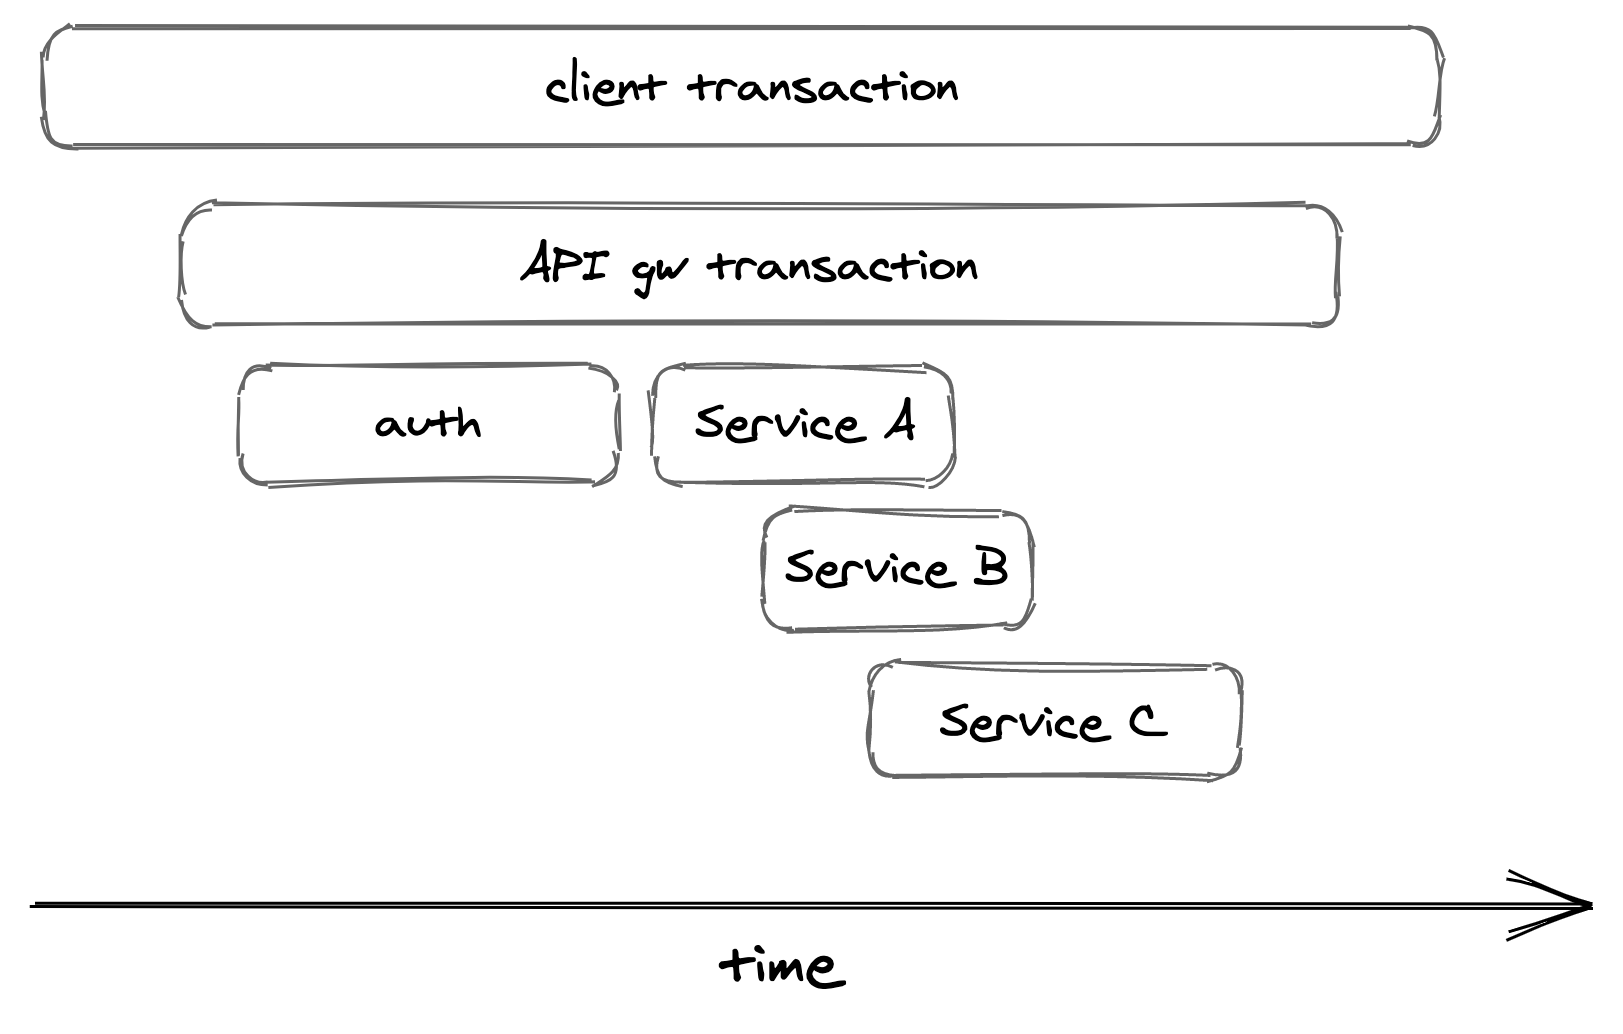
Figure 21.2: An execution flow can be represented with spans.
Traces allow developers to:
- debug issues affecting very specific requests, which can be used to investigate support requests;
- debug rare issues that affect only an extremely small fraction of requests;
- debug issues that affect a large fraction of requests, like high response times for requests that hit a specific subset of service instances;
- Identify bottlenecks in the end-to-end request path;
- Identify which clients hit which downstream services and in what proportion (also referred to as resource attribution), which can be used for rate-limiting or billing purposes.
When a request begins, it’s assigned a unique trace id. The trace id is propagated from one stage to another at every fork in the local execution flow from one thread to another and from caller to callee in a network call (through HTTP headers, for example). Each stage is represented with a span — an event containing the trace id.
When a span ends, it’s emitted to a collector service, which assembles it into a trace by stitching it together with the other spans belonging to the same trace. Popular distributed tracing collectors include Open Zipkin and AWS X-ray.
Tracing is challenging to retrofit into an existing system as it requires every component in the request path to be modified and propagate the trace context from one stage to the other. And it’s not just the components that are under your control that need to support tracing; the frameworks and open source libraries you use need to support it as well, just like third-party services1.
21.3 Putting it all together
The main drawback of event logs is that they are fine-grained and service-specific.
When a single user request flows through a system, it can pass through several services. A specific event only contains information for the work unit of one specific service, so it can’t be of much use to debug the entire request flow. Similarly, a single event doesn’t tell much about the health or state of a specific service.
This is where metrics and traces come in. You can think of them as abstractions, or derived views, built from event logs and tuned to specific use cases. A metric is a time-series of summary statistics derived by aggregating counters or observations over multiple work units or events. You could emit counters in events and have the backend roll them up into metrics as they are ingested. In fact, this is how some metrics collection systems work.
Similarly, a trace can be derived by aggregating all events belonging to the lifecycle of a specific user request into an ordered list. Just like in the previous case, you can emit individual span events and have the backend aggregate them together into traces.