17 Upstream resiliency
So far, we have discussed patterns that protect against downstream failures, like failures to reach an external dependency. In this chapter, we will shift gears and discuss mechanisms to protect against upstream pressure.
17.1 Load shedding
A server has very little control over how many requests it receives at any given time, which can deeply impact its performance.
The operating system has a connection queue per port with a limited capacity that, when reached, causes new connection attempts to be rejected immediately. But typically, under extreme load, the server crawls to a halt before that limit is reached as it starves out of resources like memory, threads, sockets, or files. This causes the response time to increase to the point the server becomes unavailable to the outside world.
When a server operates at capacity, there is no good reason for it to keep accepting new requests since that will only end up degrading it. In that case, the process should start rejecting excess requests so that it can focus on the ones it is already processing.
The definition of overload depends on your system, but the general idea is that it should be measurable and actionable. For example, the number of concurrent requests being processed is a good candidate to measure a server’s load; all you have to do is to increment a counter when a new request comes in and decrease it when the server has processed it and sent back a response to the client.
When the server detects that it’s overloaded, it can reject incoming requests by failing fast and returning a 503 (Service Unavailable) status code in the response. This technique is also referred to as load shedding. The server doesn’t necessarily have to reject arbitrary requests though; for example, if different requests have different priorities, the server could reject only the lower-priority ones.
Unfortunately, rejecting a request doesn’t completely offload from the server the cost of handling it. Depending on how the rejection is implemented, the server might still have to pay the price of opening a TLS connection and read the request just to finally reject it. Hence, load shedding can only help so much, and if the load keeps increasing, eventually, the cost of rejecting requests takes over, and the service starts to degrade.
17.2 Load leveling
Load leveling is an alternative to load shedding, which can be used when clients don’t expect a response within a short time frame.
The idea is to introduce a messaging channel between the clients and the service. The channel decouples the load directed to the service from its capacity, allowing the service to process requests at its own pace — rather than requests being pushed to the service by the clients, they are pulled by the service from the channel. This pattern is referred to as load leveling and it’s well suited to fend off short-lived spikes, which the channel smoothes out (see Figure 17.1).
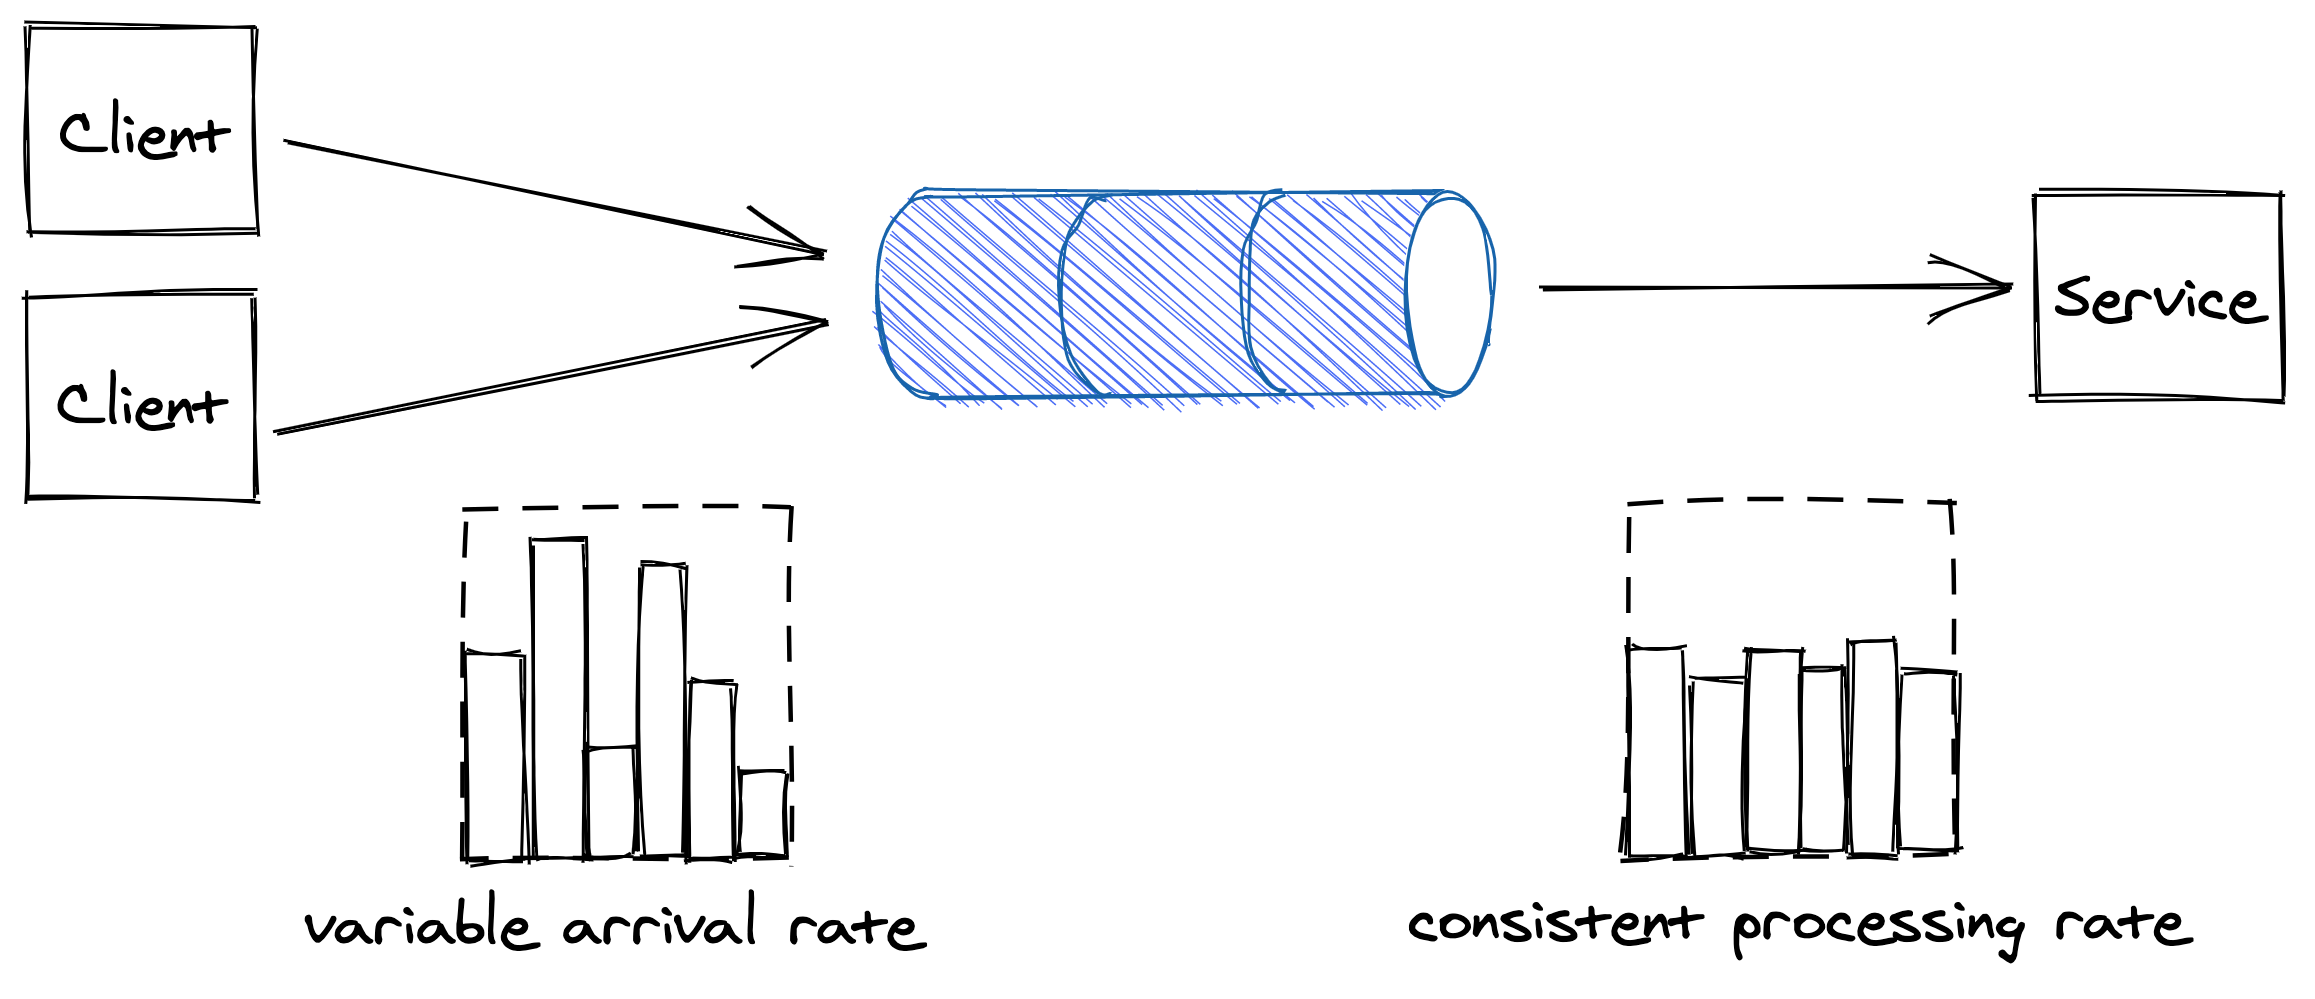
Figure 17.1: The channel smooths out the load for the consuming service.
Load-shedding and load leveling don’t address an increase in load directly, but rather protect a service from getting overloaded. To handle more load, the service needs to be scaled out. This is why these protection mechanisms are typically combined with auto-scaling, which detects that the service is running hot and automatically increases its scale to handle the additional load.
17.3 Rate-limiting
Rate-limiting, or throttling, is a mechanism that rejects a request when a specific quota is exceeded. A service can have multiple quotas, like for the number of requests seen, or the number of bytes received within a time interval. Quotas are typically applied to specific users, API keys, or IP addresses.
For example, if a service with a quota of 10 requests per second, per API key, receives on average 12 requests per second from a specific API key, it will on average, reject 2 requests per second tagged with that API key.
When a service rate-limits a request, it needs to return a response with a particular error code so that the sender knows that it failed because a quota has been breached. For services with HTTP APIs, the most common way to do that is by returning a response with status code 429 (Too Many Requests). The response should include additional details about which quota has been breached and by how much; it can also include a Retry-After header indicating how long to wait before making a new request:
HTTP/1.1 429 Too Many Requests
Retry-After: 60
If the client application plays by the rules, it stops hammering the service for some time, protecting it from non-malicious users monopolizing it by mistake. This protects against bugs in the clients that, for one reason or another, cause a client to repeatedly hit a downstream service for no good reason.
Rate-limiting is also used to enforce pricing tiers; if a user wants to use more resources, they also need to be prepared to pay more. This is how you can offload your service’s cost to your users: have them pay proportionally to their usage and enforce pricing tiers with quotas.
You would think that rate-limiting also offers strong protection against a denial-of-service (DDoS) attack, but it only partially protects a service from it. Nothing forbids throttled clients from continuing to hammer a service after getting 429s. And no, rate-limited requests aren’t free either — for example, to rate-limit a request by API key, the service has to pay the price to open a TLS connection, and to the very least download part of the request to read the key. Although rate-limiting doesn’t fully protect against DDoS attacks, it does help reduce their impact.
Economies of scale are the only true protection against DDoS attacks. If you run multiple services behind one large frontend service, no matter which of the services behind it are attacked, the frontend service will be able to withstand the attack by rejecting the traffic upstream. The beauty of this approach is that the cost of running the frontend service is amortized across all the services that are using it.
Although rate-limiting has some similarities to load shedding, they are different concepts. Load shedding rejects traffic based on the local state of a process, like the number of requests concurrently processed by it; rate-limiting instead sheds traffic based on the global state of the system, like the total number of requests concurrently processed for a specific API key across all service instances.
17.3.1 Single-process implementation
The implementation of rate-limiting is interesting in its own right, and it’s well worth spending some time studying it, as a similar approach can be applied to other use cases. We will start with single-process implementation first and then proceed with a distributed one.
Suppose we want to enforce a quota of 2 requests per minute, per API key. A naive approach would be to use a doubly-linked list per API key, where each list stores the timestamps of the last N requests received. Every time a new request comes in, an entry is appended to the list with its corresponding timestamp. Then periodically, entries older than a minute are purged from the list.
By keeping track of the list’s length, the process can rate-limits incoming requests by comparing it with the quota. The problem with this approach is that it requires a list per API key, which becomes quickly expensive in terms of memory as it grows with the number of requests received.
To reduce memory consumption, we need to come up with a way to compress the storage required. One way to do this is to divide time into buckets of fixed time duration, for example of 1 minute, and keep track of how many requests have been seen within each bucket (see Figure 17.2).
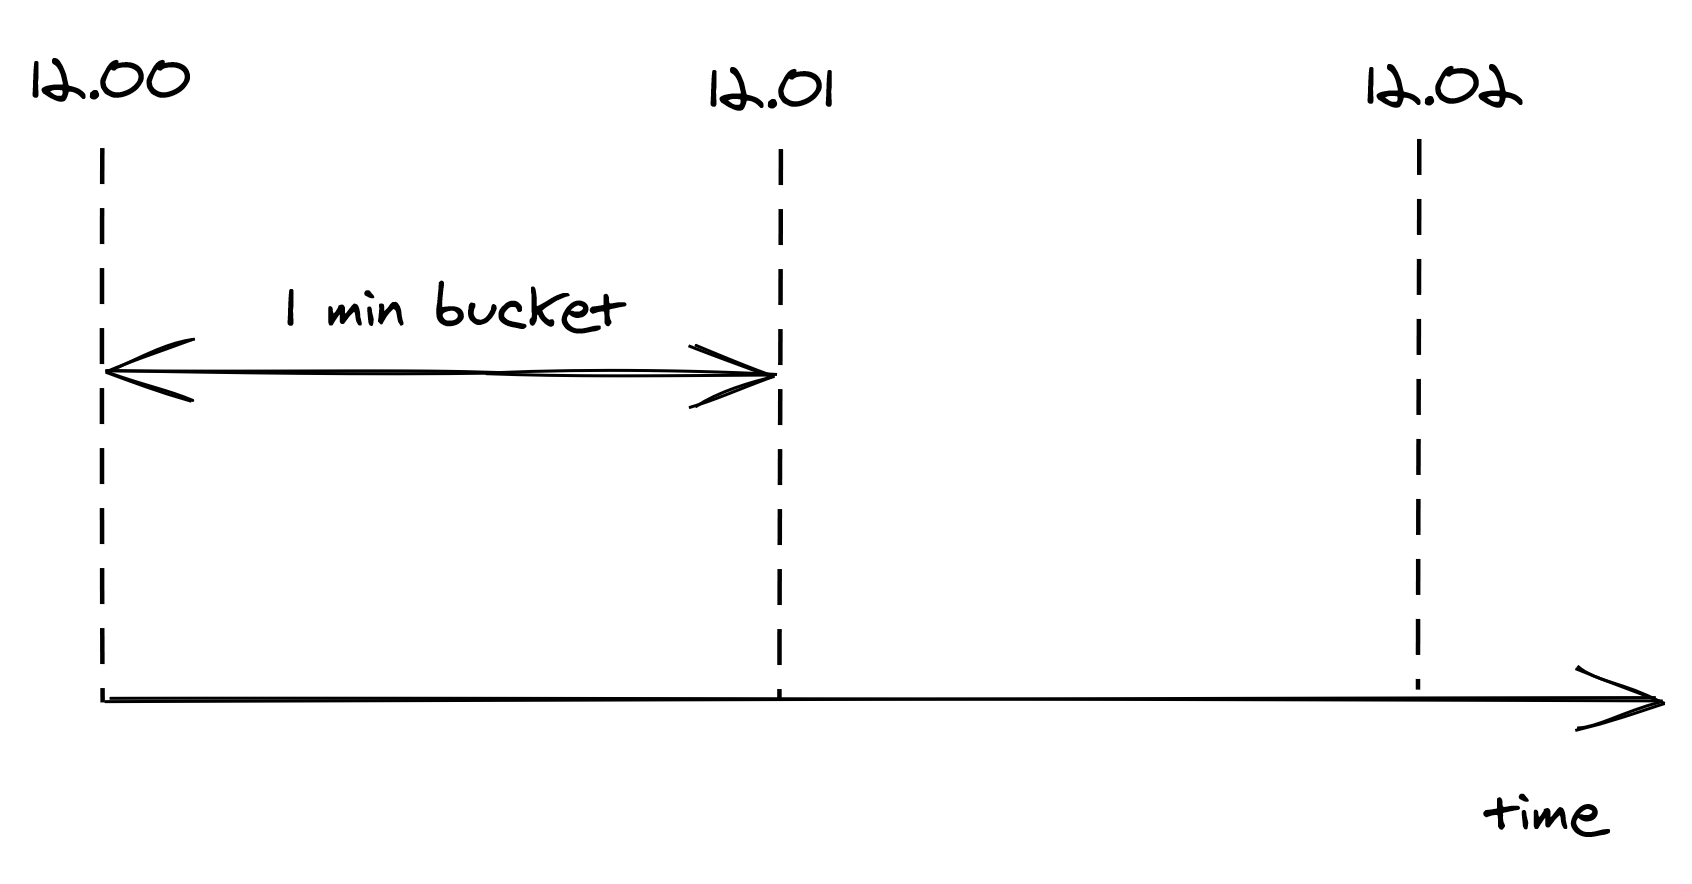
Figure 17.2: Buckets divide time into 1-minute intervals, which keep track of the number of requests seen.
A bucket contains a numerical counter. When a new request comes in, its timestamp is used to determine the bucket it belongs to. For example, if a request arrives at 12.00.18, the counter of the bucket for minute “12.00” is incremented by 1 (see Figure 17.3).
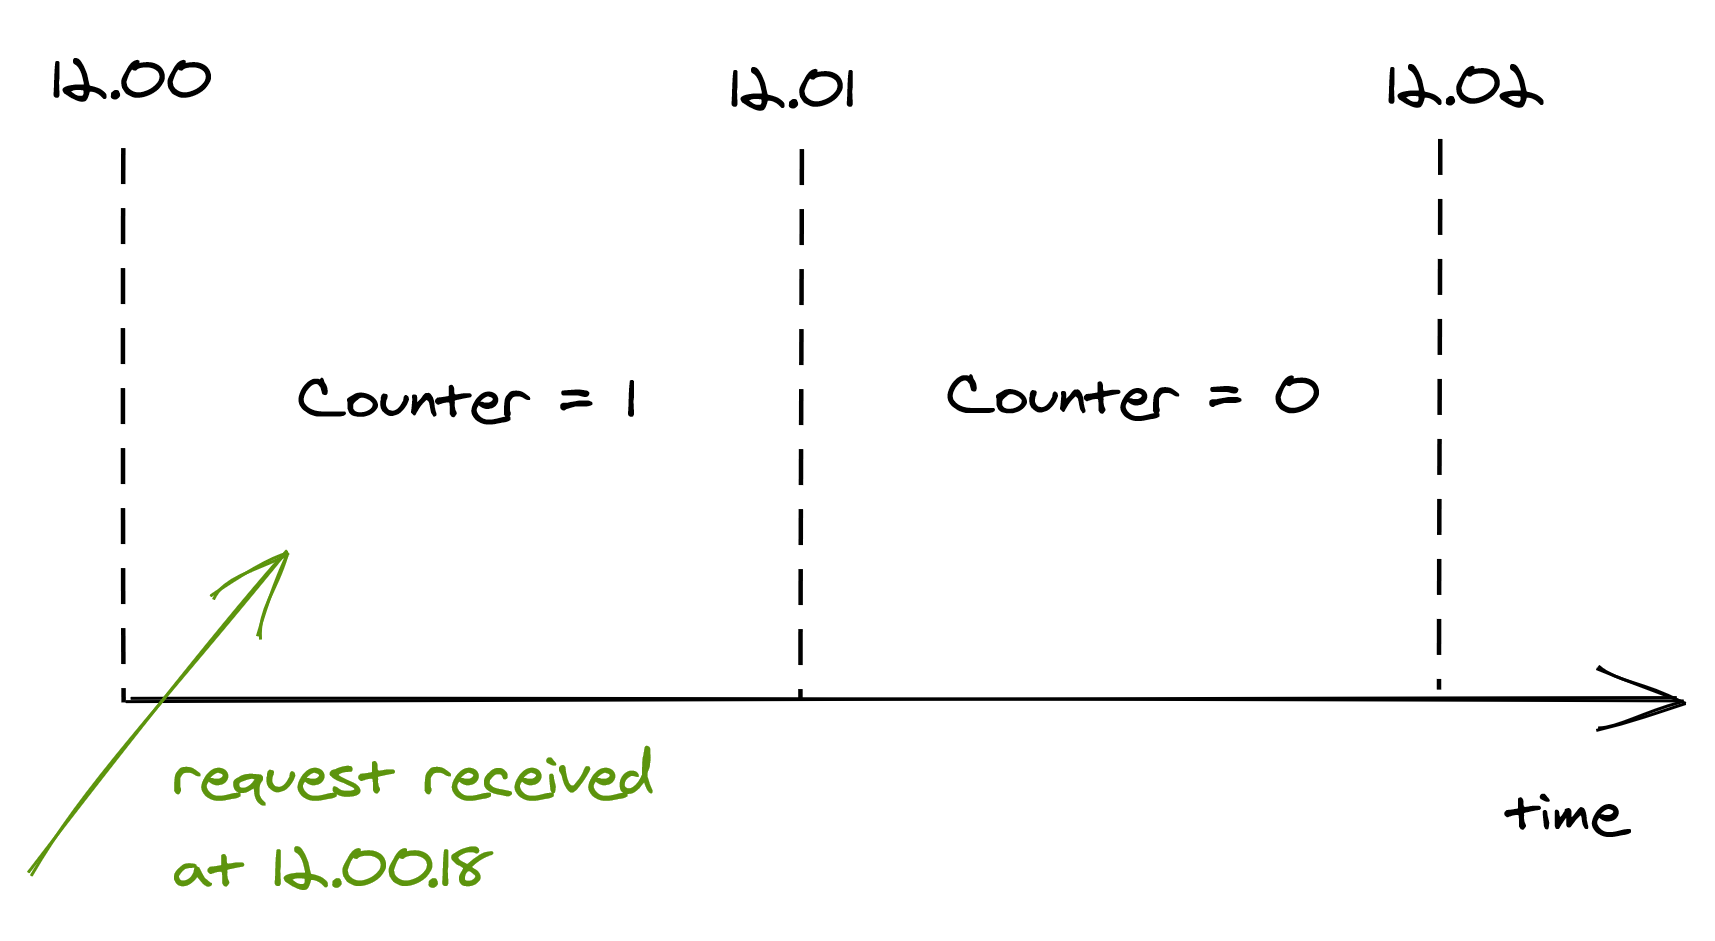
Figure 17.3: When a new request comes in, its timestamp is used to determine the bucket it belongs to.
With bucketing, we can compress the information about the number of requests seen in a way that doesn’t grow as the number of requests does. Now that we have a memory-friendly representation, how can we use it to implement rate-limiting? The idea is to use a sliding window that moves in real-time across the buckets, keeping track of the number of requests within it.
The sliding window represents the interval of time used to decide whether to rate-limit or not. The window’s length depends on the time unit used to define the quota, which in our case is 1 minute. But, there is a caveat: a sliding window can overlap with multiple buckets. To derive the number of requests under the sliding window, we have to compute a weighted sum of the bucket’s counters, where each bucket’s weight is proportional to its overlap with the sliding window (see Figure 17.4).
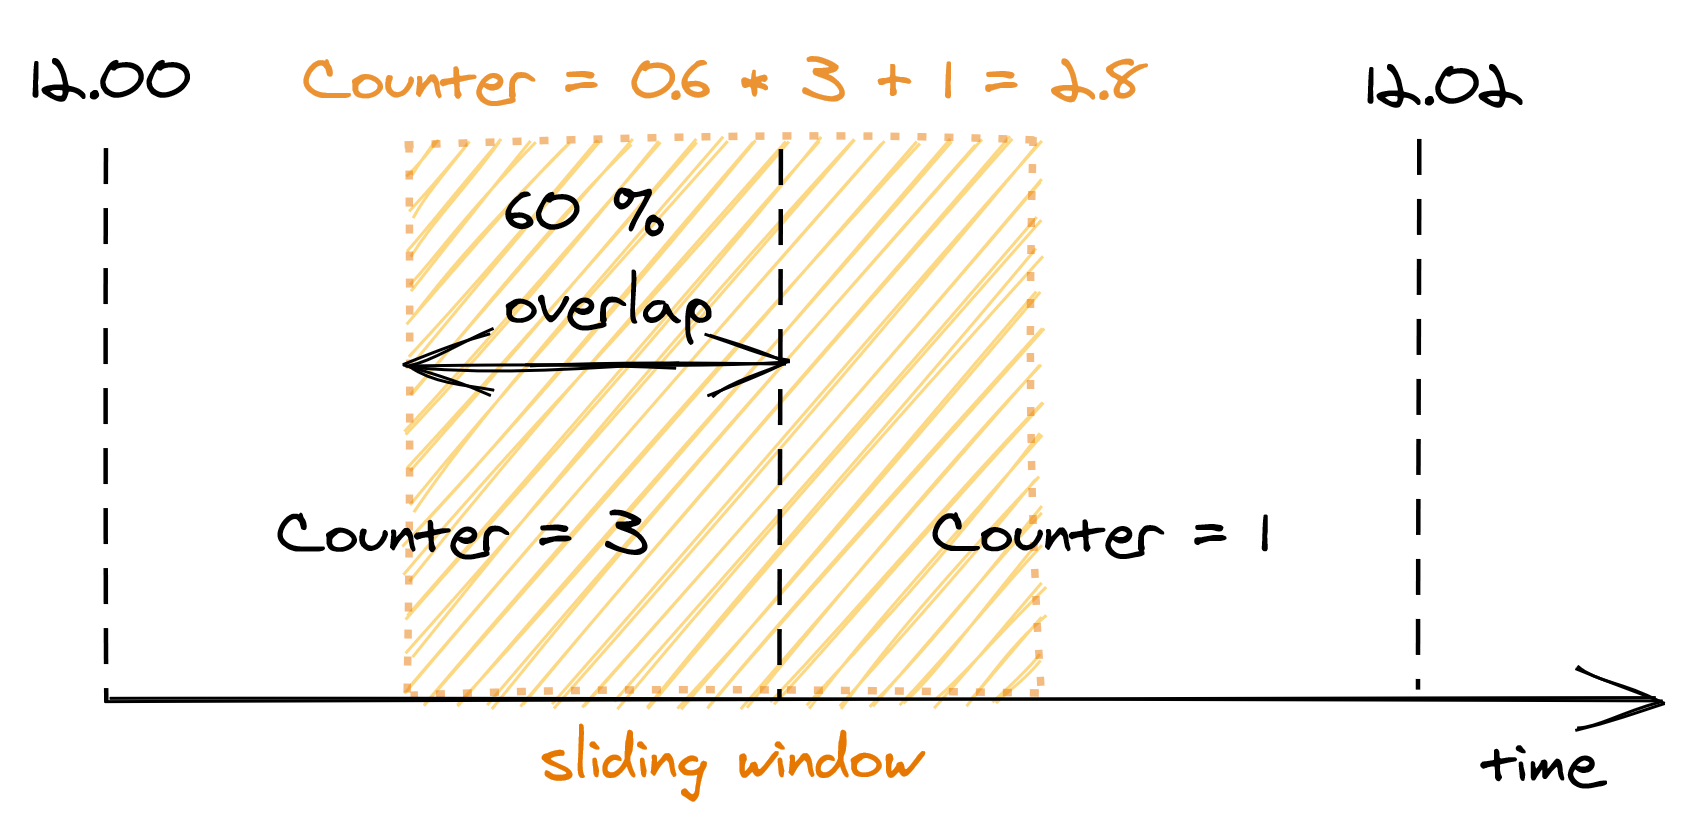
Figure 17.4: A bucket’s weight is proportional to its overlap with the sliding window.
Although this is an approximation, it’s a reasonably good one for our purposes. And, it can be made more accurate by increasing the granularity of the buckets. For example, you can reduce the approximation error using 30-second buckets rather than 1-minute ones.
We only have to store as many buckets as the sliding window can overlap with at any given time. For example, with a 1-minute window and a 1-minute bucket length, the sliding window can touch at most 2 buckets. And if it can touch at most two buckets, there is no point to store the third oldest bucket, the fourth oldest one, and so on.
To summarize, this approach requires two counters per API key, which is much more efficient in terms of memory than the naive implementation storing a list of requests per API key.
17.3.2 Distributed implementation
When more than one process accepts requests, the local state no longer cuts it, as the quota needs to be enforced on the total number of requests per API key across all service instances. This requires a shared data store to keep track of the number of requests seen.
As discussed earlier, we need to store two integers per API key, one for each bucket. When a new request comes in, the process receiving it could fetch the bucket, update it and write it back to the data store. But, that wouldn’t work because two processes could update the same bucket concurrently, which would result in a lost update. To avoid any race conditions, the fetch, update, and write operations need to be packaged into a single transaction.
Although this approach is functionally correct, it’s costly. There are two issues here: transactions are slow, and executing one per request would be crazy expensive as the database would have to scale linearly with the number of requests. On top of that, for each request a process receives, it needs to do an outgoing call to a remote data store. What should it do if it fails?
Let’s address these issues. Rather than using transactions, we can use a single atomic get-and-increment operation that most data stores provide. Alternatively, the same can be emulated with a compare-and-swap. Atomic operations have much better performance than transactions.
Now, rather than updating the database on each request, the process can batch bucket updates in memory for some time, and flush them asynchronously to the database at the end of it (see Figure 17.5). This reduces the shared state’s accuracy, but it’s a good trade-off as it reduces the load on the database and the number of requests sent to it.
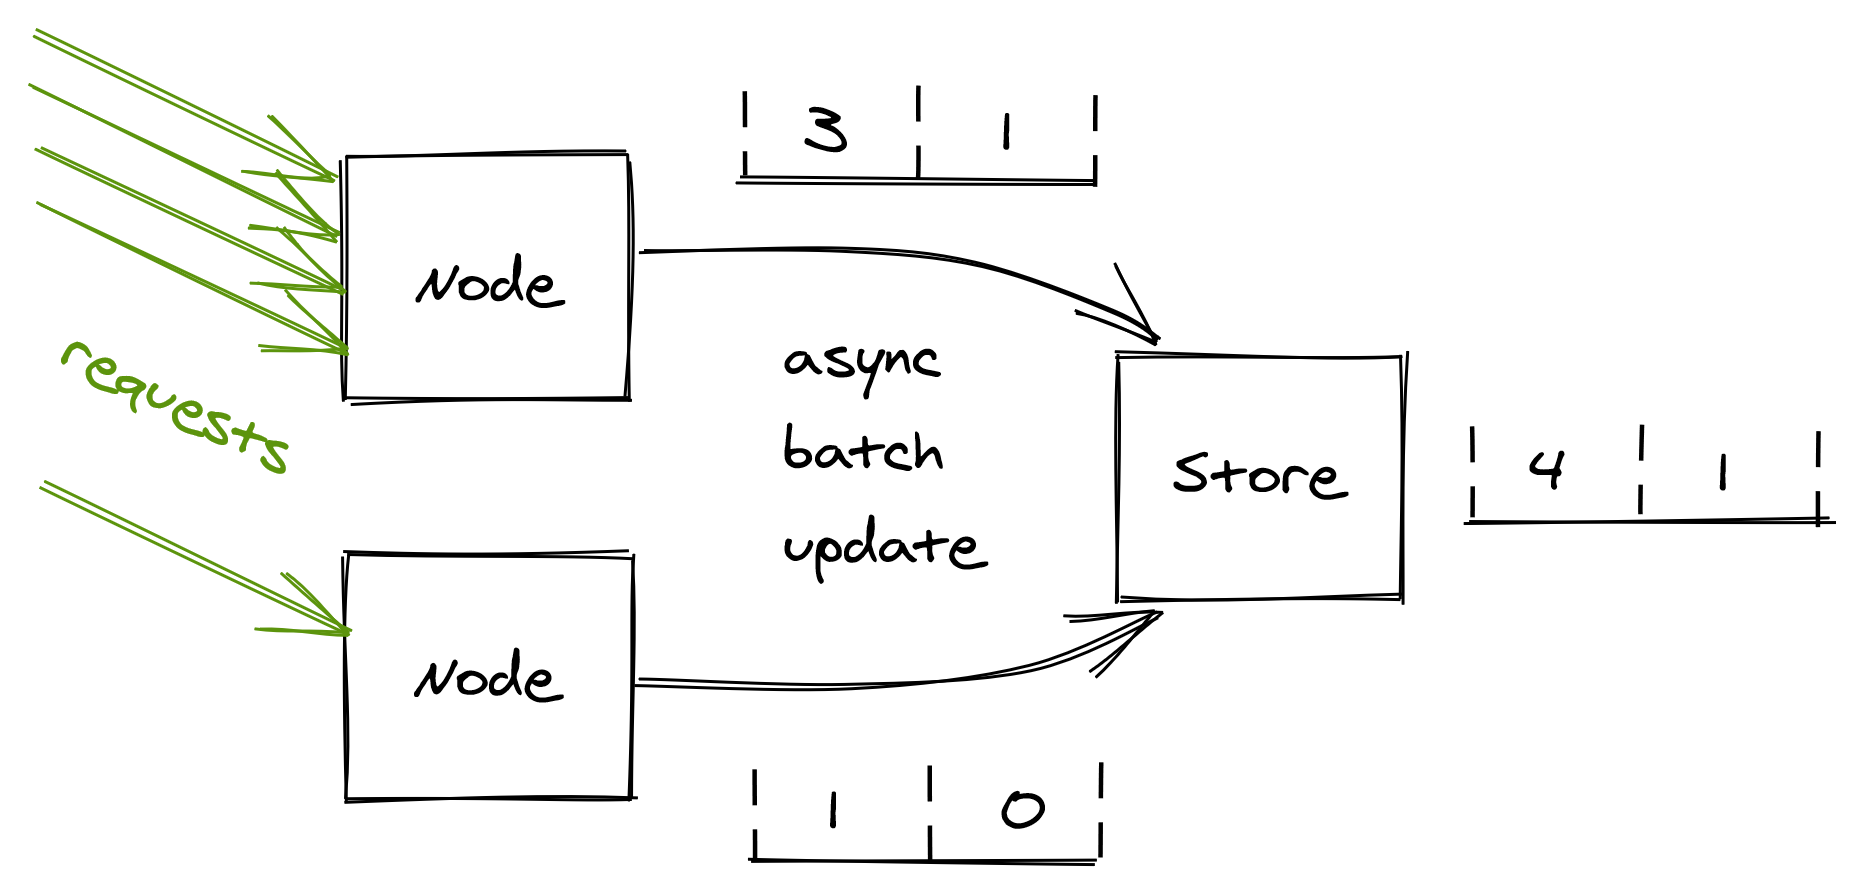
Figure 17.5: Servers batch bucket updates in memory for some time, and flush them asynchronously to the database at the end of it.
What happens if the database is down? Remember the CAP theorem’s essence: when there is a network fault, we can either sacrifice consistency and keep our system up, or maintain consistency and stop serving requests. In our case, temporarily rejecting all incoming requests just because the database used for rate-limiting is not reachable could be very damaging to the business. Instead, it’s safer to keep serving requests based on the last state read from the store.
17.4 Bulkhead
The goal of the bulkhead pattern is to isolate a fault in one part of a service from taking the entire service down with it. The pattern is named after the partitions of a ship’s hull. If one partition is damaged and fills up with water, the leak is isolated to that partition and doesn’t spread to the rest of the ship.
Some clients can create much more load on a service than others. Without any protections, a single greedy client can hammer the system and degrade every other client. We have seen some patterns, like rate-limiting, that help prevent a single client from using more resources than it should. But rate-limiting is not bulletproof. You can rate-limit clients based on the number of requests per second; but what if a client sends very heavy or poisonous requests that cause the servers to degrade? In that case, rate-limiting wouldn’t help much as the issue is intrinsic with the requests sent by that client, which could eventually lead to degrading the service for every other client.
When everything else fails, the bulkhead pattern provides guaranteed fault isolation by design. The idea is to partition a shared resource, like a pool of service instances behind a load balancer, and assign each user of the service to a specific partition so that its requests can only utilize resources belonging to the partition it’s assigned to.
Consequently, a heavy or poisonous user can only degrade the requests of users within the same partition. For example, suppose there are 10 instances of a service behind a load balancer, which are divided into 5 partitions (see Figure 17.6). In that case, a problematic user can only ever impact 20 percent of the service’s instances. The problem is that the unlucky users who happen to be on the same partition as the problematic one are fully impacted. Can we do better?
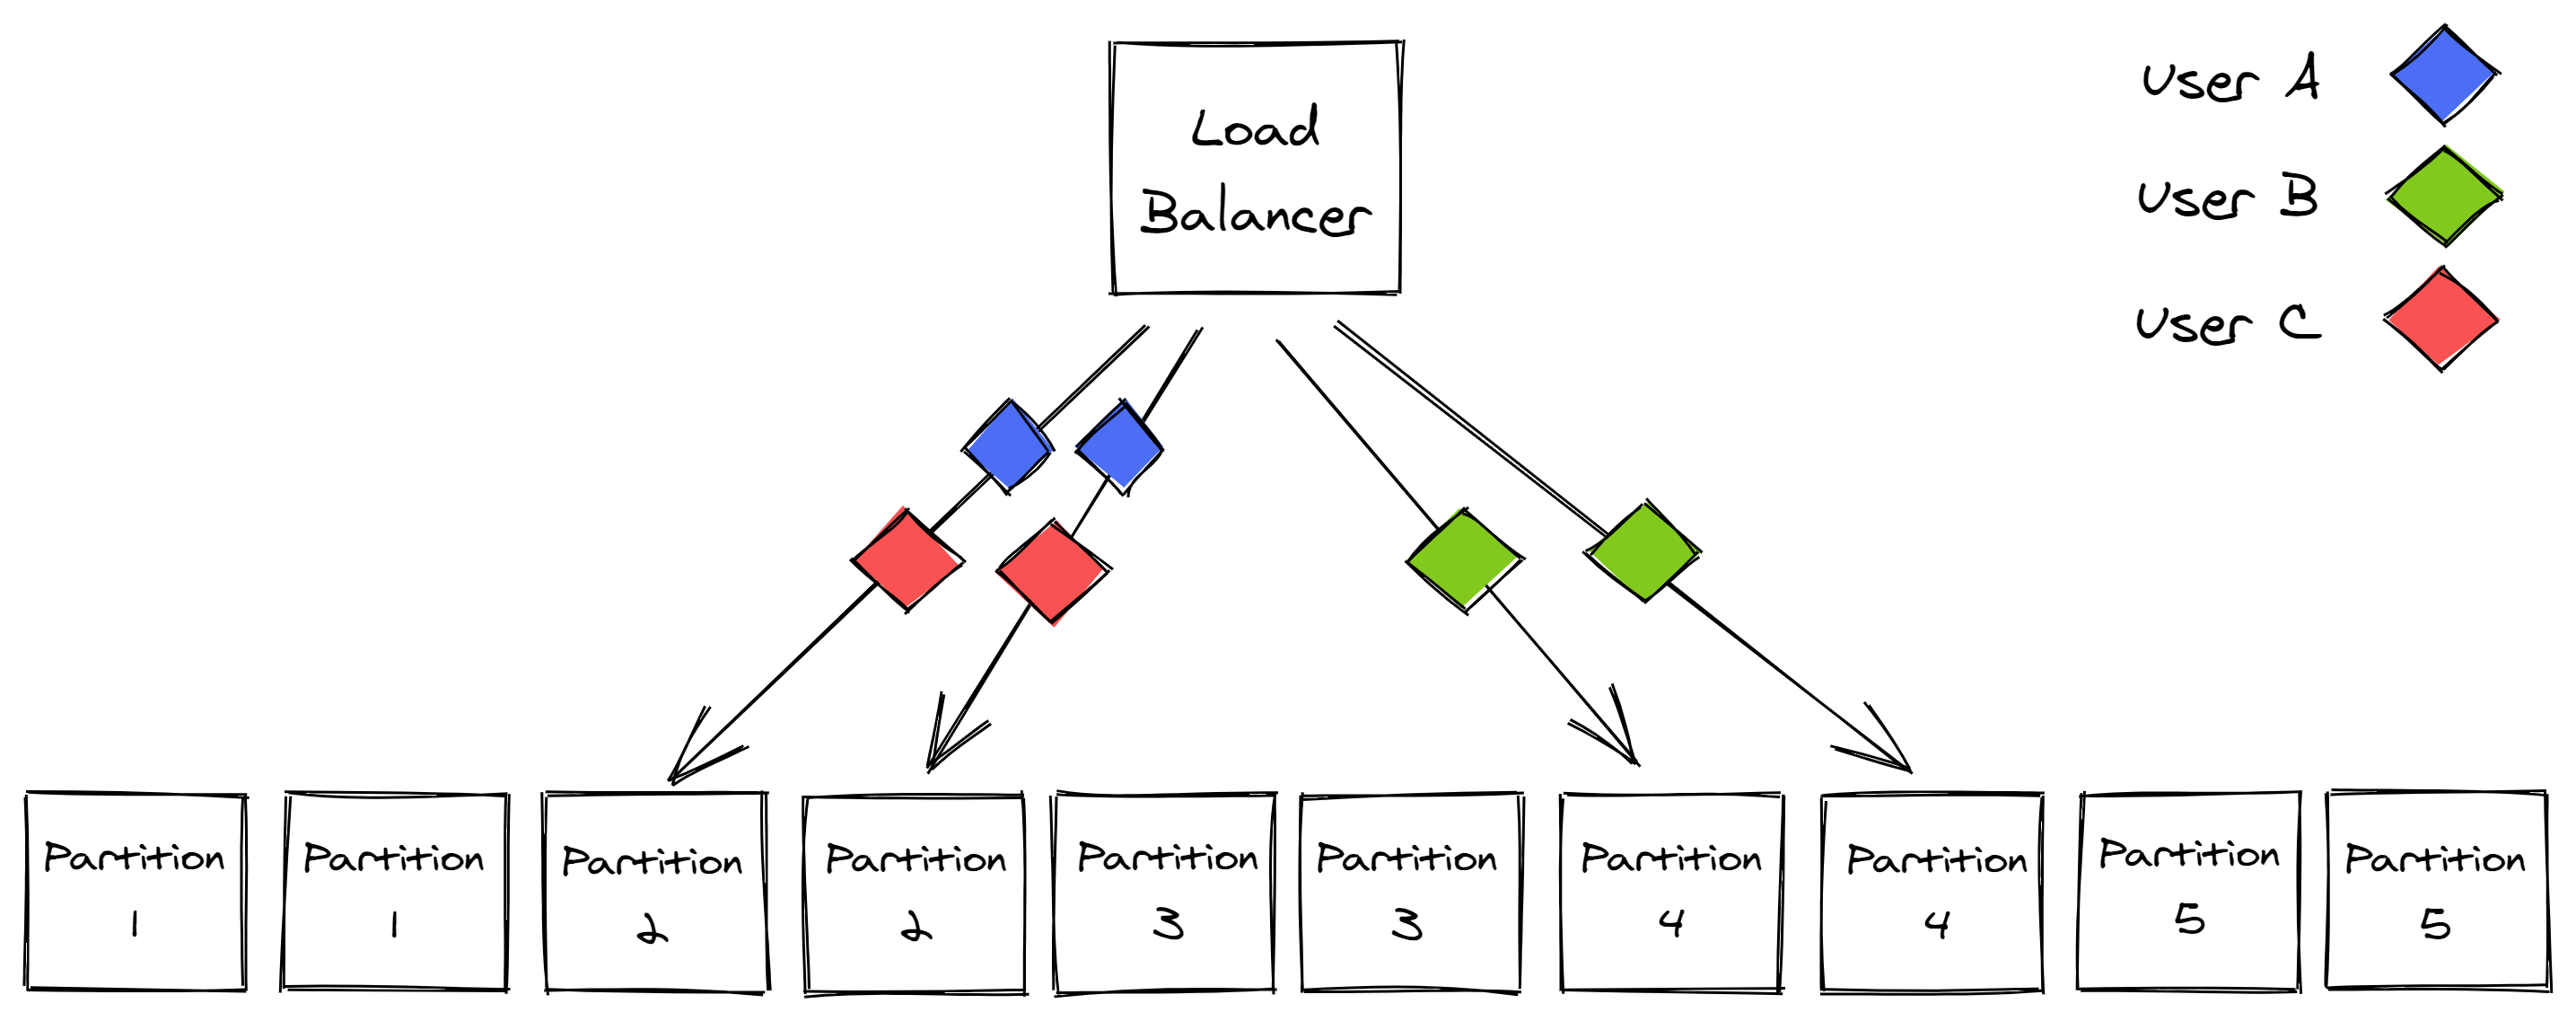
Figure 17.6: Service instances partitioned into 5 partitions
We can introduce virtual partitions that are composed of a random subset of instances. This can make it much more unlikely for another user to be allocated to the exact same virtual partition.
In our example, we can extract 45 combinations of 2 instances (virtual partitions) from a pool of 10 instances. When a virtual partition is degraded, other virtual partitions are only partially impacted as they don’t fully overlap (see Figure 17.7). If you combine this with a health check on the load balancer, and a retry mechanism on the client side, what you get is much better fault isolation.
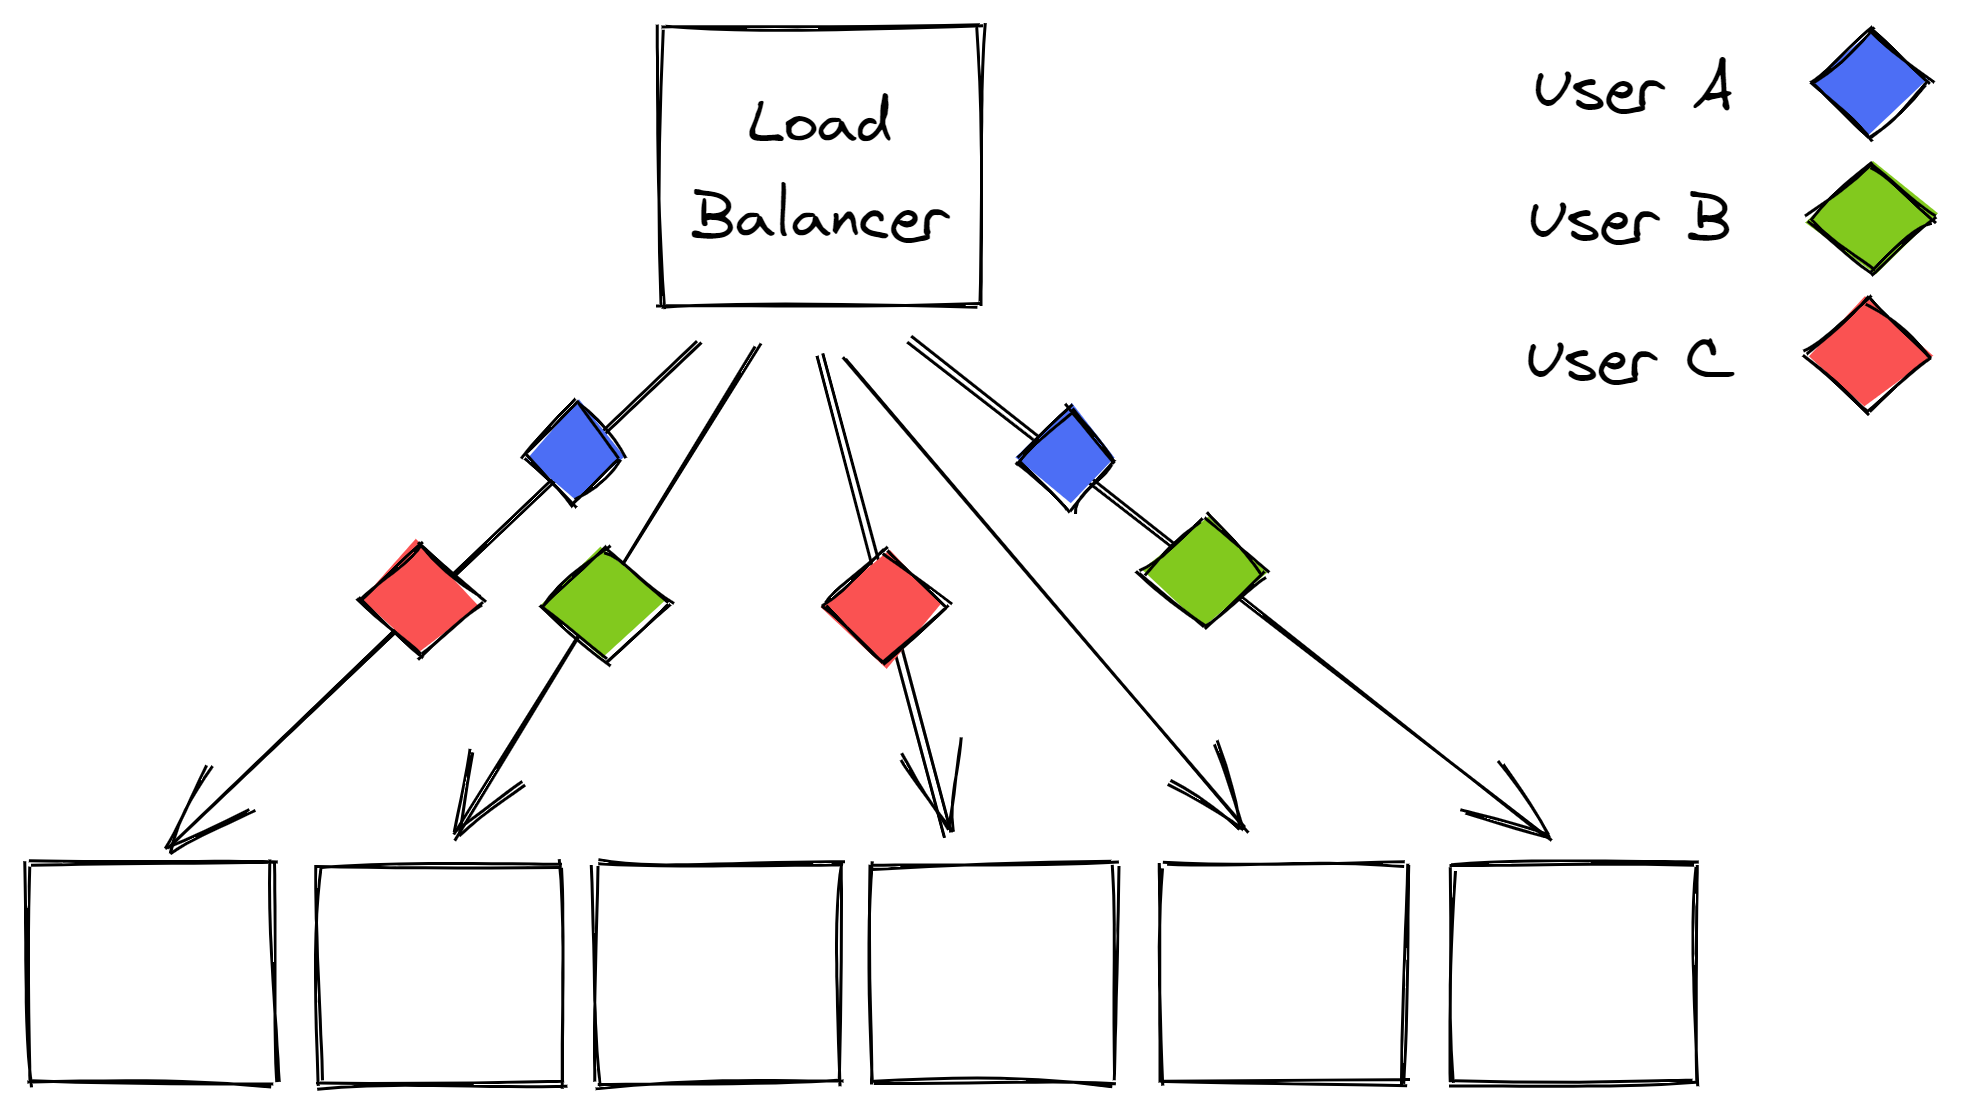
Figure 17.7: Virtual partitions are far less likely to fully overlap with each other.
You need to be careful when applying the bulkhead pattern; if you take it too far and create too many partitions, you lose all the economy-of-scale benefits of sharing costly resources across a set of users that are active at different times.
You also introduce a scaling problem. Scaling is simple when there are no partitions and every user can be served by any instance, as you can just add more instances. It’s not that easy with a partitioned pool of instances as some partitions are much hotter than others.
17.5 Health endpoint
So far, we have explored patterns that allow a process to shed or reject incoming requests. Those are mitigations a server can apply only after it has received a request. Wouldn’t it be nice to have a way to control the incoming traffic so that it doesn’t reach a degraded server in the first place?
If the server is behind a load balancer and can communicate that it’s overloaded, the balancer can stop sending requests to it. The process can expose a health endpoint that when queried performs a health check that either returns 200 (OK) if the process can serve requests, or an error code if it’s overloaded and doesn’t have more capacity to serve requests.
The health endpoint is periodically queried by the load balancer. If the endpoint returns an error, the load balancer considers the process unhealthy and takes it out of the pool. Similarly, if the request to the health endpoint times out, the process is also taken out of the pool.
Health checks are critical to achieving high availability; if you have a service with 10 servers and one is unresponsive for some reason, then 10% of the requests will fail, which will cause the service’s availability to drop to 90%.
Let’s have a look at the different types of health checks that you can leverage in your service.
17.5.1 Health checks
A liveness health test is the most basic form of checking the health of a process. The load balancer simply performs a basic HTTP request to see whether the process replies with a 200 (OK) status code.
A local health test checks whether the process is degraded or in some faulty state. The process’s performance typically degrades when a local resource, like memory, CPU, or disk, is either close enough to be fully saturated, or is completely saturated. To detect a degradation, the process compares one or more local metrics, like memory available or remaining disk space, with some fixed upper and lower-bound thresholds. When a metric is above an upper-bound threshold, or below a lower-bound one, the process reports itself as unhealthy.
A more advanced, and also harder check to get right, is the dependency health check. This type of health check detects a degradation caused by a remote dependency, like a database, that needs to be accessed to handle incoming requests. The process measures the response time, timeouts, and errors of the remote calls directed to the dependency. If any measure breaks a predefined threshold, the process reports itself as unhealthy to reduce the load on the downstream dependency.
But here be dragons: if the downstream dependency is temporarily unreachable, or the health-check has a bug, then it’s possible that all the processes behind the load balancer fail the health check. In that case, a naive load balancer would just take all service instances out of rotation, bringing the entire service down!
A smart load balancer instead detects that a large fraction of the service instances is being reported as unhealthy and considers the health check to no longer be reliable. Rather than continuing to remove processes from the pool, it starts to ignore the health-checks altogether so that new requests can be sent to any process in the pool.
17.6 Watchdog
One of the main reasons to build distributed services is to be able to withstand single-process failures. Since you are designing your system under the assumption that any process can crash at any time, your service needs to be able to deal with that eventuality.
For a process’s crash to not affect your service’s health, you should ensure ideally that:
- there are other processes that are identical to the one that crashed that can handle incoming requests;
- requests are stateless and can be served by any process;
- any non-volatile state is stored on a separate and dedicated data store so that when the process crashes its state isn’t lost;
- all shared resources are leased so that when the process crashes, the leases expire and the resources can be accessed by other processes;
- the service is always running slightly over-scaled to withstand the occasional individual process failures.
Because crashes are inevitable and your service is prepared for them, you don’t have to come up with complex recovery logic when a process gets into some weird degraded state — you can just let it crash. A transient but rare failure can be hard to diagnose and fix. Crashing and restarting the affected process gives operators maintaining the service some breathing room until the root-cause can be identified, giving the system a kind of self-healing property.
Imagine that a latent memory leak causes the available memory to decrease over time. When a process doesn’t have more physical memory available, it starts to swap back and forth to the page file on disk. This swapping is extremely expensive and degrades the process’s performance dramatically. If left unchecked, the memory leak would eventually bring all processes running the service on their knees. Would you rather have the processes detect they are degraded and restart themselves, or try to debug the root cause for the degradation at 3 AM?
To implement this pattern, a process should have a separate background thread that wakes up periodically — a watchdog — that monitors its health. For example, the watchdog could monitor the available physical memory left. When any monitored metric breaches a configured threshold, the watchdog considers the process degraded and deliberately restarts it.
The watchdog’s implementation needs to be well-tested and monitored since a bug could cause the processes to restart continuously.