Long description
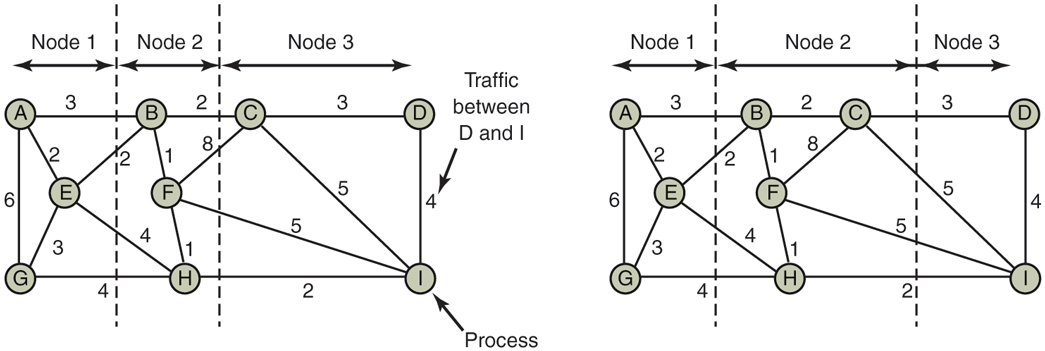
Part (a): There are three nodes labeled Node 1, Node 2, and Node 3. Node 1 contains three processes labeled A, E, and G. Node 2 contains B, F, and H. Node 3 contains C, D, and I. It shows a system of nine processes, A through I, with each arc labeled with the mean communication load between those two processes. A to B load is 3, B to C load is 2, C to D load is 3, A to E load is 2, B to E load is 2, B to F load is 1, C to F load is 8, A to G load is 6, E to G load is 3, G to H load is 4, E to H load is 4, F to H load is 1, H to I load is 2, F to I load is 5, C to I load is 5, D to I load is 4. The total network traffic is the sum of the arcs intersected by the cuts (the dashed lines), or 30 units. The dashed lines are in between node 1, node 2, and node 3. Part (b): Nodes are connected with loads similar way in part (a). The only difference is a different partitioning that has only 28 units of network traffic. Node 1 contains three processes labeled A, E, and G. Node 2 contains B, C, F, and H. Node 3 contains D, and I. The dashed lines are in between node 1, node 2, and node 3.
Back