Long description
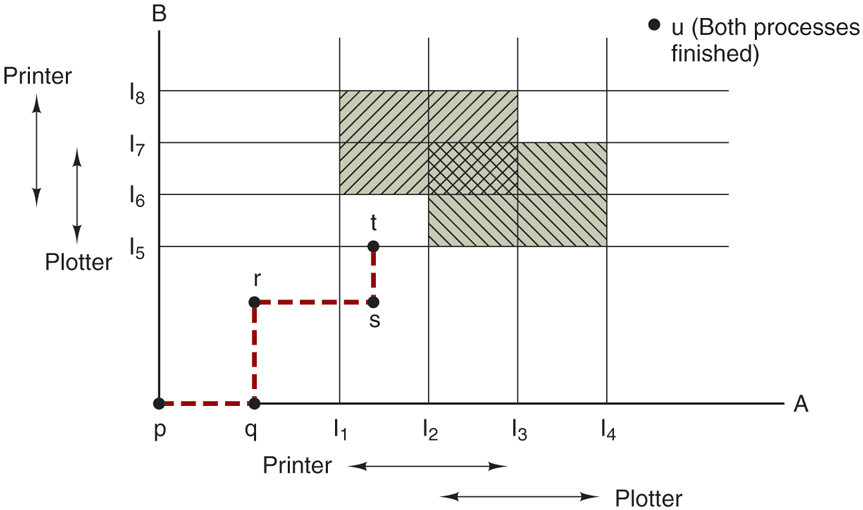
The horizontal axis represents the number of instructions executed by process A and marked I subscript 1, I subscript 2, I subscript 3, I subscript 4 in equal intervals. The vertical axis represents the number of instructions executed by process B and marked I subscript 5, I subscript 6, I subscript 7, I subscript 8 in equal intervals. The horizontal and vertical axis are also labeled printer and plotter using double headed arrows. A set of vertical and horizontal lines are drawn from the points marked on the horizontal and vertical axes and the rectangular regions thus formed are shaded except the lower left end and upper right end region. The curve starts at the origin labeled p, moves toward right upto the point q which is at the left mid of horizontal axis, then goes up until the point r which is at the lower mid region of first quadrant, then moves right upto the point s which lies between the points I subscript 1 and I subscript 2 and finally rises upward upto t which lies at the horizontal lines from I subscript 5 and ends.
A point u is marked on the upper right end of the first quadrant which represents both processes finished.
Back