Long description
Back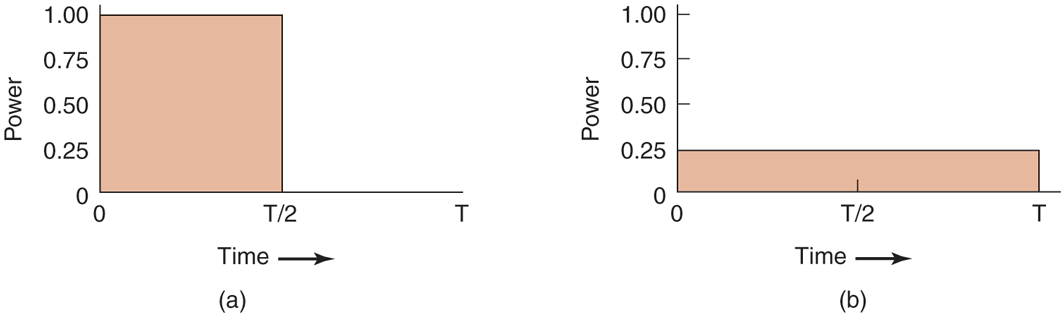
The horizontal axis is labeled time and ranges from 0 to T in increments of T by 2 units. The vertical axis is labeled power and ranges from 0 to 1.00 in increments of 0.25 units.
Figure a: The rectangular curve starts at (0, 1.00), moves toward the right until (T by 2, 1.00), then drops downward and ends at (T by 2, 0). The area inside the curve is shaded.
Figure b: The rectangular curve starts at (0, 0.25), moves toward the right until (T, 0.25), then drops downward and ends at (T, 0). The area under the curve is shaded.
Back