Chapter 6. Market Infrastructure
Bitcoin, ether, and many other cryptocurrencies are openly traded on various markets around the world. Speculation is estimated to account for 60–80% of all blockchain transactions, which makes examining this component of blockchain important.
In the early days, a lack of infrastructure made the blockchain ecosystem highly volatile and risky. Although things have improved, the cryptocurrency market infrastructure is still far from perfect. A lot of structural scaffolding has been built, but there are still critical issues with the way these markets function. They’re not fully regulated, and manipulation exists. This chapter is in no way an endorsement of speculation in cryptocurrency. To put it plainly, it’s possible to lose a lot of money trading cryptocurrency.
Evolution of the Price of Bitcoin
Bitcoin is the bellwether of the entire cryptocurrency economy. This means the prices of other cryptocurrencies generally follow the trend of BTC—and it’s important to understand that peaks and valleys in price are the norm for this, the world’s most popular digital asset (Figure 6-1).
There have been many bitcoin bubbles, each one resulting in a higher price than the last, as more and more players entered the ecosystem for various reasons. Here are some of the bubbles that have led to all-time highs for BTC:
-
2010 (1): Price goes from $0.008 in October to $0.08 in November, 900% increase
-
2010 (2): Price rises to $0.50 by end of November, 525% increase
-
2011: Price jumps to $31.91 in June, 6,282% increase over previous high
-
2013 (1): Price climbs to $266.00 in March, 734% increase over previous high
-
2013 (2): Price rises to $1,154.93 in December, 334% increase over previous high
-
2017: Price reaches $17,900.00 by December, 1,450% increase over previous high
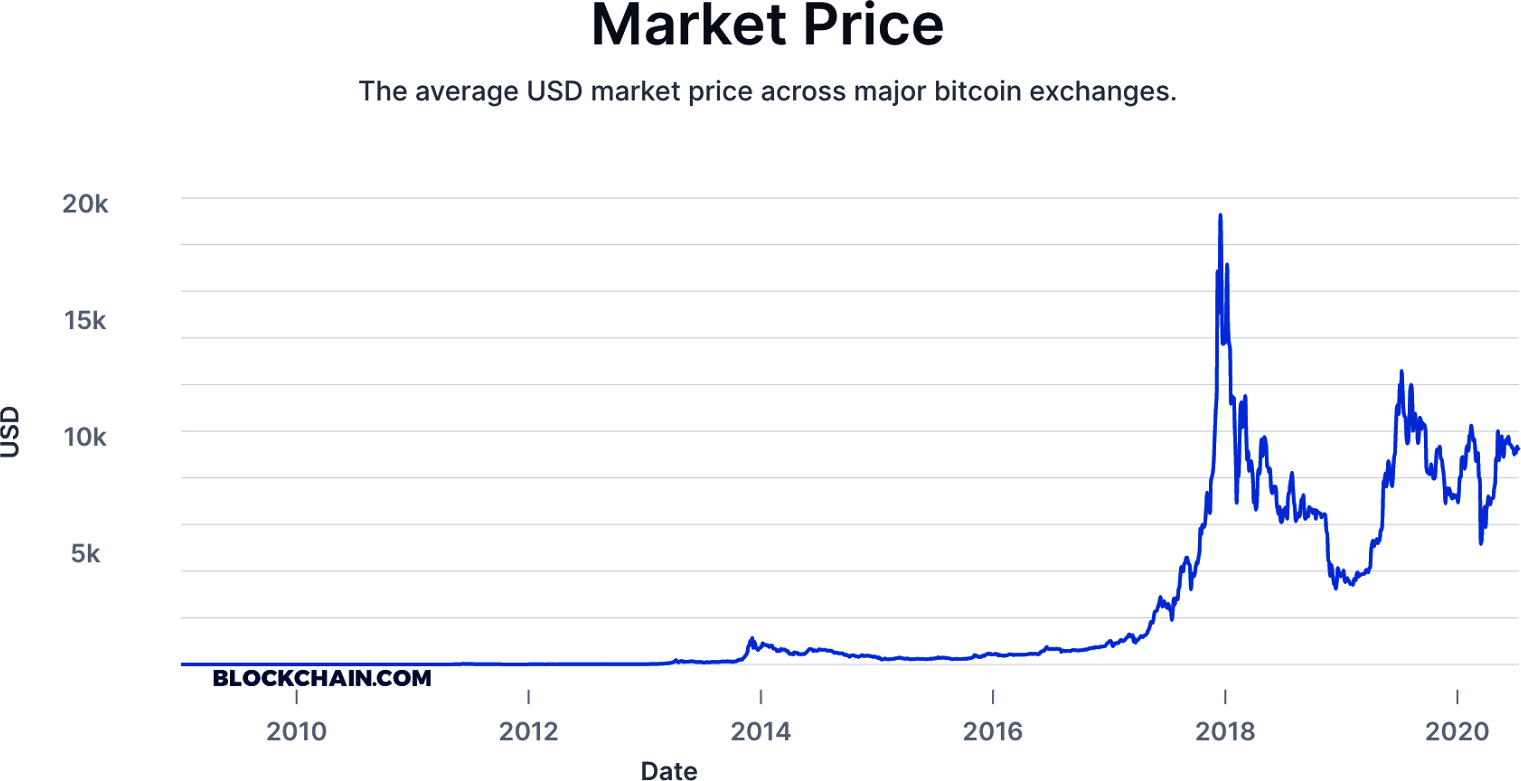
Figure 6-1. BTC price over the past decade
Over the course of cryptocurrency’s history, there have been a number of ways to buy and sell it:
- Person-to-person
- Buying and selling cryptocurrency is done in face-to-face transactions.
- Buying or selling products/services
- A person acquires or spends cryptocurrency in exchange for something.
- Cryptocurrency ATMs
- Kiosks dispense cryptocurrency for cash. They can also accept crypto for fiat.
- Mining
- By contributing computing power to a network, miners are rewarded with transaction fees as well as newly minted cryptocurrency.
- Exchanges
- Crypto is traded on purpose-built websites that act similarly to stock exchanges, with a few nuances.
All of these methods have pros and cons. Person-to-person trading might be a safe option if the two parties are known to each other, but it could be problematic if one person is trying to cheat the other. Buying or selling products or services was once thought to be the pathway to mass adoption of cryptocurrency. However, high transaction fees, slow confirmation times, and network scalability issues have poured cold water on the idea of crypto becoming a popular payment mechanism anytime soon.
Cryptocurrency ATMs, many of which are listed on the Coin ATM Radar website, are a convenient way to buy/sell from a physical location. But they are expensive in terms of the transaction fees applied and aren’t always as easy to use as traditional ATMs. Cryptocurrency mining was discussed in Chapter 2, but as you saw, for most, mining is no longer a hobbyist activity and has become an enterprise data center–centric effort.
Exchanges have emerged as the main way to trade cryptocurrency.
The Role of Exchanges
Cryptocurrency exchanges have become the dominant force within the cryptocurrency market. To understand the market, you have to know about these platforms.
There are several different types of cryptocurrency exchange, so let’s first look at the differences between them. Users can use all of them to send and receive cryptocurrency transactions, but the exchanges have differences in terms of security, speed, and interface.
Here are the basic types of exchanges:
- Centralized exchanges
- These are run by a company that collects fees from trading, usually in the form of a percentage.
- Decentralized exchanges
- Rather than being run by a company, decentralized exchanges are sites where order books (see the next section) operate using smart contracts, which were discussed in Chapter 5. Decentralized exchanges are crypto-only; we’ll talk more about these in the next chapter.
- Spot exchanges
- These exchanges trade cryptocurrencies. The trader owns the assets, and if it is a centralized exchange, the exchange usually holds the assets in the trader’s account. If it is a decentralized exchange, the assets are self-custodied.
- Derivatives exchanges
- These are entities that enable traders to use more complex trading tools such as highly leveraged products, options, swaps, and futures.
Cryptocurrency exchanges have pretty basic order types, which are similar to those in stock trading. Here are some terms you’ll encounter:
- Market
- An order to be executed immediately at current market prices. This is the fastest way to buy or sell.
- Limit
- An order where a price is specified. It will not fill until the market matches the buy or sell price.
- Expires
- With limit orders, some exchanges allow an expiration—days, weeks, months, or good til canceled are usually the parameters.
- Maker/taker
- Almost all cryptocurrency exchanges use a maker/taker model to charge fees. This means that a trader providing liquidity (called the maker) does not pay a fee, while a trader doing market trades on an order book (the taker) pays the exchange for the ability to do so.
- Bid
- The maximum price a buyer is willing to pay for a market order.
- Ask
- The minimum price a seller is willing to receive for a market order.
The remainder of this section introduces various concepts you should be aware of when trading cryptocurrencies.
Order Books
An order book is a visual representation of outstanding orders for a cryptocurrency on an exchange. Although interfaces can vary, all order books generally do the same thing: they allow traders to see bids (buys) and asks (sells) that have been placed to be filled. Figure 6-2 shows an example of an order book.
The market size is the amount of cryptocurrency being placed in the order. Unlike traditional stocks, cryptocurrencies are divisional, many down to the eighth decimal place. For bitcoin, exchanges like Coinbase Pro use four decimals for trading. Traders looking to sell are indicated in red, and buys are in green.
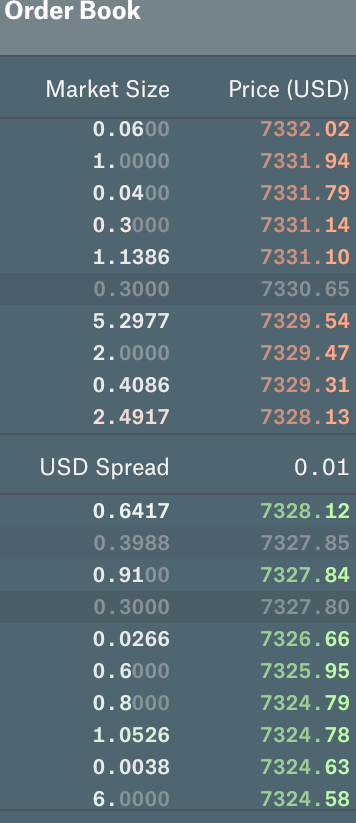
Figure 6-2. A typical order book
Slippage
The difference between the expected price of a trade and its execution price, slippage is a major issue in cryptocurrency trading. Because order books on most exchanges are thin, meaning they lack substantial orders, larger orders “slip” through the order book at less-than-ideal prices.
Say a trader wants to sell $60,000 worth of bitcoin on a cryptocurrency exchange. Most order books could not handle that type of pricing because there aren’t that many offers to buy. Figure 6-3 shows a sample view of the Coinbase Pro order book.
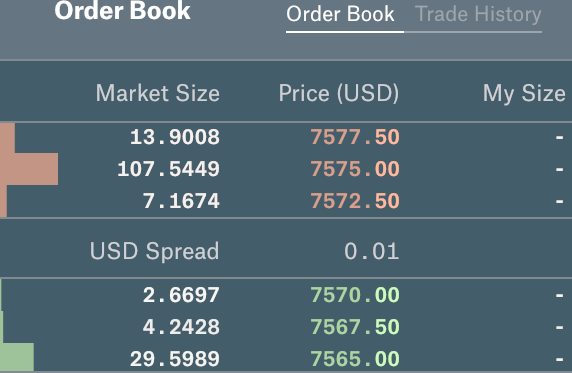
Figure 6-3. Coinbase Pro order book showing slippage
The amount of sells in this instance is much higher than buys. $40,000 worth of BTC isn’t available at one buy price; therefore, a sell order executed would slip through to $7,565.
Traders do have options—they can break up the orders into smaller increments or go into the over-the-counter (OTC) market to fill the sell at one price. However, this example of exchange slippage shows how small cryptocurrency order books typically are. They operate on a much different scale than mature markets; large platforms like the NYSE and the NASDAQ can easily fill orders of this size.
Note
Miners must convert their block rewards and transaction fees gained into fiat currency to pay for overhead, so mining impacts market data. This overhead may include mining equipment, energy costs, and data center operations, among other things, creating constant selling pressure. However, most miners use OTC providers to sell cryptocurrency, and OTC has less of an impact on cryptocurrency slippage as there is not a transparent order book.
Depth Charts
An order book visualization tool, depth charts allow traders to see how deep buys and sells are for a particular cryptocurrency, as shown in Figure 6-4. They display the real-time relationship between supply and demand in the market.
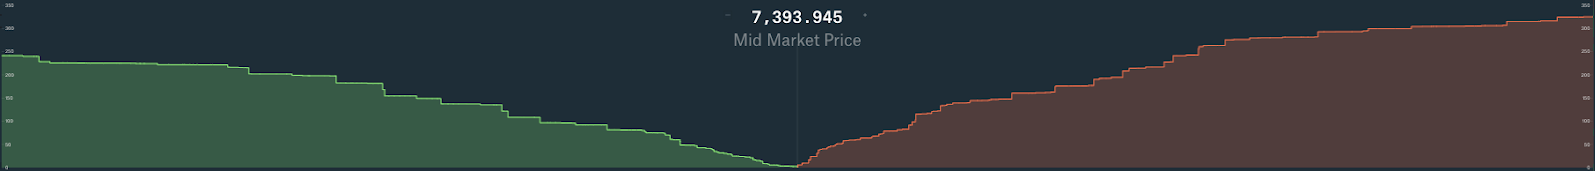
Figure 6-4. Depth chart
In Figure 6-4, bids (buys) are in green (the lefthand curve), and asks (sells) are in red (on the right). In the middle of the chart where the curves meet is what the market price for the asset is, with the lowest bids on the left and highest asks on the right. The rise on each side represents the steps in price on the order book, where the asks are in a converse relationship with price (meaning technically they should be trending down). In Figure 6-4, there is a deeper book of asks on the market than buys.
These depth charts are usually interactive on exchanges. This means a trader can place a cursor at any point on the line and determine the pricing it will take to move through the order book with some simple math. Depth charts are a useful tool for spotting abnormalities in the market, especially determining which side has a stronger order book for trading. They are also useful to determine, given a certain market order at a certain price, how much an individual person selling at a certain price could push the price of the market.
Jurisdiction
Most assets in the traditional financial world are traded on centralized exchanges that are highly regulated. For example, Apple stock is traded on the NASDAQ, and the price of Apple stock is dictated by the trading activity on that one market.
By contrast, cryptocurrency trading is done on thousands of markets on hundreds of exchanges. These operate in different jurisdictions and therefore must comply with different levels of regulatory oversight. Figure 6-5 illustrates.
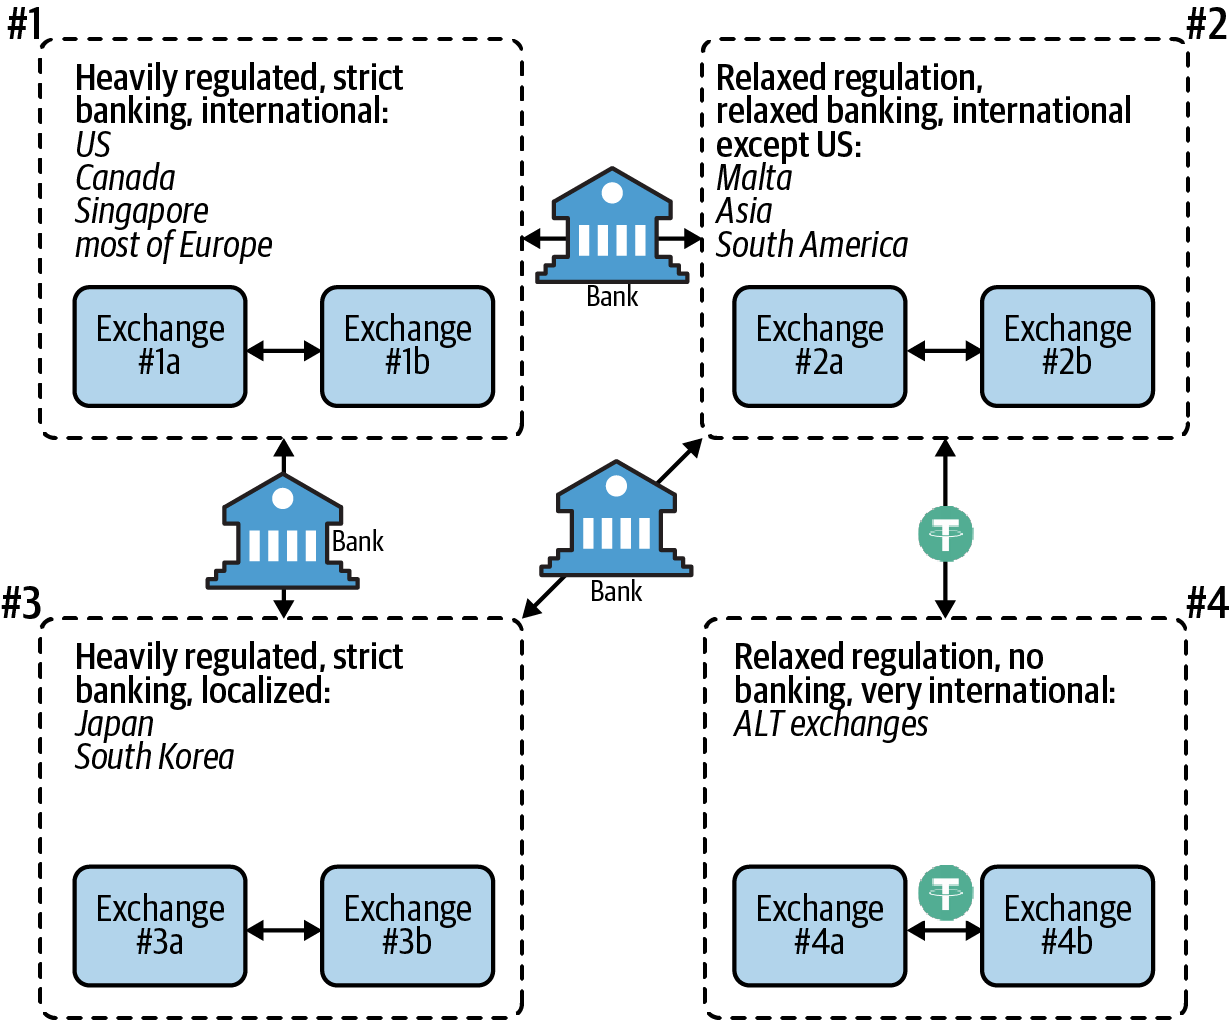
Figure 6-5. Four types of cryptocurrency exchanges
Cryptocurrency exchanges are bound by the laws of the jurisdictions they operate in. Figure 6-5 shows four categories that exchanges may fall into:
-
International exchanges under heavy regulation. These have strict Know Your Customer rules to maintain banking, meaning they have identifying customer information. They mostly reside in the US, Canada, Singapore, and Europe.
-
Exchanges under relaxed regulation. These have relaxed customer rules to maintain banking and service international customers outside the US, sometimes meaning having less identifying customer information. Most of these exchanges reside in Asia and South America.
-
Localized exchanges under heavy regulation. These have strict Know Your Customer rules for banking, but they only service customers located in their country. These exchanges are mostly located in Japan and South Korea, with a few in other places.
-
Exchanges that do not have any banking and therefore have relaxed regulation. These do not comply with regulations to keep bank accounts. They service international customers and mostly reside in Asia and South America.
Since exchanges in the first three categories offer bank accounts, it is possible to arbitrage—purchase an asset in one market at one price and sell the same asset in another market at a higher price—through the traditional banking network. Arbitrage keeps prices relatively close between these exchanges. Unregulated exchanges (category 4) do not have banking and use stablecoins such as USDT (tether) to arbitrage between exchanges to maintain relatively similar prices (see “Arbitrage”).
Wash Trading
Wash trading is a form of market manipulation prevalent in cryptocurrency markets. This is where traders are concurrently buying and selling a cryptocurrency in order to produce an artificial market, which is illegal in highly regulated jurisdictions. Wash trading in cryptocurrency markets is conducted by bad actors trying to do one or more of the following:
-
Prop up the trading volume of a cryptocurrency in an attempt to increase its price (also known as spoofing).
-
Hide nefarious activity, such as massive selling (or dumping) of a particular cryptocurrency.
-
Increase the trading fees an exchange reaps by inflating the volume of trades.
The Commodity Exchange Act (CEA), passed in 1936, made wash trading illegal in the United States. Other countries have similar laws, but many jurisdictions and therefore exchanges have lax policies regarding wash trading.
Whales
As the largest holders of crypto, whales can have an unpredictable impact on the market. Whales are different from institutional investors in the cryptocurrency world. Unlike asset managers like Fidelity, whales can move funds on a whim. Traditional asset managers operate in a highly regulated environment and have many restrictions they need to follow before moving funds. Crypto whales just need a private key, a computer, and the internet. These movements are easily seen on the blockchain and can result in price changes as traders attempt to decipher what they mean.
Exchanges, custody providers, and even Satoshi Nakamoto can be considered whales because the holdings these entities have are so significant. Movement of funds by whales can signal market changes. For example, movement of old coins has in the past caused market movements.
Whales also have the ability to control cryptocurrencies with a low market capitalization, which is the price of an asset times its outstanding supply. A whale that owns a large amount of a particular cryptocurrency with a small capitalization is able to control the price. This is done by creating buy and sell “walls” on exchanges (see Figure 6-6).
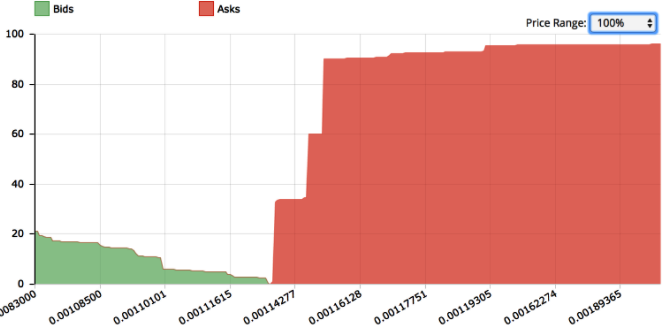
Figure 6-6. A sell wall on a cryptocurrency depth chart
These walls are caused by large numbers of bids or asks, to prevent a certain asset from moving one way or another. However, when there is interest in a particular cryptocurrency, they can be broken. These walls, caused by coordinated buying and selling by a group of participants to manipulate prices, are often what create huge price gains or losses that occur in some smaller cryptocurrencies.
Derivatives
As financial products that allow investors access to the underlying value of cryptocurrency, derivatives are increasingly becoming an important part of the ecosystem. Here is a summary of some of the important terms used in discussing derivatives:
- Options
- Contracts give traders the right but not the obligation to profit from a rise in the price of the asset (call) or profit from a decrease in the price of the asset (put). In the case of cryptocurrencies, options allow traders to better manage risks in the market. The options landscape in cryptocurrency markets is still nascent due to regulatory reasons but is expected to grow over the next few years.
- Futures
- Bitcoin futures allow businesses that receive their income in bitcoin to lock in the price of the cryptocurrency at some future time. In this way, these businesses will not be subjected to volatile price movement that might affect their revenue. Common users of futures contracts include bitcoin miners, who may use them to protect their revenue, and speculators. The major providers of bitcoin futures include commodities stalwart Chicago Mercantile Exchange (CME) and Bakkt.
- ETFs
- Exchange traded funds, or ETFs, are products that give investors access to an asset or mix of assets managed by another party for a fee. For cryptocurrencies, this would mean a fund manages the cryptocurrency for the investor. In the US, there has not yet been approval for these types of investment vehicles, although in places like Europe there are similar structures available (known there as exchange traded notes, or ETNs).
- Margin/leveraged products
- Many exchanges allow traders to trade on margin, where credit is provided to an investor for putting up some amount of value, known as collateral. On regulated exchanges, this is usually between 5 and 10 times a trader’s balance. However, some exchanges allow for up to 100 times margin. This can be dangerous, as very small price swings can result in autoliquidation. Similar to a margin call, an autoliquidation will quickly wipe out a trader’s balance.
Note
Be very careful using margin. It may not provide much leverage in trades, and it can prove a quick way to get totally liquidated in the crypto market.
Cryptocurrency Market Structure
As a whole, the cryptocurrency market lacks the market depth, or the ability to absorb large orders, that is seen in traditional markets. There are several reasons for this. One is the relatively small number of traders compared to other markets. Another is that regulatory issues surrounding cryptocurrency make it difficult to trade against fiat currencies.
Arbitrage
As mentioned previously, arbitrage is the act of purchasing an asset in one market at one price and selling the same asset in another market at a higher price, thus exploiting the difference in prices between markets. This is a common occurrence in cryptocurrency trading.
Arbitrageurs serve an important purpose in the trading community. They help remove price differences and increase liquidity, or volume of activity, making the ecosystem less volatile. For example, imagine the price of bitcoin ranges from $9,800–$10,000 across one hundred exchanges. How do you know what the actual price of bitcoin is? Arbitrageurs help reduce that variance in price.
Arbitrage is often an appealing trading strategy because of its relatively low risk profile. In arbitrage, there is no risk involved in estimating what cryptocurrency prices will be in the future. Traders only take action based on what the price is right now. The biggest downside to arbitraging is that the barrier to entry is fairly low. If opportunities exist, you will find competition with many other traders, which can lower margins.
We’ll discuss arbitrage trading in a little more detail later in this chapter.
Counterparty Risk
Arbitrage requires leaving large amounts of capital on one or more exchanges. The larger the scale of revenues gained from arbitrage, the more capital is required. One of the biggest risks in arbitrage is trusting your capital to the exchanges that maintain custody of those funds. To quote a phrase popularized by early cryptocurrency proponent and Mastering Bitcoin author Andreas Antonopoulos, “Not your keys, not your money.”
Note
Since 2010, a steady stream of exchanges have been hacked or have shut down and lost customer funds, making this risk fairly high. See Chapter 9 for more on this.
Building an exchange custody infrastructure that is highly secure from hacks requires the following:
-
A lot of technical resources
-
Auditing by multiple security groups
-
Well-defined and well-thought-out corporate governance processes
Many well-established exchanges—for example, Coinbase Pro—have had the time and resources to build robust solutions. They are still around today because they have kept their customers’ funds secure. Newer exchanges following proper security practices should cut no corners when it comes to custody solutions. Using well-established custody services like BitGo can help. These custody providers can help with key management, educate the exchange on proper security practices, and even provide an insurance policy for funds that are in their custody.
Each exchange has a different custody setup. Figure 6-8 shows a standard arrangement.
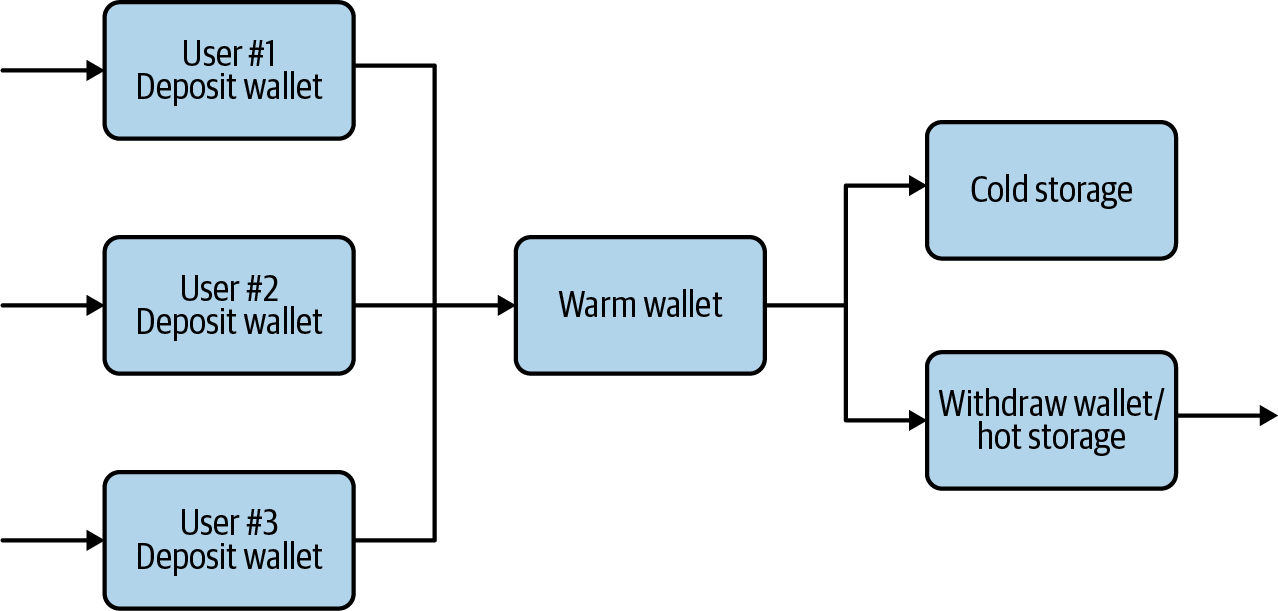
Figure 6-8. How custody might work on an exchange
Let’s walk through how this works, and go over some of the key terms.
When an exchange user wants to deposit funds into an account, they send the funds to a deposit address. An exchange gives a separate deposit address to each user. This lets the exchange know which user to credit funds to as they come in.
As funds are deposited into an exchange through user deposit addresses, they are automatically swept to the warm wallet, which can only send funds to whitelisted, or predetermined, addresses. The warm wallet then distributes the incoming funds to either the hot storage wallet or cold storage wallet, depending on the exchange’s need to top up the withdrawal wallet with more funds.
Cold storage refers to storing cryptocurrency holdings and private keys offline, in a location that is not connected to the internet. For example, the private keys might be printed on a piece of laminated paper sitting in a bank vault. The process to generate the signature that authorizes funds to be sent from an address whose private key is in cold storage is also completed offline, using an airgapped computer—that is, a computer that has never been connected to the internet. Once the signature is generated, it is manually entered onto a machine that is connected to the internet, which broadcasts the transaction request to the blockchain network. This can be done in two ways:
-
On an airgapped computer, save the signature into a text file, then copy the text file onto a formatted and cleaned USB stick. Then put the USB stick into an internet-connected computer, and broadcast out the transaction with the signature from that computer. Wipe the USB stick.
-
Write down the signature on a piece of paper, then manually type it in on an internet-connected computer. Destroy the paper.
Keeping the private keys disconnected from the internet means a person has to be physically present to access them. This makes it impossible for the private keys to be copied by a hacker over the internet, or compromised through a virus, malware, keylogger, or other exploit. There are still ways to break in, but they involve physical theft.
The downside to cold storage is that because human intervention is required, a transaction can take on average 24–48 hours. But when an exchange user withdraws cryptocurrency funds from their account, they normally expect those funds to be withdrawn within minutes. That means exchanges need to have funds sitting in a hot storage wallet, or withdrawal wallet, that allows for instant withdrawals. The advantage of hot storage is that blockchain transactions can be initiated instantly by a machine, without requiring human intervention.
Hot storage is the cryptocurrency equivalent of a bank branch keeping stacks of cash locked away in a back room—an amount that should be enough to satisfy daily customer demand for cash. The disadvantage, of course, is that the private keys are sitting on a machine that is connected to the internet, and that makes it possible for hackers to compromise them (like gaining access to the back room). Exchanges must therefore take extreme care to ensure the security of these keys.
Here are some other concepts to be aware of:
- Less than 5% rule
- Common practice is for exchanges to keep over 95% of customer funds in cold storage, and under 5% of funds in hot storage. That way, if hackers compromise an exchange, they will only be able to steal the funds sitting in hot storage. Losing that amount will likely hurt the exchange’s bottom line, but is unlikely to force it to totally shut down.
- Whitelisting addresses
- It is important that exchanges configure all incoming wallets to only be allowed to send funds to the warm wallet. This practice is known as whitelisting. This is so if a deposit wallet is compromised, the hacker can only send funds to that address (or any others on a predetermined set of whitelisted addresses), which is problematic for an attacker.
- Signs of illiquidity
- One warning sign that could signal that an exchange is in trouble and might shut down is when users consistently see long delays in withdrawing funds. Delays could be caused by a technical issue, but they are often a symptom of an exchange that is close to default (the inability to issue funds on demand). For example, during the years when Mt. Gox operated, most users did not complain about slowness in withdrawing funds. But during the weeks leading up to the exchange shutting down, user withdrawal requests began taking significantly longer to process, sometimes requiring days to fulfill. Delays in honoring customer requests for withdrawals is a symptom that the exchange is illiquid and does not have custody of users’ funds anymore. This is a problem that is difficult for an exchange to hide from users.
Market Data
Accurate data can be hard to come by. Different sources may provide different data, for example, on cryptocurrency market capitalizations and prices. Two sources may even be in stark contrast, with a differential of billions of dollars. That’s why it’s vital to be familiar with different cryptocurrency market data sources.
There are tons of general sources for market information today. Here are a few of the most well-known data sources:
Each offers different datasets and tools.
There are also specialized cryptocurrency information sources that it’s good to know about, such as block explorers and transaction flow tracking systems.
Block explorers
A block explorer enables the user to see all on-blockchain transactions by examining the contents of each block in the chain. Users look up the details of any recent or historical transaction on a blockchain using its transaction ID and view all the transactions made by a particular address. Block explorers also link addresses to other transactions; by viewing one address, it is possible to see transactions made by another address. In the cryptocurrency world, a block explorer can let you peer into the blockchain transactions to see what is (and has been) taking place.
Tip
For bitcoin transactions, Blockchain.com is the most popular block explorer. For Ethereum and ERC-20 tokens, Etherscan.io is the predominant explorer.
Using block explorers can help identify cryptocurrency movements. However, many exchanges do not record transactions between internal wallets on-chain, and therefore, fund flows are often hidden until a transaction with an external party (an outside exchange or wallet) is completed.
Transaction flows
The ability to track transaction flows on the blockchain can help when analyzing trading patterns. Tracking the movement of cryptocurrency can be much easier than tracking fiat currency. This is especially true when transfers are happening between wallets, exchanges, and other services because these transactions occur on-chain.
GraphSense is an open source tool by the Austrian Institute of Technology that enables cross-ledger analytics on blockchain flows, with support for Bitcoin, Bitcoin Cash, Litecoin, Zcash, and more. Whale Alert offers a free basic API to track many different cryptocurrencies, including the top 100 ERC-20 tokens. It also has a Twitter account, @Whale_Alert, that tweets large transactions.
Analysis
In cryptocurrency markets, traders use several methods of market analysis in order to try to make money. The two major types of analysis used to make decisions are technical analysis and fundamental analysis. Some traders use both kinds, whereas others are ardent supporters of just one.
Briefly, fundamental analysis involves measuring a cryptocurrency’s value by examining related economic and financial factors. It takes in all the available information about the cryptocurrency, including news, foundation reports, technical roadmaps, and extrapolations like expected user or network growth.
Technical analysis involves a chart-focused approach to measuring a cryptocurrency’s value. It’s based on market data and specific indicators related to how a cryptocurrency trades and its past performance.
Let’s take a closer look at the two different approaches.
Fundamental Cryptocurrency Analysis
Monitoring cryptocurrency foundation reports that steer development, user adoption figures, and news about regulatory developments helps with fundamental analysis in the short term. For the long term, two comparisons can be made: are cryptocurrencies Tulip Mania or the internet? The argument references two very different points in the history of financial markets.
Tulip Mania or the internet?
In the seventeenth century, Holland was in what was called its Golden Age, a time when the country ranked among the best in the world in the sciences, trade, and art. During that time, a speculative rush on tulip bulbs occurred, mainly due to the scarcity and rarity of certain flowers’ colors. There were many varieties of tulips available on the market, and in some months their prices appreciated over 1,100%. This created a huge run-up in the market, followed by a total bottoming out that led to gigantic losses for some investors. Figure 6-9 shows the rise and fall of tulip prices during what became known as Tulip Mania.
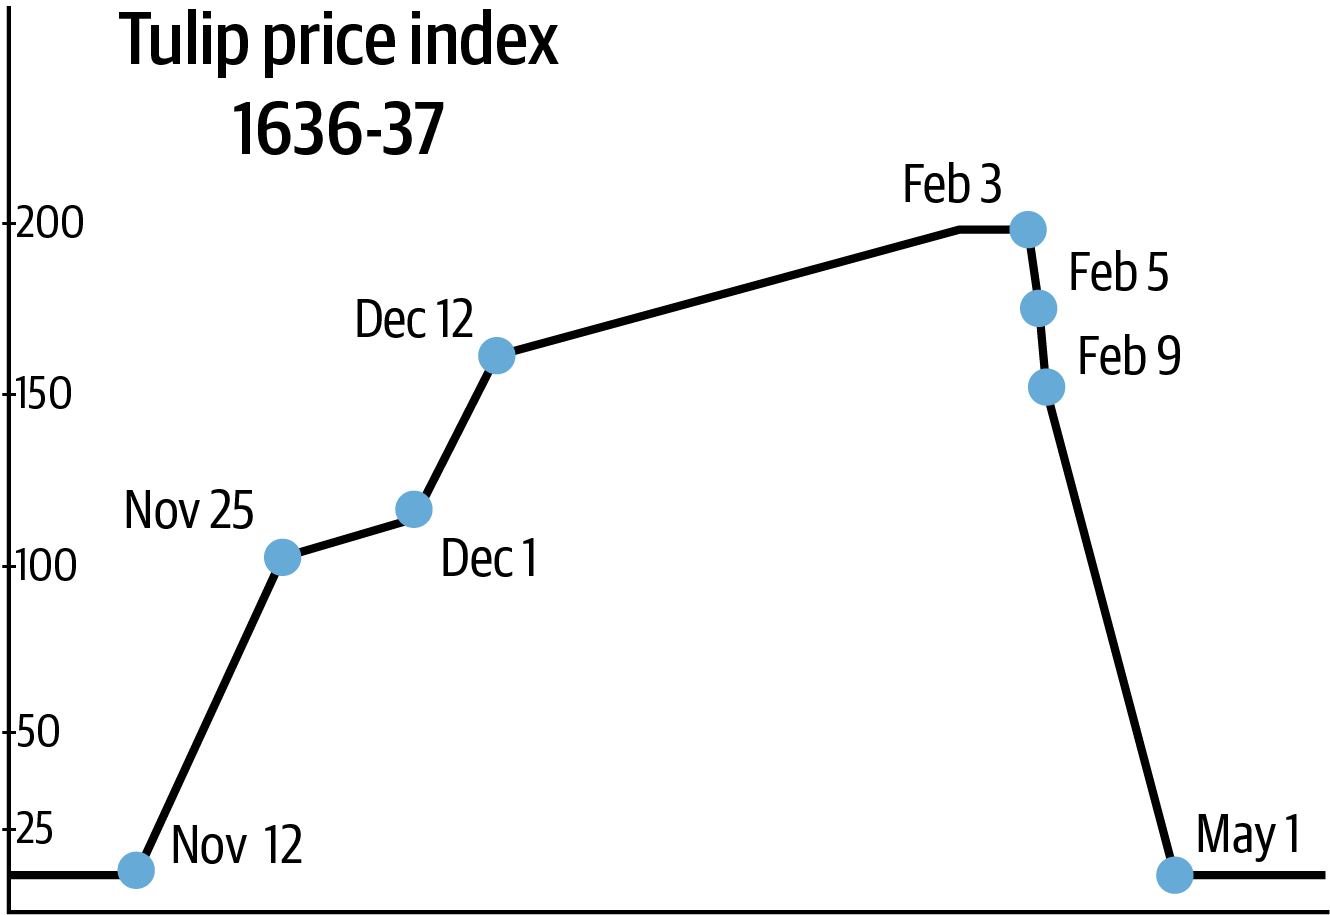
Figure 6-9. Market rise and fall during the Dutch Golden Age’s Tulip Mania
In the 1990s, people invested fortunes in seemingly any publicly traded company with “.com” in its name. This investment was fueled by low interest rates, which encouraged people to borrow and spend. Prices went up and up, eventually leading to the so-called dot-com crash, where the bottom fell out of the market and many companies were wiped out (see Figure 6-10). While there were gigantic losses for many investors, some of these dot-com companies did survive and thrive—most notably Amazon, which transformed itself from an online bookseller into a retail and computing infrastructure behemoth.
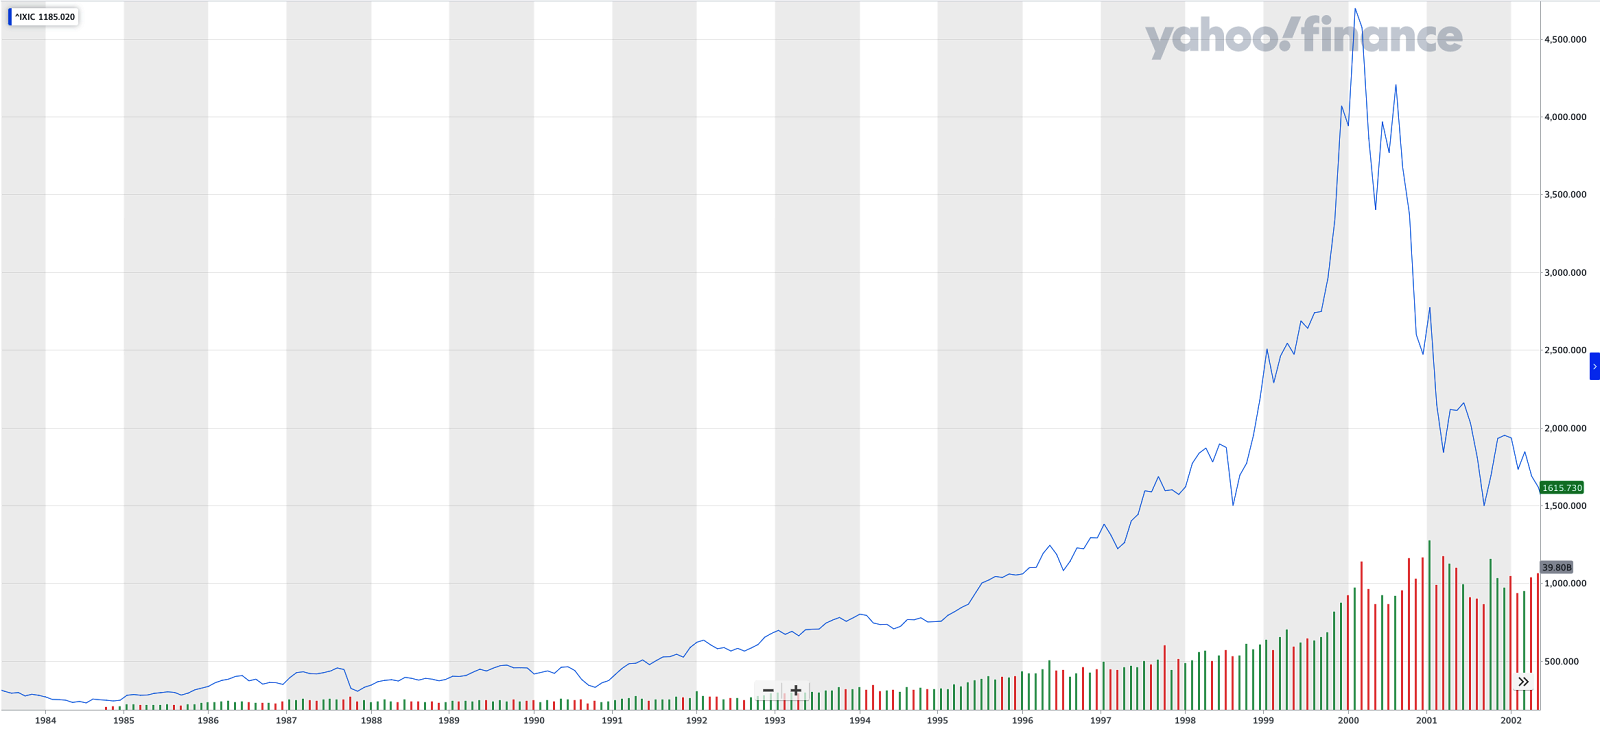
Figure 6-10. Graphs of the NASDAQ dot-com crash
Why are we bringing up these two seemingly unrelated events? A fundamental argument held by many investors in the cryptocurrency market revolves around these two crashes. Whereas the tulip market never flourished like that again, the internet came back, fueled by emerging technologies that did not exist in the 1990s, such as the dynamic web, smartphones, and social media.
The question is: does cryptocurrency have a long-term future? A number of economists don’t believe the cryptocurrency market is as unbridled as some may think—including Cornell’s Joseph Stiglitz, who believes government will heavily regulate cryptocurrency. The reality today is that the main use case for cryptocurrency is speculation, which is why an examination of markets is important.
Tools for fundamental analysis
Fundamental analysis requires reviewing news and analysis sources. There are a number of established outlets in the traditional media that do a good job of reporting on cryptocurrency. Others are a good deal shadier, and feature news stories that are slanted toward advertisers.
“Pay-to-play”—paying a significant fee to be featured in a seemingly unbiased news story—is rampant in the cryptocurrency industry. One reporter reached out to cryptocurrency news sites and found many of them were willing to take money in return for favorable coverage. Sometimes these news outlets would request thousands of dollars for a positive story, which shows the kind of shadow market for disinformation that exists in the industry. Figure 6-11 shows the prices some outlets wanted to charge for a favorable story.
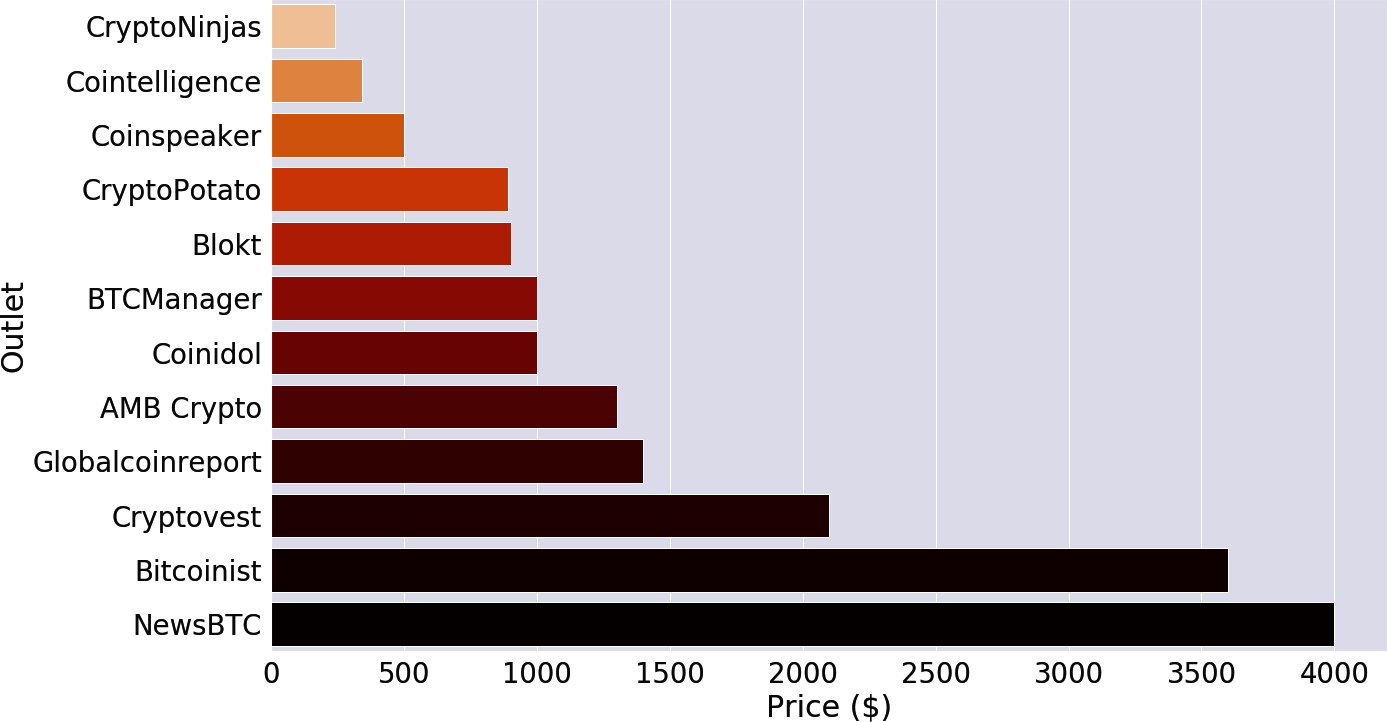
Figure 6-11. Pay-to-play
Social media can be a tool for news gathering, but it should be taken with a grain of salt. On Twitter, there are entire campaigns meant to influence thinking on bitcoin, XRP, and many other smaller cryptocurrencies.
Some crypto communities on Reddit are censored to remove any critical information. It’s important to keep this in mind when looking for accurate fundamental information regarding various cryptocurrency projects. Very few information sources are immune to this issue, which requires traders to be vigilant about verifying data!
Technical Cryptocurrency Analysis
Cryptocurrencies have pricing datasets that can be extrapolated into charts. These charts allow traders to analyze past history in order to determine future prices. As mentioned in the previous section, in the cryptocurrency world it can be hard to find reliable sources of information for fundamental analysis. Therefore, the use of technical analysis is helpful for many to properly evaluate the movements of the cryptocurrency markets, which can be quite volatile at times. There is even a subset of traders that can detect where asset prices will move using only charts, avoiding any fundamental analysis.
Charts for technical analysis
The best tools for technical analysis are chart-based. TradingView, a charting tool that is also used by stock market chartists, has done a good job of integrating a variety of cryptocurrency exchange data sources. It also has a number of tools that technical analysts use, including moving averages, volume indicators, and various oscillators. TradingView is free, and with an email signup allows users to save charts.
Hunting for Bart
Technical analysis requires looking at patterns, and there are some unique ones when it comes to cryptocurrency. The most famous is the Bart pattern, which bears a striking similarity to the top of Bart Simpson’s head, as shown in Figure 6-12.
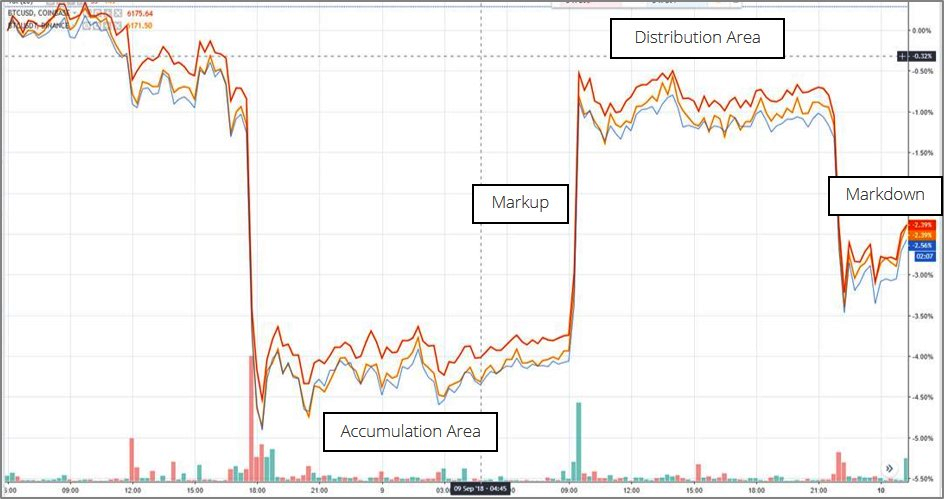
Figure 6-12. The famous Bart pattern
Technical analysts will say that this process of analysis is more art than science. While it cannot predict the future, it is sometimes able to provide indicators to help traders make decisions. A number of factors go into making these decisions, and it’s up to traders themselves to figure out how to act.
The Bart pattern in cryptocurrency offers an instructive lesson about the nature of this market. Cryptocurrencies are still quite new, and there aren’t as many market participants as many would believe. Because of this, the depth, or amount of liquidity in the market, is low, also known as thin. Crypto is thus said to be a thinly traded market. This lack of liquidity contributes to Bart patterns; because the order books on cryptocurrency exchanges are not as deep as in traditional markets, prices can move quickly.
Arbitrage Trading
We mentioned arbitrage earlier in the chapter. Here we’ll take a deeper look, with a few examples of how it works.
A basic arbitrage is buying and selling an asset using two different markets. For example, if there was a 1% arbitrage spread between the bitcoin buy price on Coinbase Pro and sell price on Gemini, a trader might:
-
Buy 1 bitcoin from the USD/BTC market on Coinbase Pro for $10,000 USD.
-
Immediately sell 1 bitcoin on the USD/BTC market on Gemini for $10,100 USD.
This would lead to revenue gain of $100, minus fees.
A triangular arbitrage involves buying and selling the asset using three or more different markets. For example:
-
Buy 1 bitcoin from the USD/BTC market on Coinbase Pro for $10,000 USD.
-
Trade 1 bitcoin for 70 ether on Coinbase Pro.
-
Sell 70 ether on Gemini for $10,200 USD.
This would lead to revenue gain of $200, less fees.
Timing and Managing Float
In order to execute arbitrage strategies, a float, or liquid pool of funds ready to trade, is required. This float sits on various exchanges and is used at the moment an arbitrage opportunity is presented.
When an arbitrage opportunity arrives, it is imperative to complete all of the steps in the arbitrage as quickly as possible, for two main reasons:
-
Pricing on exchanges may change quickly.
-
Others may take advantage of the opportunity, driving spreads down.
Generally, the more float that is reserved for arbitrage, the faster the execution. However, there is an opportunity cost (and risk) to just leaving capital sitting around waiting for a potential future opportunity. It is important to identify which markets and arbitrage paths to target because there will always be a limit to the amounts of funds, or float, available on hand at any given time.
The next subsections look at a few possible configurations to setting up the float for arbitrage.
Float Configuration 1
Configuration 1 reserves $50,000 USD to sit on Coinbase Pro and 5 BTC to sit on Gemini. When an arbitrage opportunity between these two markets becomes available, this configuration allows for instant execution. This is because the float means the arbitrageur can purchase the bitcoin instantly on Coinbase Pro and sell it instantly on Gemini. However, the speed of arbitrage execution is completely dependent on the exchange receiving and fulfilling trade API calls.
After arbitrage is executed, there is a change of balance for all exchange accounts. If there is continuously an arbitrage opportunity going in this same direction (for example, a lower buy price on Coinbase Pro and a higher sell price on Gemini), then eventually there will be an imbalance of float, where one exchange has more funds than the other. This imbalance means the trader will be unable to purchase bitcoin on Coinbase Pro, or sell bitcoin on Gemini. Therefore, some decisions must be made to continue using the float for arbitrage. A trader could do the following:
-
Rebalance the float by transferring 5 BTC from Coinbase Pro to Gemini, and transferring $50,000 USD from Gemini to Coinbase Pro. Transferring 5 BTC between exchanges is simple and takes about an hour to complete. Transferring $50,000 USD between exchanges happens through the banking network and therefore requires a bank account. Some banks have the ability to transfer easily between exchanges. Research the available options.
-
Wait for an arbitrage opportunity in the opposite direction. This means buying bitcoin at a low price on Gemini and selling it at a higher price on Coinbase Pro.
Float Configuration 2
Configuration 2 reserves $50,000 USD to sit on Coinbase Pro and does not require any float to be sitting on Gemini. Since there is no float sitting on Gemini, when an arbitrage opportunity becomes available between these two exchanges, an extra step is required: a transfer of funds from Coinbase Pro to Gemini must be executed.
In this example, when an opportunity becomes available, the arbitrageur does the following:
-
Purchase 1 BTC on Coinbase Pro.
-
Transfer the 1 BTC from Coinbase Pro to Gemini.
-
Sell the 1 BTC on Gemini at a price 1% higher than it was purchased for on Coinbase Pro.
The biggest risk in configuration 2 is that transferring the BTC to Gemini takes about an hour to complete. During that window of time, the sell price of BTC on Gemini will likely change, and it’s possible the trader may be forced to sell that 1 BTC at a loss.
Even though configuration 2 requires much less capital to execute, in the case of bitcoin the lack of a float introduces a significant delay, increasing the risk of losing money. One way to mitigate this risk is by arbitraging other cryptocurrencies. Here are a few examples of time delays you might encounter:
-
Bitcoin block times on average are 10 minutes, and exchanges often require 6 confirmations to credit funds, totaling 60 minutes to transfer funds.
-
Ethereum block times on average are 15 seconds, and exchanges often require 30 confirmations to credit funds, totaling 7.5 minutes to transfer funds.
-
Ripple block times on average are 4 seconds, and exchanges often credit funds as soon as their system sees the transaction processed. Depending on the exchange, the transfer time is often 30–60 seconds.
Float Configuration 3
The most effective way to mitigate the risk of time lost moving funds between exchanges is by completing the entire arbitrage on one exchange. This can be done using triangular arbitrage on an exchange with multiple markets, assuming that the buy and sell rates at each step are favorable.
Here the arbitrage is executed using only markets that are on Coinbase Pro:
-
USD/BTC market: Buy 1 BTC for $10,000 USD.
-
BTC/ETH market: Trade 1 BTC for 70 ETH.
-
ETH/USD market: Sell 70 ETH for $10,200 USD.
This would eventually lead to a $200 USD gain, minus fees, after completing all of the steps in the arbitrage.
In 2012, when the industry was in its infancy, arbitrage opportunities for bitcoin went as high as 30% spread across some exchanges. In 2020, there are many more arbitrageurs, and hidden behind the opportunities are various challenges (outlined in the next section). Often the cost of overcoming these challenges is higher than the reward of the arbitrage opportunity, which is likely to fall into the range of 0.1% to, at most, 10%—still, even today opportunities do exist.
Regulatory Challenges
Exchanges that are compliant with regulations follow the laws of the country they operate out of, and laws differ between countries. For example, most exchanges around the world can service customers who reside in other countries. However, exchanges in South Korea, for example, can only service customers who reside in that country. The South Korean government has banned exchanges from servicing foreigners. In addition, South Korea has capital controls that limit the amount of funds that can leave the country.
During bitcoin’s bull run in 2017, these factors led to a long-sustained “Kimchi Premium” in South Korean exchanges, which often saw selling prices 5–10% higher than exchanges in other countries.
Banking Risk
When performing arbitrage that involves fiat, a bank account is required to shift the funds between exchanges. Internationally, there has been a trend by regulators and banks to impose stricter Anti-Money Laundering (AML) and Know Your Customer (KYC) rules, which are further discussed in Chapter 9. These rules significantly increase the barriers for new cryptocurrency businesses to open a bank account. For example, in Canada only two of the big five banks will even consider opening a new account for a money services business. In the US, only a handful of firms will open bank accounts for cryptocurrency businesses.
When banks audit transactions, they consider the following properties as indicative of increased risk of fraud:
- Funds being sent to/received from another country
- There are international organizations like the Financial Action Task Force (FATF) that provide a risk ranking for each country. For example, Syria has seen sanctions and a heavy presence of ISIS; it would thus be considered a high-risk country.
- High-volume transactions
- One of the biggest fears a bank has is being mentioned in the news for facilitating fraudulent activity, but the risk of this is low if the scale of funds moved is low. In addition, it is mandatory for banks in most countries to submit suspicious activity reports to the government for any transaction above a certain threshold. In the US, any transaction over $10,000 USD must be reported to the Financial Crimes Enforcement Network (FinCEN).
- Anything related to cryptocurrency
- The banking view of cryptocurrency is still that it is often used for nefarious purposes. Many international news stories about cryptocurrency are related to unscrupulous or illegal activities. These activities may include selling drugs, forcing ransomware payments in crypto, and North Korea evading sanctions.
Note
Arbitraging fiat, at scale, between cryptocurrency exchanges in different countries can raise all three of those flags. Using a bank not friendly to cryptocurrency involves risks. Anytime, without notice and for reasons outside your control, the bank could freeze your funds or reverse your transactions.
Basic Mistakes
Basic arbitrage mistakes include:
-
Forgetting to include trading fees and taxes in arbitrage calculations
-
Only looking at the ticker price when calculating arbitrage opportunities
It’s not enough to consider the difference in price when calculating opportunities; it’s also important to consider the market depth by looking at the volume of funds sitting on the order book at each price, to ensure slippage does not negate your profits or turn them into losses.
Exchange APIs and Trading Bots
A large amount of crypto trading is executed by trading bots. But no matter how good a trading bot is, its performance relies heavily on the exchange APIs that it integrates with.
Every exchange began as a small startup and tried to build a high-quality API, though good documentation is usually not a priority. Banking, regulation, wallet custody, and getting liquidity usually are high priorities. After an exchange reaches a certain point in its business, when it is flush with cash, it can hire the right technical talent, and the quality of its API will improve dramatically.
The best exchanges build their websites and mobile apps using the same APIs they provide for third-party developers. Not all exchanges are created equal, however, and it’s important to test basic API functions prior to real-time trading.
Characteristics of a high-quality API include the following:
-
Runs on powerful servers with fast network connectivity
-
API calls are designed to accommodate many different trading strategies
-
Support for both REST (pull) and WebSockets (push)
-
High rate limits
-
Follows industry-standard security schemes, such as OAuth 2, popularized by Facebook, or HMAC, which uses hash computation
-
Documentation is presented in a clear, concise, and consistent manner with examples for each API call
-
Provides a test/staging environment
-
Provides libraries for many different coding platforms
-
Real-time communication on the status of the platform, and transparency with regard to incident management
Two examples of exchanges that have gained enough resources to build a high-quality API are Coinbase Pro and Kraken.
One of the first things a developer will try when evaluating an API is to perform a basic call that requires the least amount of effort possible. For example, looking up the current BTC/USD ticker price doesn’t require any setup, as that data is public.
On Coinbase Pro, the BTC/USD ticker API call looks like this:
Request:
    GET - https://api.pro.coinbase.com/products/BTC-USD

Response:
{
    "id": "BTC-USD",
    "base_currency": "BTC",
    "quote_currency": "USD",
    "base_min_size": "0.00100000",
    "base_max_size": "280.00000000",
    "quote_increment": "0.01000000",
    "base_increment": "0.00000001",
    "display_name": "BTC/USD",
    "min_market_funds": "5",
    "max_market_funds": "1000000",
    "margin_enabled": false,
    "post_only": false,
    "limit_only": false,
    "cancel_only": false,
    "trading_disabled": false,
    "status": "online",
    "status_message": ""
}
On Gemini, the BTC/USD ticker API call looks like this:
Request:
    GET - https://api.gemini.com/v2/ticker/btcusd

Response:
{
    "symbol": "BTCUSD",
    "open": "9179.77",
    "high": "9298",
    "low": "9050",
    "close": "9195",
    "changes": [
        "9219.54",
        "9211",
        "9211.71",
        "9243.67",
        "9243.71",
        "9250",
        "9249.03",
        "9235.41",
        "9237.69",
        "9244.22",
        "9244.68",
        "9240.38",
        "9248",
        "9263.61",
        "9289.8",
        "9291.62",
        "9269.68",
        "9222.01",
        "9210.09",
        "9160.63",
        "9165.4",
        "9152.46",
        "9164.7",
        "9173.33"
    ],
    "bid": "9195.00",
    "ask": "9195.01"
}
Even with something as simple as a ticker API call, you can see big differences in the response data. Amongst these, Coinbase Pro’s API includes a status field that allows the bot to recognize when the market is unavailable for trading and adjust accordingly, while Gemini’s API includes changes, an array showing the previous prices for this trading pair. This can allow a trading bot to recognize a trend in the price.
These are two exchanges in the US with significant resources, and as you can see, their APIs are quite different. There are hundreds of exchanges all over the world with even greater variance in their API schemes and quality. Developing a trading bot that integrates into multiple exchanges therefore requires a lot of time and effort.
The remainder of this section introduces some of the things to keep in mind when using trading bots and dealing with APIs.
Open Source Trading Tech
It’s a lot faster for a developer to integrate with an exchange’s API using an existing library that they can include into their code. In this way, they can adopt existing code that already integrates with all the exchange’s API calls and navigates the API’s security. Without such a library, the developer is required to write up and test a lot of extra code themselves.
There are some open source projects with trading tech that are helpful to get started trading with APIs. One of the most popular projects is the CryptoCurrency eXchange Trading Library (CCXT), which enables developers to integrate with over 125 cryptocurrency exchanges. Using this library means a developer does not have to learn the nuances of each exchange’s API, or write custom code for each exchange. Rather, the library provides one unified set of calls to integrate with many exchanges.
All public calls do not require the developer to have an account on the exchange. Public calls enable the reading of public information, such as the market price for BTC/USD. All private calls do require that the developer provide an API key from the exchange, which requires account setup. Private calls allow the reading/writing of private information. Examples of private calls include getting an exchange user’s open limit orders or initiating a market order.
Some important API calls to get started include the following:
-
Retrieving ticker prices (public)
-
Retrieving order book data (public)
-
Retrieving account trade history (private)
-
Transferring funds between trading accounts (private)
-
Creating, executing, and cancelling orders (private)
Rate Limiting
Every exchange API will have a limit to the number of requests that can be made from an external server. Each call made to the API server uses up server resources, and the rate limit forces external servers to not abuse API access. It also provides a layer of protection from DDoS attacks, which are very common in this industry.
For example, Coinbase imposes a limit of three requests per second for some API endpoints, or communications channels, and five requests per second for other endpoints. The external server will get a 429 error when it makes a request that has exceeded the limit.
REST Versus WebSocket
Speed is an important factor in building a high-quality trading bot, so that the bot can read the market and execute trades before others can. With a REST API, the trading bot must continuously poll the API to view the latest state of the market, which often leads to gaps of time between a change occurring in the market and the trading bot seeing that change. These gaps increase significantly when the trading bot is rate-limited and has to wait a split second until it can make a valid request.
A faster way for a trading bot to view the current state of the market is by subscribing to a WebSocket. With this setup, as soon as a change occurs in the market, the exchange’s server pushes a notification to all subscribers of the WebSocket. Then all trading bots subscribing to the WebSocket will receive the same information at the same time, and they do not need to make additional API requests that will fill their rate limit quotas.
Tip
It can be helpful for traders to find out the exact location where the exchange hosts its API server, and host their trading bot in the same location. For example, if the exchange’s API server is hosted on AWS in the Northern Virginia region, a trader could host their bot with AWS in the same region to ensure faster communication.
Testing in a Sandbox
When developers are testing various features of a trading bot, ideally they should do the testing in a sandbox environment using fake money. If an exchange’s API does not have a sandbox environment, developers are forced to test out functionality using real money, which often limits the testing capacity of a trading bot. It’s usually too risky to test out new features using real dollars that could easily be lost to a bug.
Market Aggregators
There are some services, like CoinMarketCap and CoinGecko, that aggregate market pricing from hundreds of exchanges and package out this data to an API. The advantage of such an API is that it makes it easy for a trading bot to get a high-level view of the market. The downside is that relying on a third party to aggregate the data causes a delay in the aggregator’s pricing data—plus there is a risk that there could be mistakes in the aggregator’s API, and it will send incorrect data.
Summary
The cryptocurrency markets are a fascinating window into what happens in a nascent ecosystem when regulatory structures have to catch up. The opportunities that exist in this space are what bring a lot of new entrants into the blockchain world. Speculation due to these markets being in their infancy draws the interest of many people, as price remains a singular motivator.
These markets are subject to quick changes. Still, the information covered in this chapter should help developers and traders alike with lots of ideas on how to get started.