CHAPTER 10
Market Cycles and Valuations
Since starting GuruFocus, I have often been asked by friends or users what the stock market will do this week, this month, or this year. I wish I had a better answer than J. P. Morgan's “It will fluctuate.”
To value investors, there is no stock market. There is just a market of stocks in which investors can trade. Stock market moves are the collective movements of individual stocks. Yet, many players are guided by what others do in the market, and their movements form a tide resembling a stock market. Also, as more investors trade market index ETFs and care little about the individual stocks within the ETFs, the stocks tend to move together in one direction. That is probably the stock market that people talk about.
Though I don't know where the market will go in the short term, I have learned a few things about the stock market that I consider important even for value investors who don't pay too much attention to the overall market: (1) over the long term, the stock market always goes up; (2) the stock market has cycles; and (3) higher current market valuation results in lower returns in the future and vice versa. Having a good understanding of these principles can be useful during extreme times.
Over the Long Term, the Market Will Always Go Up
Over the long term, the stock market as a whole always goes up. This seems obvious. But investors tend to forget it when things get scary; it is during these tough times that investors most need conviction and optimism. The direction of the stock market is nothing but ups and downs of the total market value of the companies that supply us with what we need in life, directly or indirectly. Over time, these companies will produce more products and provide more services due to the growth of the population and the improvement of living standards. The average prices of their products will go up due to inflation. The overall revenue and profit will increase, and they will be worth more over time.
At times, the market value has gone down, sometimes by a lot, or has hovered around certain levels for a long while. Market crashes can be painful. The media make it sound like the world will end and everything will go to zero. But if we look back, every one of these crashes posed opportunities to put money in stocks for great returns. Undoubtedly, the market will crash again, but over the long term, humans will consume more products and services than they do today. The economy will generate more profit and become more valuable. Investment return is inversely proportional to the price you pay. The lower the price you pay, the higher return you get. A stock market crash is nothing but a time when others are willing to sell their shares that will be worth more on the cheap, presenting you with opportunities for hefty returns. Buying when the mass is selling makes a significant difference on your investment returns.
That is how Baron Rothschild made his fortune in the eighteenth century. He famously said: “Buy when there's blood in the streets, even if the blood is your own.” Sir John Templeton made a killing by buying 100 shares of each NYSE-listed company that was selling for less than a dollar during the Great Depression.
Both Templeton and Warren Buffett predicted that by the end of the century, the Dow Jones Industrial Average will be above 1,000,000. Currently, the index is around 20,000; 1,000,000 seems like an astronomical number, but it takes an average gain of only 4.8 percent per year for the Dow to reach that level by the year 2100, which is far below the average gain of the Index over the past century.
Of course, most of the people who read this book will not be around by the year 2100. As John Keynes said, “In the long run we are all dead.” But all of us will be able to ride part of the trend to the Dow reaching 1,000,000. Over the long term, the market always goes up. Though maybe simple and obvious, this is extremely important to remember when you feel the need to act from fear.
It Will Be Cyclical
Though the market will assuredly be higher in the future, the ride won't be smooth. It will always go through cycles of extreme rollercoaster ups and downs, except this ride will end at gradually higher levels. People tend to forget that the sun will come out again during times that seem endlessly dark; they also forget that bright daylight doesn't last forever during good times. It is cyclical.
Howard Marks likens the stock market to a pendulum that swings between the extremes of euphoria and depression, or overpriced and undervalued.1 Just like a physical pendulum, the market spends the least amount of time in the middle. Since the end of World War II, there have been ten bear markets—defined as declines of 20 percent or more in the S&P 500 Index. Additionally, the market has had 24 corrections—defined as declines of 10 percent or more in the S&P 500 Index. It has gone through just as many bull markets, with periods during which the S&P 500 doubled without correction.
The main reason the stock market is cyclical is that the underlying economy is cyclical, driven by human behavior. Figure 10.1 shows the S&P 500 Index, the historical U.S. corporate after-tax profit margins, and recession periods since World War II. Clearly, the profit margins of U.S. corporations are cyclical. The corporations continue to go through the cycles of margin expansion and compression. The periods of margin compressions are usually associated with economic recessions, which typically lead to market declines. Since World War II, the U.S. economy has gone through 11 recessions, and almost every one of them triggered a bear market. During recessions, profit margin shrinks, earnings are poor, weak companies go bankrupt, and even many stronger ones must cut the number of employees to justify fallen sales and profits. News is bad, and investors are in poor economic shape, pessimistic, and in no mood for buying. The stock market tanks.
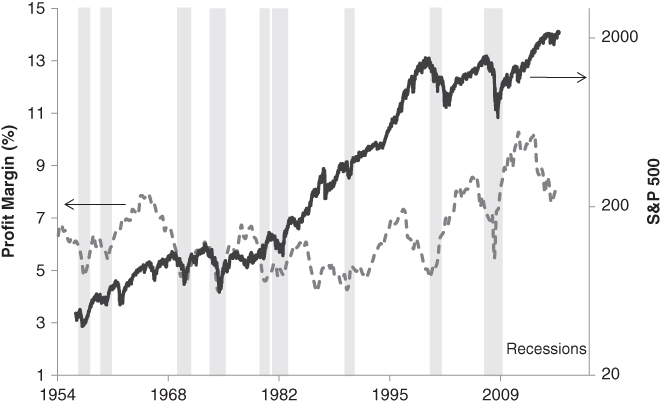
Figure 10.1 Profit Margin and SP500
Source: Downloaded from http://www.GuruFocus.com on 10/3/2016
Then it always recovers. During recessions and bear markets, valuations are low and less capital is there to compete for the ample investment opportunities now available. The potential returns from these investments become higher. The investors who focus on value will recognize the opportunities and start investing. They are followed by a few other brave ones, then by the large crowds who watched the success of the earlier investors and now consider it safe to invest. The price continues to climb and more capital floods in to chase returns. As the price goes up, the potential returns diminish. Risk becomes undervalued. But momentum will continue until the crowds discover that their investments suffer unexpected losses. Then the downcycle begins. The cycle repeats over and over again.
As investors, we must remember the inevitability of cyclicity and keep abreast of where we are in the cycle. When the market was going up and investment returns were rosy, the market valuation may have been pushed to overvalued levels. Overvaluation with the stock market usually comes with excess capital investment and overcapacity in businesses. Stock prices are sensitive to bad news when the valuation is high. Bad news in business will trigger the market downturn. The valuation will revert to the mean, and the pendulum will swing in the other direction.
The dashed line in the chart in Figure 10.1, corporate profit margin, is a good indicator of where we are in the current economic cycle, which started in 2009. We have seen the peak of above 10 percent in profit margin from 2011 through 2013. It stands at around 8 percent as of October 2016 and in the downtrend direction.
Market Valuations
Another important parameter to observe is the overall market valuation. As with individual stocks, the overall market can be measured with P/E ratio and P/S ratio. But just like with cyclical companies, the whole economy is cyclical. During recessions, profit margins are low and earnings are depressed. P/E ratio gives a false indication of the market valuation. Yale professor Robert Shiller's cyclically adjusted P/E is a better indicator for the market valuation. Daily updated Shiller P/E can be found on GuruFocus.com by using this link: http://www.gurufocus.com/shiller-PE.php.
The historical mean of Shiller P/E is 16.7. As of February 2017, the ratio is at 28.6, which is about 71 percent higher than the historical mean. Where it stands now is about the same as in the fall of 2007, just before the unfolding of the financial crisis. Throughout history, Shiller P/E ratio was higher than it is now only at the peak before the Great Depression and during the dot-com bubble. Over the past two decades, Shiller P/E was never lower than the historical mean except at the time of the market crash of 2009.
The ratio that Buffett uses for measuring the market valuation is to look at the P/S ratio of the overall market. Here the price is the total of market values of all the companies in the United States, and sales are Gross National Product (GNP) of the United States. Therefore, it is the ratio of the total market value over GNP. Buffett calls this ratio “probably the best single measure of where valuations stand at any given moment.”2
Because this is a P/S ratio, it does not give a direct indication of whether the market is expensive or cheap. But it can be compared with historical values. Also, the revert-to-mean calculation can be used to forecast the future returns of the overall market.
In the calculation on GuruFocus.com,3 we use Gross Domestic Product (GDP) instead of GNP for sales because GDP data is updated faster. Though the two numbers have different meanings, they both measure the production levels in an economy, and their differences in numbers have been minimal. For the total market value, we use “Wilshire 5000 Full Cap Price Index” instead of the total market values of all U.S. companies, which includes all public and private companies. The reason is because we can get daily values for Wilshire 5000 Full Cap Price Index, whereas the total market values of all U.S. companies are updated quarterly. Our calculation gives different absolute values from the total market value over GNP calculation, but when compared with its own historical values, this ratio should give a similar picture and conclusion if the total market cap of all U.S. companies is used.
Figure 10.2 shows the ratio of total market cap over GDP since 1971. We can see that during the past four decades, this ratio has varied within a very wide range. The lowest point was about 35 percent in the previous deep recession of 1982, while the highest point was 148 percent during the tech bubble in 2000. The market went from extremely undervalued in 1982 to extremely overvalued in 2000. The historical mean is 78 percent. As of October 2016, the ratio stands at above 120 percent, which is about 55 percent higher than the historical mean. It is higher than it was before the market crash in 2007. Only the year 2000 peak was higher.
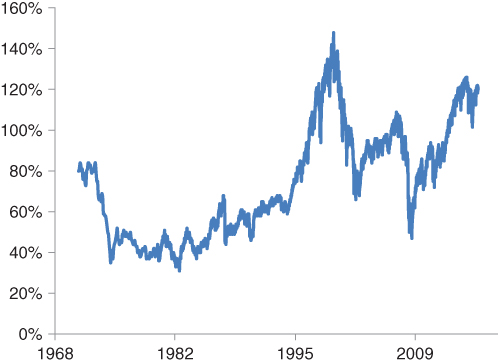
Figure 10.2 TMC/GDP
Source: Downloaded from http://www.GuruFocus.com on 10/18/2016
Both Shiller P/E and the ratio of total-market-value/GDP suggest that the market is significantly overvalued as of February 2017. But the tricky part is the interest rate. The interest rate has never been this low; if it continues to stay this low, the market may not be as overvalued as it seems.
Both the trend of profit margins and market valuations suggest that we are currently at the late stage of this cycle, though this does not tell us when the downturn is coming. At this stage of the cycle, investors need to act very cautiously and be financially and psychologically prepared for a possible downturn. Also, don't forget to update your watch list!
Projected Future Market Returns
Though the market valuation does not tell us when the downturn is coming or where the stock market will go in the short term, it does tell us a lot about the future market returns we can expect. Its track record is quite satisfactory.
The future returns of the entire stock market are determined by the following three factors:
1. Business growth
If we look at a particular business, the value of the business is determined by how much money this business can make. The growth in the value of the business comes from the growth of the earnings of the business. This growth in the business value is reflected as the price appreciation of the company stock if the market recognizes the value, which it always does, eventually. If we look at the overall economy, the growth in the value of the entire stock market comes from the growth of corporate earnings. Over the long term, overall corporate earnings grow as fast as the economy itself.
2. Dividends
Dividends are an important portion of the investment return. Dividends come from the cash earning of a business. Everything equal, a higher dividend payout ratio, in principle, should result in a lower growth rate. Therefore, if a company pays out dividends while still growing earnings, the dividend is an additional return for the shareholders besides the appreciation of the business value.
3. Change in the market valuation
Although the value of a business does not change overnight, its stock price often does. Over the long run, stock market valuation reverts to its mean, regardless whether it is measured by P/E, P/S, P/B, and so on. A higher current valuation certainly correlates with lower long-term future returns. Conversely, a lower current valuation level correlates with a higher future return.
So, what return is the market likely to deliver from its current level? Putting together the contributions from all three factors, the return of an investment can be estimated by the following formula:

The first two items of the equation are straightforward. The third can be calculated if we know the beginning and ending market ratios of the time period (T) considered. If we assume the beginning ratio is Rb and the ending ratio is Re, then the contribution in the change of the valuation can be calculated from this:
The investment return is thus equal to:

From this equation, we can calculate the likely returns that the stock market will generate from the current valuation level Rb. In the calculation, the time period T we used was eight years, which is about the length of a full economic cycle. By using eight years, we assume that the market valuation will revert to its historical mean (Re) in a full market cycle. This mean is about 78 percent if we use the total market cap over GDP for the overall market valuation ratio.
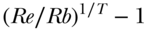
The projected expected return is reflected in Figure 10.3. To verify this model, the historical actual return is also shown. The actual return is calculated with the actual data of Wilshire 5000 Full Cap Price Index. To get the actual return for the year 1990, for example, we calculate the compound annualized return of Wilshire 5000 Full Cap Price Index from 1990 through 1998. The actual return data can only be calculated up to 2008 at this point because 2016 Wilshire 5000 Full Cap Price Index is the latest data available.
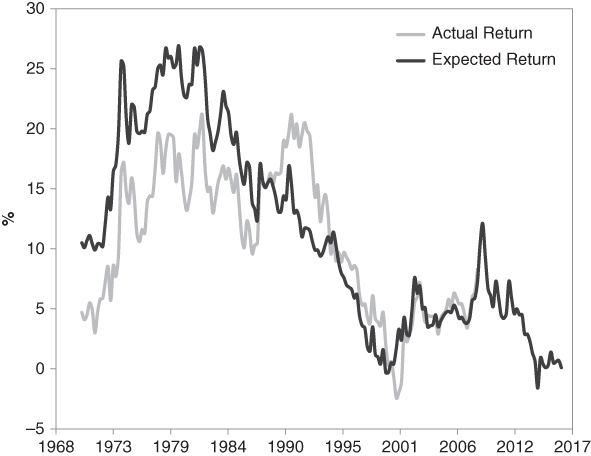
Figure 10.3 Projected Return vs. Actual Return
Source: Downloaded from http://www.GuruFocus.com on 10/7/2016
We can see that the calculations largely predicted the trend in the returns of the stock market. For the 1970s and early 1980s, the calculated returns were higher than the actual market returns. For the late 1980s and 1990s, the calculated returns were lower. The discrepancy may be caused by the swing in interest rates. The interest rate was going up quickly in the 1970s and the stock market faced a headwind. As interest rates went down in the 1980s, the stock market was riding the tailwind and delivered higher-than-expected returns. Starting in the mid-1990s, the long-term interest rate as measured by the ten-year yield went below 6 percent. The actual return followed the projected return very closely.
As of February 2017, the calculation shows that the stock market is likely to return −0.5 percent per year, including dividends, in the next eight years. This paints a very pale picture for future market returns. Only at the peak of the tech bubble in 2000 was the projected return this low.
It is possible that the calculation is too conservative, as I assume the valuation ratio will revert to its mean at 78 percent since 1970, although the comparison between the actual return and the projected return does not indicate so. If interest continues to stay this low, the valuation ratio may continue to stay at higher levels. If the ratio of the total market value over GDP is at its current level of 120 percent in eight years, the expected return is a much higher 5 percent a year. If the ratio is midway between the historical mean and what it is now, the projected return is a little above 2 percent, which implies a flat market in the next eight years if the dividend contribution is subtracted from the calculation.
But this doesn't mean there won't be opportunities in the stock market. The stock market will continue to cycle, as it always has. It is probably close to one extreme right now. It may swing to the other extreme quicker than average investors are prepared for. In the meantime, it will create tremendous opportunities for those who understand cycles and are well prepared. In the peak of the dot-com bubble in 2000, the calculated expected return was close to nothing, which it did deliver in the following decade. But over those ten years, the economy and the market went through two downcycles. The far-lower valuation caused by these downcycles lifted the projected return to considerably higher levels, which the market again delivered in the years that followed. It is certain that the market will go through more downcycles in the next decade. Cycles never stop. There will be times when the market again positions itself for much higher returns.
Naturally, far fewer people are interested in buying stocks as the stock market crashes. The news is bad and the downtrend may continue, although the valuation is now more appealing and the projected return is higher. If you are tempted and need a little more conviction, take a look at what the insiders are doing.
Insider Trends
As a group, company insiders such as corporate executives and those on the board of directors act much more rationally during market crashes. This may not be surprising; they are more business savvy and are better able to use public information to analyze businesses. More importantly, they are now dealing with their own money. An earlier study found that insiders are mostly value investors. They are net buyers of relatively low P/E stocks and net sellers of relatively high P/E stocks, and they tend to sell more when market valuation is high and buy more during market selloffs. Immediately after Black Monday on October 19, 1987, when the Dow lost 22.6 percent, insiders were heavy buyers (90% being buyers). October 20, 1987, had more insiders buying than any other day during the study period from 1975 to 1989.4 Given the insiders' knowledge of their companies, this buying suggests that the collapse was an irrational reaction to the stock price declines over the previous two weeks. Insiders acted quickly and grasped the opportunity.
The data over the past decade demonstrates that the behavior of insiders has not changed from 30 years ago. Insiders don't join the crowd in market selloffs. Figure 10.4 shows the aggregated monthly number of total insider sales since 2004. Only the open market sells of insiders are counted. No weight was given in the data to the numbers of shares sold or the dollar amount.
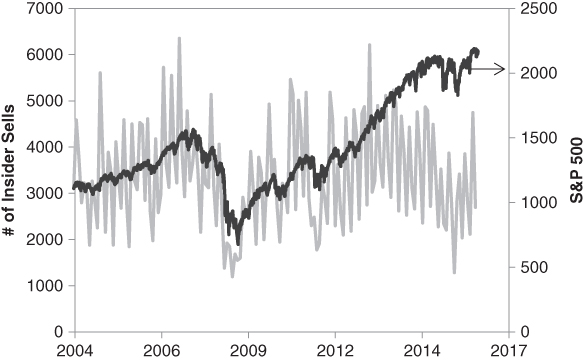
Figure 10.4 Insider Sales
The S&P 500 Index is also shown in the chart for comparison purposes. Interestingly, the envelope of insider sells chart has a very similar shape to the S&P 500 Index. Insiders sold the most at the market high of 2007. They sold the least at the market lows during the worst period of the financial crisis from September 2008 to April 2009, the U.S. government shutdown threat in August 2011, and the market correction from late 2015 to early 2016.
Not only do insiders tend not to sell at the market lows, they also buy more as the market declines, just the opposite of what the broad market does. Figure 10.5 shows the monthly number of open market insider buys from 2004. The buying activities picked up as the market started to decline in late 2007 and reached a peak exactly when they sold the least during the financial crisis. Similar behavior was observed during the crisis of the U.S. government shutdown in 2011 and the correction from late 2015 to early 2016.
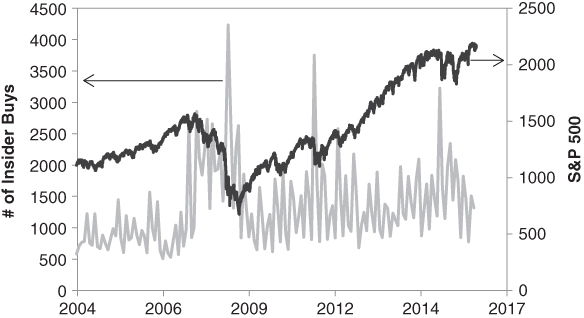
Figure 10.5 Insider Buys
Data source: S&P500 and Wilshire 5000
This clearly illustrates that when the market panicked and was selling indiscriminately, insiders as a whole were doing exactly the opposite. They remained confident regarding their companies and purchased many more shares than they normally did. These purchases were rewarded greatly in the years that followed.
When we draw the ratio of the aggregated monthly number of insider buys over insider sells, we get Figure 10.6. Much of the time, the ratio stays at less than 0.5, which means that insider buying activities are less than 50 percent of selling activities. However, as the market declined, the ratio picked up in 2008; by October 2008, it was at 1; it peaked in November 2008 at 2.4; and it peaked again at 1.9 in March 2009 when the stock market hit bottom. Two other peaks were observed in August 2011 and August 2015 through January 2016. Every one of the peaks happened after the market declined considerably. The higher the decline was, the more buys the insiders made.
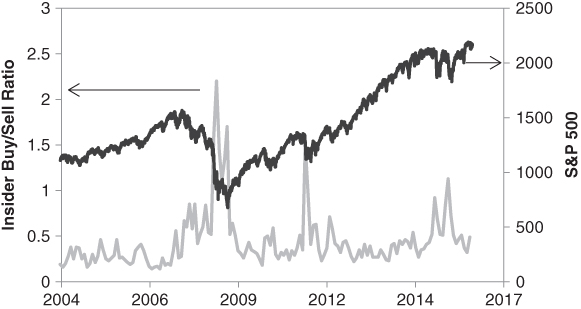
Figure 10.6 Insider Buy/Sell Ratio
Data source: S&P500 and Wilshire 5000
This data shows that insiders as a group acted rationally during market crashes. Their aggregated buying/selling activities ratio can serve as another good indicator of the attractiveness of the stock valuation during downcycles.
By the way, all the data mentioned in this chapter, market valuations, the projected returns, and insider activity ratios are available on GuruFocus.com and are updated daily.

Understanding the economic cycles and market valuation will not help anyone predict the direction of the market in the short term or even in midterms like a year or two. But it keeps investors from looking in the rearview mirror. They will have a clearer view of the future and be able to stay rational when the market gets euphoric or sinks into fear again.
For analyzing individual companies, having a good knowledge of business cycles and the likely future market returns can be useful in evaluating management's capital allocation decisions, their aggressiveness in accounting, and the quality of earnings related to pension-fund return assumptions.
Buffett calls himself a bottom-up value investor and rarely talks about the general market. But he has a tremendous understanding of business cycles, the role of interest rates, market valuations, and the likely future returns and risks. A good book to read about this topic is Marks's The Most Important Thing, 5 which I strongly recommend.
Over the long term, we should always be optimistic. At the current late stage of the business cycle, investors should stay defensive and be prepared for the next downcycle. They should focus their investments on the quality companies that not only can pass the test of bad times, but also can come out stronger.
Now, more than any other time in the past decade, it is vital to invest only in good companies.