CHAPTER 9
How to Evaluate Companies
In Chapter 2, I discussed the valuation methods based on the assets of companies. In Chapter 5, I focused on the valuation method based on the free cash flow and the earnings of the companies that have predictable earnings power. In this chapter, I want to explain business evaluation, in general, and how different evaluation methods can or cannot be applied to businesses across different industries and in different situations.
This chapter offers a broad explanation of valuation methods and their applications. Although I have previously mentioned that some industries should be avoided by investors who seek to invest in only good companies, some of these industries will be remarked on in this chapter. So, please don't confuse the comments in this chapter with the investing philosophy of buying only good companies.
Valuation approaches can be divided into three categories: (1) valuation ratios, (2) intrinsic values, and (3) rate of return. I will discuss each of them in detail in this chapter.
Valuation Ratio Approach
Valuation ratio approach is the most commonly used method of valuation. Among all the valuation ratios, P/E is the most popularly used ratio. Then there are price/sales, price/book, price/free-cash-flow, EV/EBIT, EV/EBITDA, and many others.
P/E Ratio
The P/E ratio can be viewed as the number of years it takes for the company to earn back the price that investors paid for the stock. For example, if a company earns $2 per share per year, and the stock is traded at $30, the P/E ratio is 15. Therefore, it takes 15 years for the investor to earn back the $30 paid for the stock through the company's earnings, assuming the earnings stay constant over the next 15 years.
In real business, earnings never stay unchanged. If a company grows its earnings, it takes fewer years for the investor to earn back the cost of buying the stock. If a company's earnings decline, it takes additional years. As a shareholder, you want the company to earn back the price that you paid as quickly as possible. Therefore, lower P/E stocks are more attractive than higher P/E stocks, as long as the P/E ratio is positive. Also, for the stocks with the same P/E ratio, the faster-growing business is more attractive.
The fair P/E ratio of a stock is about the growth rate of the company, according to Peter Lynch.1 In Chapter 5, I explained that at the fair P/E ratio, the stock price for a growing company is approximately at its fair value, and the fair price is affected by interest rates.
It is useful to look at the historical range of a company's P/E and see where it stands compared with historical valuations. For example, Figure 9.1 shows the P/E ratio of Wal-Mart since 1998. Investors who bought the stock in 2000, when the P/E ratio was at an all-time high of 60, did not recover their loss until Wal-Mart nearly quadrupled its earnings per share 12 years later. But investors who bought at the all-time low P/E of 11 in 2011 were rewarded quickly with a gain of more 40 percent in 12 months.
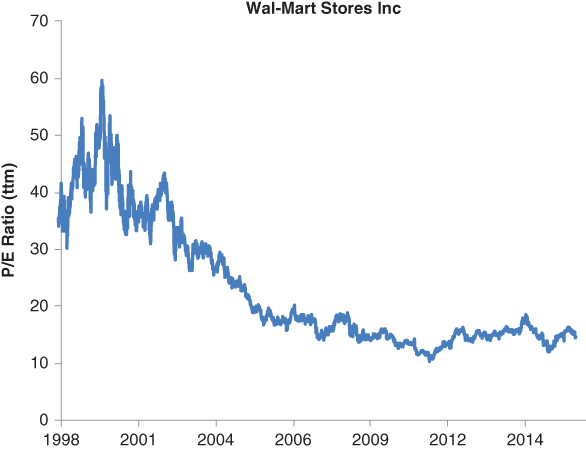
Figure 9.1 WMT P/E
If a company loses money, the P/E ratio becomes meaningless. As I pointed out in Chapter 3, avoiding money-losing companies can boost returns.
To compare the stocks with different growth rates, Lynch invented a ratio called PEG, which is defined as P/E ratio divided by the growth rate. It seems that when PEG = 1, the stock is fair valued. He still said he would rather buy a company growing 20 percent a year with a P/E of 20 than a company growing 10 percent a year with a P/E of 10.2
Because P/E ratio measures how long it takes to earn back the price the investor paid, P/E ratio can be used to compare the valuation of the stocks across businesses from different industries. That is why it is the most important and widely used indicator for the valuation of stocks.
P/E ratio can be affected by nonrecurring items such as the sale of a part of the business, a onetime assets write-down, and so on. This may dramatically affect the reported earnings for the current year or quarter. But it does not repeat. Investors need to pay attention to this when using P/E to value companies.
Investors also need to be aware that P/E ratio can be misleading when the underlying business is cyclical and unpredictable. P/E ratio works best for the companies with steady earnings. Cyclical businesses have higher profit margins at the peaks of business cycles and lower margins or even losses at the bottoms of business cycles. Their earnings are high at the peaks of the cycles and their stock P/E ratios are artificially low. A good example is Southwest Airlines, the second largest airline by market cap. Its P/E ratio from 1998 to 2016 is reflected in Figure 9.2.
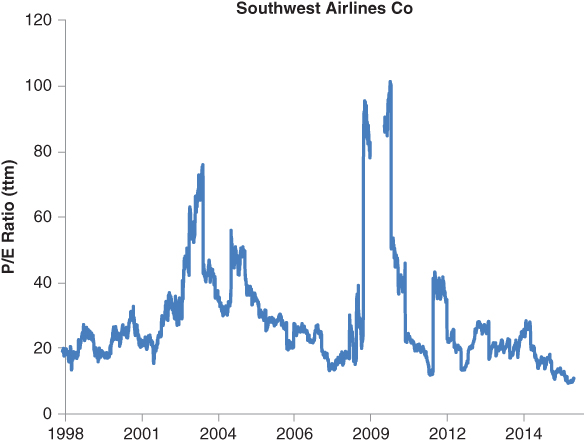
Figure 9.2 LUV P/E
Apparently Southwest Airlines' P/E ratio was the highest during the cycle troughs of 2003 and 2009, though its stock had lost 50 percent from its previous peaks. It seemed cheap as of September 2016, as the stock was traded at the P/E ratio of under 10. But its recent earnings are pumped up by both low oil prices and the decent economy, and may not be sustainable if oil prices go up or the economy slows down. Its historical earnings per share are shown in Figure 9.3.
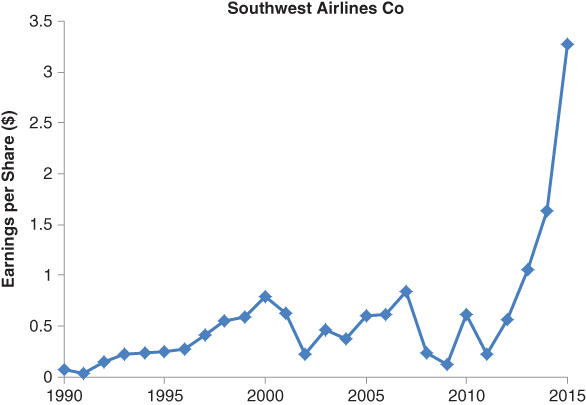
Figure 9.3 LUV EPS
Clearly the earnings have dramatically deviated from the historical trend since 2014, when oil prices started to drop. The unusually high earnings have made the P/E of the stock low, although the stock price is close to an all-time high. The better ratio for evaluating cyclical businesses is price/sales ratio.
EV/EBIT and EV/EBITDA are the variations of P/E, where EV stands for enterprise value, EBIT stands for earnings before interest and tax, and EBITDA stands for earnings before interest, tax, depreciation and amortization. Arguably, they are better valuation ratios than P/E because enterprise value is the true price the investor pays, given that as a shareholder, he or she owns the cash but is liable for the debt of the company. Furthermore, the earnings before interest and tax are less susceptible to the manipulations of the company's accounting practices.
Peter Lynch Earnings Line
Related to P/E ratio, Lynch likes to superpose the price chart with a line that is at 15 times trailing-12-month earnings and compare the relative positions of the two lines. He called this line the earnings line, which is now better known as the Peter Lynch Earnings Line. The chart with the price line and the earnings line is now known as the Peter Lynch Chart, as popularized by GuruFocus.com. In his excellent book, One Up on Wall Street, Lynch used many of these charts to illustrate the valuation of stocks. He wrote:
An example of the Peter Lynch Chart is illustrated in Figure 9.4 for General Dynamics Corp. (GD).
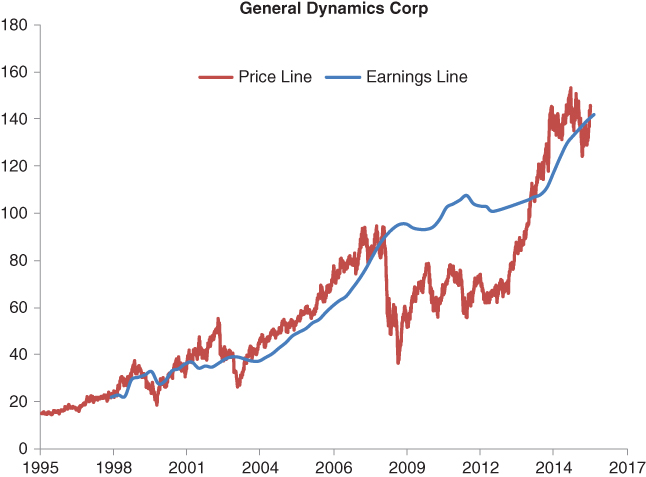
Figure 9.4 GD Peter Lynch Chart
We can see that historically when GD's stock prices fell below the earnings line, it always came back to cross it and go above it. Just as Lynch said, an investor could do pretty well by buying GD stock when its price dropped below the earnings line and selling when it rose above. This technique can be applied to many stocks, especially those with a steady long-term earnings trend.
The Peter Lynch Chart does have limitations due to its earnings lines being drawn at fixed P/E = 15, which does not fit even for blue-chip stocks like CVS Health Corp., PepsiCo Inc., Johnson & Johnson, and Procter & Gamble. A better earnings line is the one drawn at its historical median P/E ratio instead of at the fixed number of 15. This historical median P/E can be different for different stocks. For example, in the case of CVS, the better earnings line is drawn at P/E = 18.6. The earnings line with P/E = 15 is almost always below the price line. (See Figure 9.5.)
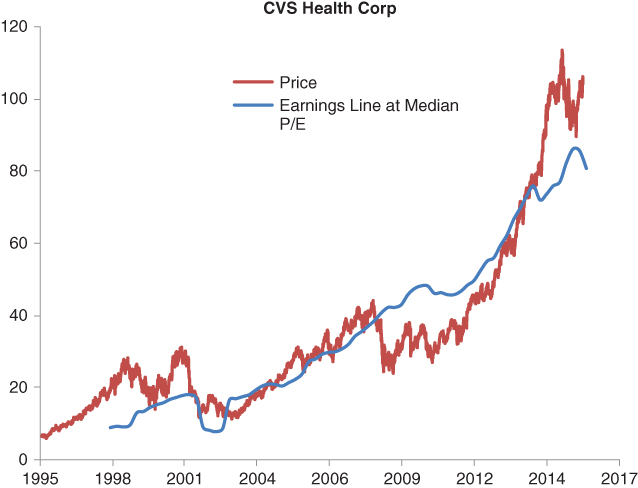
Figure 9.5 CVS Median P/E Chart
The reason the appropriate earnings line is higher is probably because the interest rate in the past decade has been much lower than it was during Lynch's time at Fidelity. The lower interest rate lifted the nominal valuations of all stocks.
In addition to the earnings line drawn at fair P/E, we can also draw earnings lines at both the lowest and the highest P/E within its history. For instance, the next chart is again for CVS, with the earnings line drawn at its lowest P/E of 10.4 and the highest P/E of 27 since 2004. Clearly, if one buys when the price line is close to the lowest P/E earnings line, and sells when the price line is close to the highest P/E earnings line, one can do extremely well. (See Figure 9.6.)
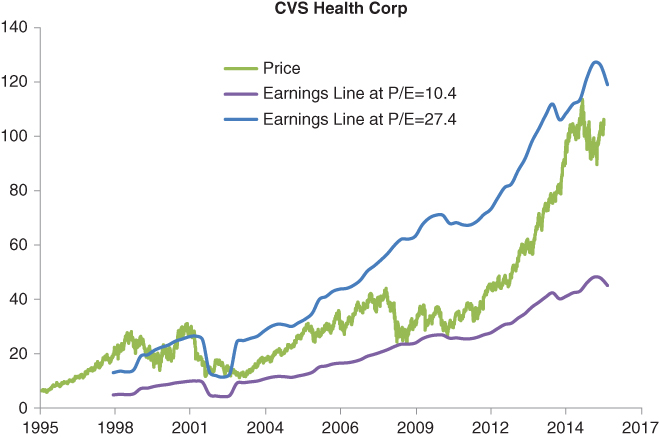
Figure 9.6 CVS Max/Min P/E Chart
By the way, you can find all the historical P/E, earnings per share, and Peter Lynch Charts, as well as many others, by using the Interactive Chart feature at GuruFocus's website, GuruFocus.com.
Again, the Peter Lynch Chart and the variation with earnings line at median P/E ratio work well for the companies with steady growth and earnings trends, or the stalwarts, as coined by Lynch.4 These companies tend to be found in sectors such as consumer staples, healthcare, and utilities, where the consumption of the product or service is relatively independent of economic conditions.
The Peter Lynch Chart does not work well with the sectors that are cyclical: industrials, chemicals, durable goods, and so forth. In the example of Southwest Airlines, it seems that the stock price has room to go up because its current all-time-high price is far below the earnings line drawn at historical median P/E of 23.25, as shown in Figure 9.7. But its earnings line may come down quickly if either the oil price goes up or travel slows down. For cyclical companies, price/sales ratio paints a more accurate picture in terms of historical valuations.
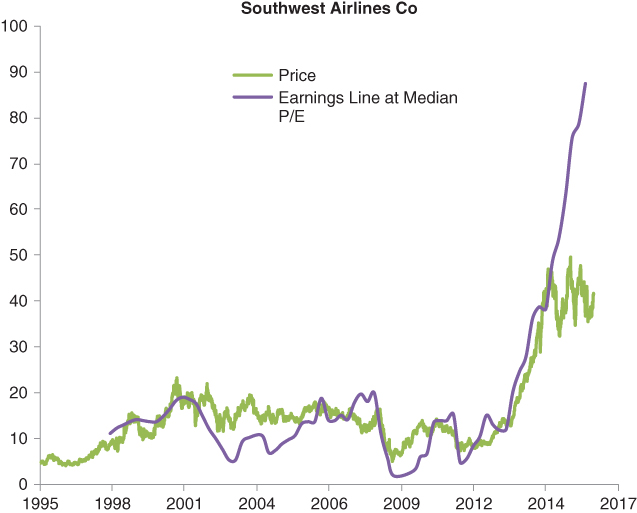
Figure 9.7 LUV Median P/E Chart
Price/Sales Ratio
P/S ratio is an excellent valuation indicator if you want to compare a stock with its historical valuations or with other stocks in the same industry. It does not measure how long it takes for investors to get paid back like P/E ratio does; it gives only a relative valuation. P/S ratio is a great tool for evaluating cyclical businesses where P/E ratio works poorly. It works better for cyclical companies when, over time, the company's profit margin reverts to the mean. Again, in the example of Southwest Airlines, although its earnings have had many ups and downs, like a rollercoaster, the company's revenue has been going up relatively steadily. If we replace the median P/E earnings line with the median P/S earnings line in the Peter Lynch Chart, the chart clearly shows when it is a good time to buy the stock and when it is a good time to get out, as shown in Figure 9.8. In the early 2000s, the stock was traded at far above the median sales line. It took more than 14 years for those who bought in 2000 to break even. Those who bought when the stock prices were far below the median sales line in 2009 and 2011 were rewarded with outsized gains over the next 5 years. The previous chart drawn with the median P/E earnings line isn't able to provide such clear direction. Currently, Southwest Airlines looks fair valued as measured against its historical median price/sales ratio.
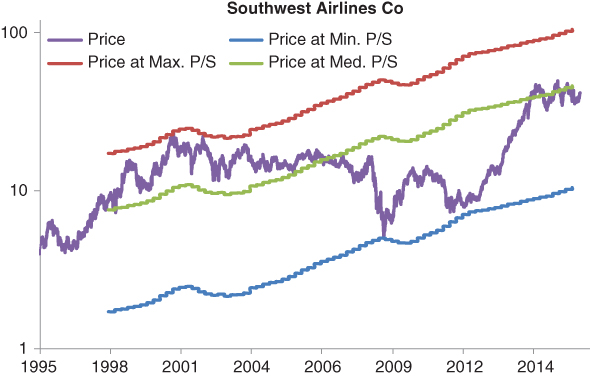
Figure 9.8 LUV P/S Bands
Similar to what we do with the earnings line, we can draw the sales lines at the highest P/S ratio and the lowest P/S ratio within certain historical periods. These lines form a band of the historical P/S ratios and can give direction to investors regarding when the stock is at a low valuation and it is a good time to buy.
This P/S bands approach works for both steadily performing companies and cyclical companies. The two charts in Figures 9.9 and 9.10 show the P/S bands for Johnson & Johnson and Amazon. Drugmaker Johnson & Johnson's stock price has been fluctuating at about 3.5 times its revenue per share; online retailer Amazon's stock price has been traded at about 2.25 times its revenue per share.
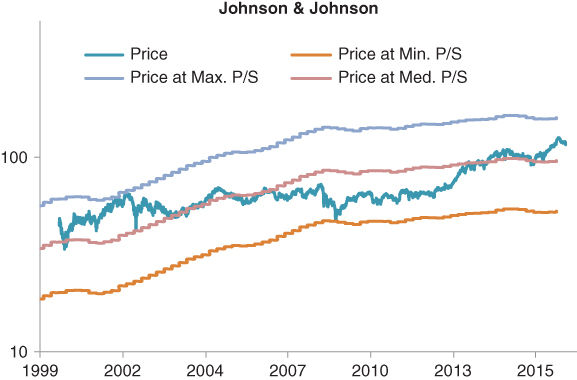
Figure 9.9 JNJ P/S Bands
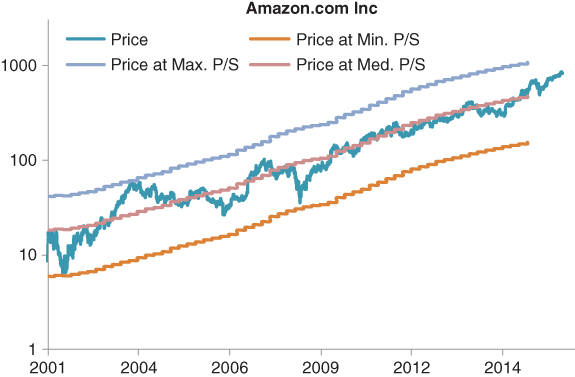
Figure 9.10 AMZN P/S Bands
The P/S bands approach does not work for companies that are in permanent decline and may see their P/S ratios fall all the way to zero. And it does not work for commodity producers such as oil companies, steelmakers, goldminers, and so on, which I will discuss later in this chapter.
When P/S ratio is applied to the entire stock market, it can be used to evaluate the broad market valuation and the projected returns. In this case, the price is the total market cap of all the stocks that are traded, and sales are the GDP of the country. This is how Warren Buffett estimates the broad market valuation and projects future returns. I will explain in more detail in the next chapter.
Price/Book Ratio
Unlike the valuation ratios P/E and P/S, which are the price relative to the earnings power, P/B ratio measures the valuation of the stock relative to the equity of the company. It does not suggest anything about the operation of the company. Instead, it compares the price and the underlying assets of the company.
Benjamin Graham liked to compare the stock price with the book value of the shares and buy the ones that were sold at below book value, that is, P/B < 1. P/B ratio works well for the companies that are asset heavy and whose earnings power comes mainly from the business's tangible assets.
For the businesses that are asset light, such as software companies or insurance agencies, P/B ratio does not work well. Companies like Moody's and AutoZone have negative equity, so P/B ratio cannot be applied to them.
Price/book ratio works best for financial companies (e.g., banks and insurance companies), which deserve more detailed consideration.
P/B Ratio and Financial Companies
For financial services companies such as banks and insurance agencies, the most useful valuation parameter is price/book ratio. Financial companies follow mark-to-market accounting rules. They are required to record their assets at the fair values traded in the market. Most of the assets of financial companies are traded in the market and have market prices. The balance sheet items such as assets and liabilities reflect their current market values. Therefore, the shareholders' equity on the balance sheet of financial companies is very close to the net worth of the companies' assets in the current market.
One can also try to value a bank or insurance company based on its earnings power. But for financial companies, it's very hard to distinguish the items that are needed for calculation: the change of working capital, capital expenditures, debt, and so on. Furthermore, banks and insurance companies' true profit and loss can be very different from their reported earnings. The provision for loan loss in banks and the loss reserve with insurance companies are quite subjective, and they drastically affect the reported earnings. The true earnings from their current business activities are usually unknown until many years later, when the loan default or insurance loss happens during bad economic times.
Although it seems that we don't value the earnings power of financial companies if we just look at their book values, in fact most of their earnings power is already reflected in the prices of their assets, whether they are bonds, stocks, mortgages, or other marketable securities. A bond can sell at above or below its face value depending on changes in the interest rate and credit quality. Mortgages are sold from one bank to another at the prices that reflect their ability to generate profit.
Therefore, the book value is a rather accurate measure of net worth for financial companies. That is why the change of per-share book value is always the first thing Buffett writes about in his annual shareholder letters. Especially in Berkshire Hathaway's earlier years, its insurance operation was a much larger segment of the company, and Buffett thought the book value was a good proxy of the intrinsic value of the shares. As Berkshire acquired more large non-insurance operations such as Burlington Northern Santa Fe, Iscar, MidAmerican Energy, and so on, its intrinsic value deviated more from its book value. Figure 9.11 shows the stock price of Berkshire Hathaway relative to its historical P/B bands formed by prices at maximum, median, and minimum P/B ratios. The chart gives a clear indication of the valuation of the stock and when is a good time to buy.
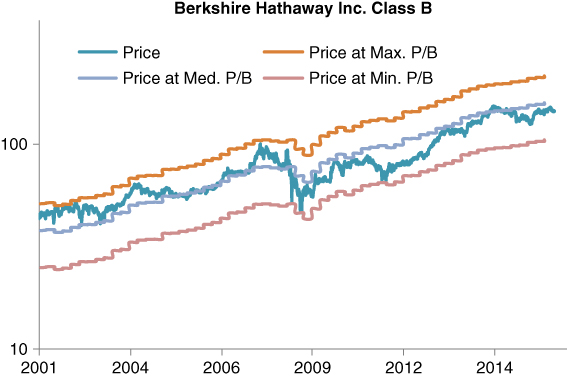
Figure 9.11 BRK P/B Bands
When evaluating financial companies with their book values, be wary about the quality of the book. Although book value comes mostly from the current market values of the assets, the market can be drastically wrong with the prices of the underlying assets. When bank loans start to default more than expected, or insurance losses come higher than anticipated at underwriting, the market prices of their assets can go down quickly. That was what happened during the 2008 financial crisis and how Dr. Michael Burry made a killing betting against mortgage-backed securities.
Therefore, when it comes to investing in financial stocks, the salient factors are the quality of the book, the growth of the book value, and the price/book ratio. Those with high-quality books and low price/book ratios are more attractively valued.
Commodity Producers
None of the above ratios work particularly well for commodity producers, the companies whose products are used by other businesses or consumers. These products include oil and gas and metals such as steel, copper, gold, and so on; they also include eggs, corn, and other grains. These companies are usually asset-heavy, and their assets are a good indication of their earnings power and net worth.
Though the products of various commodity producers are diverse in how they are produced and consumed, they share a common element: Their prices are unpredictable and can swing up and down and are out of the control of these companies. Their production costs are relatively independent of the prices of their products. Therefore, their revenue and profit are both highly dependent on the prices of the commodity they produce.
This is the case even for companies as mature as Exxon Mobile, which has a relatively diversified product portfolio and geographic distribution. Figure 9.12 shows its quarterly net income and the crude oil prices, which are closely correlated.
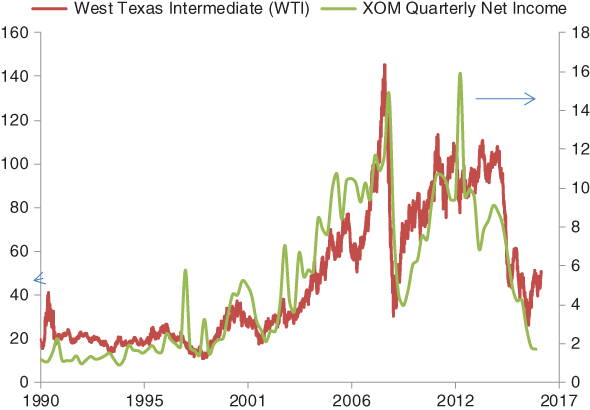
Figure 9.12 Oil Price vs. XOM Net Income
The strong dependence of the revenue and profit on the unpredictable commodity prices makes it very hard to value commodity producers. Investing in commodity producers is even more tricky because the commodity cycle is not necessarily synchronized with economic and stock market cycles. So, we may have low commodity prices and poor earnings for the commodity producers yet continued inflated prices for their stocks.
Ratios such as P/E and P/S cannot give us a good indication of even the relative valuations of these companies. Similarly, valuation methods such as DCF cannot give intrinsic value estimates with meaningful accuracy as the results are highly dependent on prices of the commodity in the past and the future. Even the average within the previous cycles cannot be used to predict the average of the next cycle. Any attempt of intrinsic value will result in a wide range that is a function of the future prices of the commodity. For an example, Wall Street analysts have 18 different price targets on the stock of United States Steel, ranging for a high of $37 to a low of $7 while the stock was traded at $16, according to Barron's.5
An alternative measure of the valuation of commodity producers is to look at the Shiller P/E ratio of the stocks. Shiller P/E ratio was developed by Yale professor Robert Shiller for measuring the valuation of the S&P 500 index.6 We have adopted the methodology to individual stocks. It is calculated by adjusting the earnings over the past ten years to the current year for inflation and taking the average of the adjusted earnings and dividing the stock price by the average. It smoothes out the commodity price and profit margin fluctuations across the cycle and gives a more real picture of the stock valuation.
P/B is also a relatively better indicator for commodity company stocks when compared with the historical valuations. The reason is, unlike revenue and profit, the book value is relatively stable. In general, commodity prices over the long term are driven by market supply and demand. Commodity producers do not view temporarily low prices or margins as a trigger for conducting impairment tests, which will affect the book value of the company shares.
An example of P/E, P/B, and Shiller P/E for Chevron is shown in Figure 9.13. Chevron's stock cannot be evaluated with regular P/E as its earnings are now negative. The ratio went to 150 before that because its earnings declined drastically from 2015. This clearly does not make sense with valuation. P/B and Shiller P/E give a correct measure on the historical valuation of the stock.
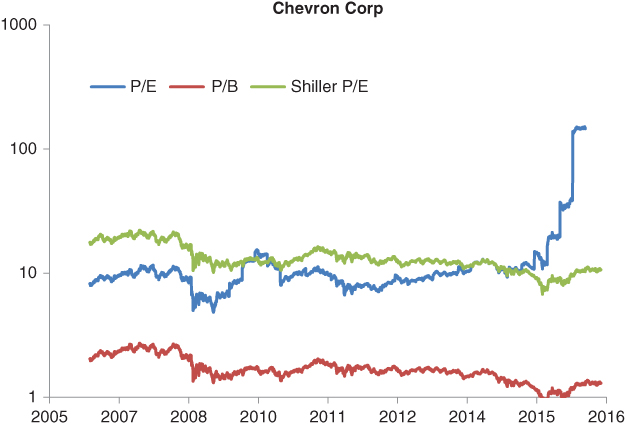
Figure 9.13 CVX P/E, P/B, Shiller P/E
A generally better time to buy commodity companies is when the P/B and Shiller P/E ratios are at their lower ends for the recent cycles. The better companies to buy are those that have stronger balance sheets, have higher profit margins, care to reserve enough funds for rainy days, and are traded at lower historical P/B. Very few commodity companies are good for long-term holdings. A better time to sell them is when P/B and Shiller P/E are at the high end of the recent cycle, which is usually also when the commodity prices are at the high end of the cycle.
That was what Buffett did with PetroChina, the giant Chinese oil producer. He bought the stock in 2002 when the oil price was at $20 a barrel and P/B of PetroChina stock was around 1. Then he sold the stock in 2007 when the oil price climbed to above $70 and P/B ratio was at an all-time high of 4. As of September 2016, P/B of PetroChina stock was about 0.7. He had a perfect timing for selling the stock. But then Buffett used some of the profits to buy U.S. oil producer ConocoPhillips in 2008 when the oil price was at an all-time high. This is what he wrote in his 2008 shareholder letter a few months later:
A more recent example is billionaire activist investor Carl Icahn, who bought into contract driller Transocean in 2013 when the oil price was hovering at around $100 a barrel. The collapse of the oil price idled its rigs, resulting in sharp revenue decline. Carl Icahn lost around 80 percent with this investment and sold out. The commodity market is merciless if you buy at the peaks of the cycles.
Intrinsic Value Calculations
With the intrinsic valuation approach, investors try to reach an absolute valuation of the business and compare the valuation with the stock price. As discussed in Chapter 5, the intrinsic value of a business is equal to the discounted value of the cash flow that can be generated by the business during its remaining life. The cash flow can come from the earnings through the operations of the business; it can also be from the sales of the company's assets. Therefore, the intrinsic value can be estimated based on the earnings power of the company or the net assets that the company owns or the combination of both the earnings power and the assets. Valuation approaches include:
- Net cash
- Net-net working capital (NNWC)
- Net current asset value (NCAV)
- Book value
- Discounted cash flow (earnings)
- Graham Number
- Earnings power value
- Peter Lynch Fair Value
- Median P/S value
The first four, net cash, net-net working capital, net current asset value, and tangible book value, are based purely on the assets of the company. They have been discussed in detail in the deep-value-investing section in Chapter 2. The first three are for the calculation of the fire-sale value of a business's assets and do not consider the business's other assets and earnings power.
Discounted cash flow (earnings) was explained extensively in Chapter 5. I will discuss the other approaches here.
Graham Number
Graham Number is an intrinsic value calculation method named after Benjamin Graham, the father of value investing. It is calculated as follows:
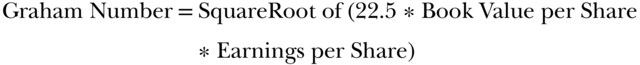
It can also be calculated as:

Graham did not actually publish a formula like this. But in The Intelligent Investor, regarding the criteria for purchases, he wrote:8
Unlike the valuation methods such as DCF, Graham Number is solely dependent on how the company has done in the latest year. It takes into account both the assets and the earnings power of the company. But it does not consider earnings growth in the valuation.
In general, Graham Number is a very conservative way of evaluating a stock. But because it only looks at the latest earnings and the book value of the company, it does not work well with cyclical companies. It works better with noncyclical manufacturing companies that earn profit by making tangible products. Because it does not take the growth factor into the calculation, it punishes growth companies. It cannot be applied to the companies with negative book values, and it may underestimate the value of asset-light businesses.
Earnings Power Value (EPV)
Earnings power value (EPV) is an intrinsic value calculation methodology developed by Columbia value investing professor Bruce Greenwald, who considers the discounted cash flow model unreliable because it depends heavily on assumptions of future profitability, the cost of capital, and the future growth rate.9 In the earnings power value approach, he looks for the equivalent asset value of the business from its earnings power. The enterprise value of a company is equal to the normalized earnings divided by the cost of capital. The earnings power value of a company is equal to the enterprise value plus the net assets of the company.
To eliminate the fluctuations caused by business cycles, past profit margins, revenue, and tax rate are averaged over at least one business cycle to arrive at the normalized earnings power. Growth is not considered in this model.
Compared with DCF model, EPV uses mostly existing financial data for the calculation. There is no need to assume the growth rate and the years to grow. But as in any intrinsic value calculation, assumptions are used that may affect the accuracy of the calculation. In the case of EPV, the assumption regarding the cost of capital can drastically affect the results. The estimate of excess depreciation and amortization is also subjective.
If a company is heavily in debt, we may find that its EPV is negative, as in the case of Alliance Data Systems. The company has been able to consistently grow its revenue and earnings. But as of June 2016, it has close to $12 billion in debt. The interest payment on its debt ate almost one-third of its operating income, even in the currently historically low interest rate environment. Because of the heavy debt, its EPV is negative. In the meantime, the company seems to be experiencing shrinking profit margins. Do you still remember the warning signs?
Peter Lynch Fair Value
In Chapter 5, I explained Lynch's rule of thumb of fair P/E: The fair P/E for a growth company is about the same as its earnings growth. This can be used to estimate the fair price of growth companies. We have:

Please note that here we ignore the percentage sign with the growth rate. So, if a company grows at 20 percent a year, we use 20 for earnings growth rate instead of 0.2. Therefore:

Long-term earnings growth rate needs to be used in this calculation. In the growth rate calculation, I prefer to use the growth rate of earnings before interest, tax, and depreciation and amortization. This more accurately reflects the growth of the business operations and is not subject to inaccuracies caused by the estimates of depreciation and amortization or nonrecurring distortions of earnings caused by discontinued operations, tax events, and so forth.
Peter Lynch Fair Value calculation applies well to growing companies that have a growth rate between 15 and 25 percent a year. It tends to underestimate the fair value for slower-growing companies these days, as the interest rate is much lower than it was when Lynch wrote the book.
I want to note that Peter Lynch Fair Value is different from the valuation implied by Peter Lynch's earnings line. In the Peter Lynch earnings line, P/E ratio is always kept at 15; in the fair value calculation, P/E is equal to the growth rate, which can be higher or lower than 15 percent per year.
Median P/S Value
With median P/S value, we assume that the fair valuation of a stock is at the median of its historical price/sales ratio. To smooth out the effect caused by business cycles, we examine the long-term historical price/sale ratio of the stock and find the median value over that period. In GuruFocus's calculation, we use a 10-year period.
Median P/S Value is calculated as:
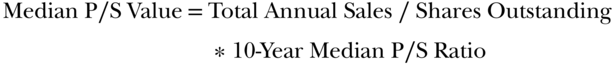
The reason we use the price/sales ratio instead of price/earnings ratio or price/book ratio is because a company's earnings or book value can go into negative territory, and the price/sales ratio is independent of profit margin and can be applied to a broader range of situations. Also, a company's revenue is less sensitive to business cycles than its profit margins and earnings.
As explained in the P/S ratio section, stock prices have historically shown strong correlations with revenue for many companies. For instance, drugmaker Johnson & Johnson's stock price has been fluctuating at about 3.5 times its revenue per share over the past 23 years. For heavy-duty equipment maker Caterpillar, the multiple is about 0.95; for online retailer Amazon, it is about 2.25. This strong correlation can be used to estimate the current fair price for the stock.
Median P/S fair value estimates work well for both steadily performing companies with constant profit margins and cyclical companies whose profit margins fluctuate near a constant level over the long term (e.g., Caterpillar). But if a company's profit margin is on the long-term trend of deviating from its past, this method may overestimate the fair price if the companies are experiencing declining profit margins, or underestimate if the companies are expanding profit margins. For instance, if Amazon expands its profit margin as its more profitable cloud services continue to grow faster than other segments of the company, its stock price may go above the long-term average of 2.25 times revenue per share.

Don't be daunted by the myriad ways of evaluating the worth of a business. Once, when I showed the calculations to an investor, he said that he wished there were only one way that would apply to all. Unfortunately, it's not that simple. But it's not that hard, either, if you know what is in the calculations.
When looking at these numbers, think about the underlying business and business performance. Judge whether the business value is dominated by its earnings power or its assets, whether it is growing, and how sustainable its growth is. Then apply the approach that best fits.
If a company has no earnings power and cannot generate positive free cash flow over a full business cycle, it is not a viable business and probably worth, at a maximum, the liquidation value of the assets. If a business generates profit, no rational business owner would sell it at its liquidation value. Its capability of generating cash flow is where the value is.
We can get a taste of these approaches with the valuations on some household names. The values were calculated in September 2016. The discount rate for DCF is 12 percent while for EPV it is 9 percent. The results are shown below:
| Company | Price | Book Value | Graham Number | EPV | DCF | Lynch Fair Value | Median P/S Value |
| Apple Inc. | 112 | 23 | 65 | 69 | 244 | 171 | 136 |
| Amazon.com Inc. | 829 | 35 | 49 | 30 | 43 | 101 | 508 |
| General Dynamics Corp. | 156 | 36 | 0 | 81 | 101 | 107 | 111 |
| Alphabet Inc. | 775 | 180 | 292 | 259 | 709 | 269 | 736 |
| Microsoft Corp. | 57 | 9 | 17 | 32 | 24 | 0 | 43 |
| Netflix Inc. | 97 | 6 | 6 | 9 | 0 | 0 | 44 |
| Wal-Mart Stores Inc. | 71 | 25 | 45 | 83 | 55 | 0 | 79 |
| Wells Fargo & Co. | 44 | 35 | 50 | –8 | 0 | 0 | 44 |
As discussed in the previous section, book value is a reasonable valuation for banks and insurance companies. Among these companies, only Wells Fargo, one of the biggest banks in the United States, is traded not far from its book value. All other companies are traded far above their book values, as they should be. Graham Number and EPV both use the combination of assets and earnings power, and neither takes growth factor into the calculation. They both underestimate the value of fast-growing companies like Apple and Alphabet or asset-light companies like Microsoft. General Dynamics has a negative tangible book value and its Graham Number cannot be calculated.
DCF can only be applied to the companies that will grow consistently into the foreseeable future. Among these companies, Apple, Alphabet, and General Dynamics have demonstrated consistent growth. Apple seems to be undervalued with DCF calculation. Alphabet, General Dynamics, and Wal-Mart are overvalued with the DCF model.
None of these valuation methods can justify the stock prices of Amazon and Netflix. Even median P/S value, which is based on where the stock was traded in the past, understated where they should be traded.
To further understand these valuation approaches, we can take another look at the prices Buffett paid for three public companies Berkshire Hathaway acquired after 2009. Berkshire acquired Burlington Northern Santa Fe in 2010, Lubrizol in 2012, and Precision Castparts in 2016. The prices Buffett paid and the valuations calculated from different approaches around the times of announcement are included in the table below. If we assume that Buffett paid fair value for the acquisitions, book value, Graham Number, and EPV are too conservative; the stocks of good companies cannot be bought at those prices. DCF calculation and Peter Lynch Fair Value both give quite reasonable estimates of the fair value of these companies, as shown in the table below:
| Company | Date | Acquisition Price | Book Value | Graham Number | EPV | DCF | Lynch Fair Value | Median P/S Value |
| Burlington Northern Santa Fe | Sept., 2009 | 100 | 35 | 68 | 17 | 91 | 103 | 69 |
| Lubrizol Corp. | Sept., 2011 | 135 | 34 | 65 | 52 | 114 | 142 | 64 |
| Precision Castparts Corp | Dec., 2015 | 250 | 81 | 31 | 79 | 249 | 169 | 210 |
Keep in mind that, before the announcements of the acquisitions, the stocks of these companies were traded roughly 30 to 40 percent lower. That is the margin of safety we should rely on when we look at the stock price relative to the results from the DCF model. If we apply this thinking to the companies in the previous table, none of the stocks offer the margin of safety relative to the DCF model, except Apple.
The table below summarizes the calculation and applications of these intrinsic value calculation methods:
| Valuation Methods | Assets | Earnings Power | Combined | Growth Considered | Where to Apply |
| Net cash | x | No | Fire sale, money-losing companies | ||
| Net-net working capital | x | No | |||
| Net current asset value | x | No | |||
| Book value | x | No | Banks, insurance | ||
| Discounted cash flow (earnings) | x | Yes | Predictable revenue and earnings | ||
| Graham Number | x | No | Asset-heavy companies | ||
| Earnings power value | x | No | Asset-heavy companies | ||
| Peter Lynch Fair Value | x | Yes | Fast growers | ||
| Median P/S value | N/A | Stable average margin over cycles |
Rate of Return
Rate of return–based valuation, as suggested by its name, looks at the potential rate of return on the capital that is invested. Though not as popular as valuation ratios or intrinsic value–based valuation, rate of returns gives a straightforward indication of the returns that an investor can expect from this investment.
Rate of return–based valuation focuses on the earnings power of the investment. Its main advantage is that it can be used to compare the returns on alternative investments, such as CDs, money market funds, bonds, or real estate. In principle, investors should always invest in the assets that will generate the highest risk-adjusted returns.
There are two ways to calculate the rate of return with stocks: earnings yield and forward rate of return.
Earnings Yield
Earnings yield is simply the reciprocal of P/E ratio:

So, if a stock has a P/E ratio of 20, its earnings yield is 1/20 or 5 percent. In this school of thinking, earnings from a business are considered the return to the shareholders. Earnings yield is the rate of return on the price they pay. The return isn't necessarily in cash. It can be in the forms of cash dividends, or share value increase through share buybacks, debt payment, and reinvestments in the business.
Earnings yield is also sometimes calculated as EBIT/EV, that is, the ratio of earnings before interest and tax over enterprise value. In this calculation, it is the reciprocal of EV/EBIT, which is a variation of P/E, as introduced in the P/E ratio section. The advantage of the calculation is that it reflects the true price that investors pay by using enterprise value. The disadvantage is that interest and tax are real expenses to shareholders and the calculation results are only effective for comparisons among companies with similar effective interest rates and tax rates.
In earnings yield calculation, no credit is given to the growth of the company. A company that grows will generate higher returns over time and is more valuable. This factor is considered in the forward rate of return calculation.
Forward Rate of Return
Forward rate of return is a method that Don Yacktman applies in his investment approach.10 He defines forward rate of return as the normalized free cash flow yield plus real growth plus inflation. He views stocks as bonds, so it makes more sense to value an investment by the potential rate of return, just like with bonds.
Forward rate of return is calculated as:

Normalized free cash is the average of the free cash flow from the company over the previous market cycle. The growth rate is how fast the free cash flow will grow in the future. A stock has a higher forward rate of return if its price is low or the company's growth rate is high.
If we apply the calculations to U.S. retailers, we get:
| Company | Earnings Yield (%) | Earnings Yield (EBIT/EV) (%) | Forward Rate of Return (%) |
| Costco Wholesale Corp. | 3.5 | 5.6 | 11.5 |
| Dollar General Corp. | 6.1 | 10.4 | 15.3 |
| Dollar Tree Inc. | 3.9 | 6.0 | 19.1 |
| Target Corp. | 7.8 | 10.2 | 6.0 |
| Wal-Mart Stores Inc. | 6.5 | 9.0 | 7.8 |
With all three calculations, Dollar General seems more promising than the others because of its higher earnings yield and higher forward rate of return.
Both earnings yield and forward rate of return calculations can also be applied to the overall stock market. The results can be used to compare it with the returns on CDs, money market funds, and bonds. An equity risk premium over risk-free rate from short-term government bonds is usually required by investors because of the volatility and uncertainty of stock investments. This is also how the interest rate affects the attractiveness of the stock market from the aspect of the potential rate of return. I will discuss market valuation in detail in the next chapter.
As I conclude this chapter, I want to point out that investors should not be obsessed with the valuation calculations. All calculations involve assumptions. They are valid only if the underlying businesses perform as expected. Over the long term, investment return is more a function of business performance than the valuation, unless the valuation goes extreme. More effort should be put into identifying good businesses and buying them at reasonable valuations.