CHAPTER 6
Buy Good Companies: The Checklist
“If the path be beautiful, let us not ask where it leads.”
—Anatole France
I have spent three chapters examining good companies and fair prices. The idea is simple, but the details are complex. I want now to summarize the idea and process in a simple checklist.
Every investor should create his or her own investing checklist, no matter how he or she chooses to invest. As discussed extensively in his bestselling book, The Checklist Manifesto: How to Get Things Right,1 Atul Gawande wrote that checklists have been widely used in the medical and aviation industries because they simplify complex procedures and help doctors and pilots maintain their composure and discipline.
When US Airways Flight 1549 from LaGuardia Airport to Charlotte hit a large flock of birds and lost both of its engines, the first thing pilot Sully Sullenberger and his crew did was get out their checklists, according to Sullenberger's memoir, Highest Duty: My Search for What Really Matters.2 Humans being human, mistakes will inevitably occur. Checklist usage catches the errors, sets discipline and process, and helps avoid potential losses.
Hedge fund manager Mohnish Pabrai likens buying a stock to the takeoff of an airplane. Many successful investors have their own checklists to guide their investment processes, although they might not explicitly call them such. For example, Walter Schloss, the notable disciple of Benjamin Graham, averaged 15.3 percent compound return over the course of four and a half decades, versus 10 percent for the S&P 500, and followed his own 16 rules of investing, which cover valuation, discipline, conviction, and leverage.3 Philip Fisher, the father of growth investing, always asks himself 15 questions about the company he is interested in buying. He detailed these 15 questions in his book, Common Stocks and Uncommon Profits, and they cover the areas of market potential, management, the effectiveness of research and development, profit margin, labor relations, and share buybacks.4 Peter Lynch has a long list of questions he asks about each company, which can be different depending on the specific company situation.5
Checklist for Buying Good Companies at Reasonable Prices
Here, I summarize the questions we will ask for investing in good companies at fair prices, which have been examined in detail in previous chapters.
- Do I understand the business?
- What is the economic moat that protects the company so it can sell the same or a similar product five or ten years from today?
- Is this a fast-changing industry?
- Does the company have a diversified customer base?
- Is this an asset-light business?
- Is it a cyclical business?
- Does the company still have room to grow?
- Has the company been consistently profitable over the past ten years, through good times and bad?
- Does the company have a stable double-digit operating margin?
- Does the company have a higher margin than competitors?
- Does the company have a return on investment capital of 15 percent or higher over the past decade?
- Has the company been consistently growing its revenue and earnings at double digits?
- Does the company have a strong balance sheet?
- Do company executives own decent shares of stock of the company?
- How are the executives paid compared with other similarly sized companies?
- Are insiders buying?
- Is the stock valuation reasonable as measured by intrinsic value, or P/E ratio?
- How is the current valuation relative to historical range?
- How did the company's stock price fare during the previous recessions?
- How much confidence do I have in my research?
For the first 19 questions, we focus on the areas of business nature (questions 1–7), performance (questions 8–12), financial strength (question 13), management (questions 14–16), and valuation (questions 17–19).
The final question centers on how you feel about your research. Though it is not directly related to the company, your own analysis is a vital consideration. It determines your action once the stock suddenly drops 50 percent after you buy. That same 50 percent drop can trigger opposing actions depending on your level of confidence. If you are assured in your research, the 50 percent drop in price is a great opportunity to buy more of the stock at half the price. If you don't have confidence, you will likely be scared into selling at a 50 percent loss.
Trust me, it will happen after you buy the stock; and, paradoxically, it happens only after you buy. So, get prepared!
The Warning Signs
When you buy a house, you not only want to make sure that it meets your checklist of requirements on location, size, number of bedrooms and baths, and so on; you also want to make sure it doesn't have any hidden problems with the foundation, electrical system, AC, or plumbing—which is why you perform a home inspection. Therefore, in addition to the checklist that screens the stocks that meet our requirements, we also want to screen for things we don't want. GuruFocus developed a feature called Warning Signs, which undertakes a thorough inspection on the financial health and performance of companies. These warning signs are highlighted for each company. The purpose of Warning Signs is to advise you of red flags in certain areas of the company that you may have overlooked. These warning signs do not necessarily mean you should avoid buying the stock, but you should be aware of and accept them before you invest.
The Warning Signs checkup covers these areas:
- Financial strength
Financial strength of the company is ranked according to its debt burden as measured by interest coverage, debt-to-revenue ratio, and Altman Z-Score, and is ranked from one to ten. A rating of eight or above reflects strong financial strength. More on Altman Z-Score later in the list.
The distribution of the financial strength of U.S. companies is represented in Figure 6.1. Not surprisingly, most of the companies have an average financial strength. The companies that have a financial strength rating of seven or higher are considered financially strong.
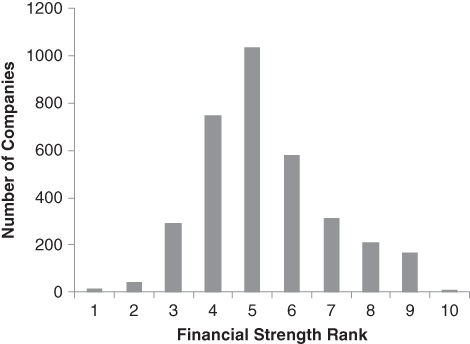
Figure 6.1 Financial Strength Distribution
If a company has a financial strength of four or less, investors need to watch out for an associated bankruptcy risk. A warning sign is triggered.
- Profitability rank
A company's profitability is ranked based on its operating margin, Piotroski F-Score, the trend of the operating margin, and the consistency of the profitability. More on Piotroski F-Score later in this list.
The distribution of the profitability ranking of U.S. companies is depicted in Figure 6.2. A company with the profitability ranking of four or less gets a warning on profitability.
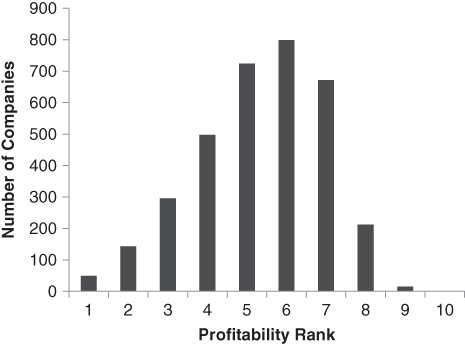
Figure 6.2 Profitability Distribution
- Revenue, earnings growth rate of ten-year, five-year, three-year, and one-year periods
This checks if the revenue or profit of the company is declining in any given period. If it is, a warning sign is triggered.
- Operating losses
This checks if the company has experienced operating loss over the past ten years. If so, a warning sign is triggered.
- Gross margin growth, operating margin growth
This checks if the gross margin and/or the operating margin of the company are declining. If any of the margins are, a warning sign is triggered.
- Asset growth faster than revenue growth
If a company's asset growth grows faster than its revenue growth, it means the company is becoming less efficient, especially if its asset growth is caused by borrowing. In May 2008, James Montier, fund manager at GMO, couldn't find opportunities to invest. He wrote an article about short selling called “Mind Matters: Joining the Dark Side: Pirates, Spies and Short Sellers” and in his research discovered that the ideal short candidates are the companies that have these three characteristics:6
- Stocks that are sold at a high P/S ratio
- Companies that have a low Piotroski F-Score
- Companies that have double-digit asset growth
He found that companies with any of these characteristics underperformed the market, which is why this is a warning sign.
- Days sales outstanding
Days sales outstanding measures how quickly the company can get paid after delivering its products. It is a financial ratio that illustrates how well a company's accounts receivable are being managed. Here we compare the average of days sales outstanding over the past 12 months with the average of the past five years. If it is getting longer, a warning sign is triggered. A longer days sales outstanding means that it takes more time for the company to get paid after a sale has been made, or it is selling its products on credit.
- Days sales of inventory
Days sales of inventory measures how quickly the company turns its inventory into sales. If this indicator is getting longer, it means that the company is having difficulty selling. We compare the average days sales of inventory of the past 12 months with the average of the past five years. If it is getting longer, a warning sign is triggered.
It is typical for a retailer to increase its inventory before the holiday season because it usually does more sales during this time than any other time. Therefore, this parameter needs to be compared with the same period from the previous year.
- Owner earnings diverged from reported earnings
Owner earnings is a concept Warren Buffett introduced in his 1986 shareholder letter.7 It measures the true earnings of the company from its existing operations to its owners. It is an estimated number from the financial statements of the company. If there is a long-term deviation between the owner earnings and reported earnings, a warning sign is triggered.
- Divergence between net income and free cash flow
Similar to owner earnings, free cash flow measures the net cash generated by the business. If there is a long-term deviation between the two, a warning sign is triggered.
When a company is in fast expansion, its earnings are usually reinvested into the business, which lowers its free cash flow. It doesn't necessarily mean there is something wrong with the company.
- Cost of capital higher than the return on invested capital
I have referenced return on invested capital many times. A company creates real returns only if its return on invested capital is higher than its cost of capital. For the purpose of the warning signs' checklist, however, if the cost of capital is higher than the return on capital, a warning sign is triggered.
- Issuance of debt
If the company keeps issuing new debt, it likely means that it cannot generate enough cash to fund its operations. This is certainly a warning sign. With more debt, the company may earn more, but its debt burden gets higher and its balance sheet gets weaker.
- Issuance of new shares
Similarly, if a company keeps issuing new shares, it probably means that it cannot generate enough cash to fund its operations and it cannot borrow. This is also a warning sign. With more shares, the shareholders are diluted.
If a company's stock price is at a very high valuation, issuing new shares benefits existing shareholders. In this warning sign, we don't distinguish the prices at which the company issues new shares.
- Altman Z-Score
Altman Z-Score was developed by NYU Stern finance professor Edward Altman in 1967.8 His study found that the score is an accurate forecaster of bankruptcy risk within two years. Therefore, it is also a measurement of a company's financial health, and thus, we use it to rank the financial strength of companies. It is calculated from the company's working capital, retained earnings, market cap, and so on. You can find a detailed example of the calculation and explanation by using this link: http://www.gurufocus.com/term/zscore/WMT/Altman-Z-Score/Wal-Mart-Stores-Inc.
If the Altman Z-Score is too low, a warning sign is triggered.
- Piotroski F-Score
Piotroski F-Score was developed by University of Chicago professor Joseph Piotroski in 2000.9 It uses nine indicators to measure a company's profitability, the changes in its profitability, leverage, efficiency, its quality of earnings, and so on. It gives a score between zero and nine for each company. The higher the score, the better. If the score is too low, a warning sign is triggered.
A detailed example of F-score calculation can be found here: http://www.gurufocus.com/term/fscore/WMT/Piotroski-F-Score/Wal-Mart-Stores-Inc.
- Beneish M-Score
Beneish M-Score checks the quality of reported earnings and is an indicator that measures if the company manipulates its earnings. It was developed by Indiana University professor Messod Beneish in 1999,10 and it considers the relationship between accounts receivable, revenue, gross profit, current assets, depreciation, current liabilities, and others to determine the quality of earnings. A higher score indicates that the company might be manipulating its earnings.
You can find a detailed example of Beneish M-Score calculation here: http://www.gurufocus.com/term/mscore/WMT/Beneish-M-Score/Wal-Mart-Stores-Inc.
- Sloan ratio
Sloan ratio emerged from the 1996 study by Richard Sloan, a former University of Michigan researcher.11 He found that if a company's earnings include a significant amount of noncash earnings, its stock underperforms. Sloan ratio is calculated as the ratio of noncash earnings to assets. Therefore, Sloan ratio can be used to measure the quality of earnings. If Sloan ratio is high, a warning sign is triggered.
An example of the Sloan-ratio calculation can be found here: http://www.gurufocus.com/term/sloanratio/WMT/Sloan-Ratio/Wal-Mart-Stores-Inc.
- Interest coverage
I have explained interest coverage in detail. It is defined as the ratio of a company's operating income to the interest payment on its debt. The higher the ratio is, the lower the debt burden is. Therefore, it is also a measure of the financial health of the company. If the interest coverage is low, a warning sign is triggered.
- Dividend payout ratio
Dividend payout ratio is the ratio of annual dividend per share to its annual earnings per share. Dividend is the cash distribution of earnings to shareholders. It comes from earnings and must be supported by earnings. If a company's dividend is consistently a large percentage (e.g., 80%) of earnings, it may not be sustainable.
- Short percentage of float
This warning sign triggers when the company's shares are heavily shorted. In Chapter 4, I used the example of short attacks on Fairfax Financial, where the stock was manipulated by the short attackers. But many times, short sellers are right. Companies do lie, and short attackers can police their acts. A study by former University of Chicago researcher Owen Lamont in 2003 found that in the three years after the attacks by short sellers between 1977 and 2002, the companies' stocks underperformed by 42 percent on average, even though these companies professed innocence by suggesting they were the subjects of a bear raid or conspiracies, or they alleged that the short sellers were lying.12 The shorts were mostly right—often it was the companies that were lying and conspiring to defraud investors, not the reverse! The short sellers may know something that others don't.
Of course, this is not always the case. In the example of the Fairfax Financial short attack in the mid-2000s and the high-profile short attack on EBIX and Herbalife in the mid-2010s, the companies were found by government investigators to have committed no wrongdoing. The settlements turned out to be much smaller than the short sellers had advertised and hoped for. In all situations, it is important to understand the short theses of the attackers. Many of them attacked the companies to manipulate the stock prices for short-term gains, too. In any case, it is a warning sign when the short ratio is high.
- Dividend yield relative to historical range
Here we check the current dividend yield relative to its historical range for the periods of ten years, five years, three years, and one year. If the current dividend yield is close to the historical lows, a warning sign is triggered. Usually a lower dividend yield is associated with a higher price.
- Stock price relative to historical range
This item checks the current price relative to the historical price range for the periods of ten years, five years, three years, and one year. If the stock price is close to historical highs, a warning sign is triggered.
- Valuation ratios P/E, P/B, P/S relative to historical range
This item checks where the valuation ratios price-to-earnings (P/E), price-to-book (P/B), and price-to-sales (P/S) currently stand relative to their historical ranges for the periods of ten years, five years, three years, and one year. Normally, you don't want to buy a stock when it is most expensive relative to where it was traded historically. If any of the valuation ratios are close to historical highs, the warning sign is triggered.
- Higher forward P/E
Forward P/E is calculated as the current stock price divided by the next year's earnings as estimated by analysts. If a company's forward P/E is higher than the current P/E, it means that Wall Street analysts expect its earnings to decline. This is a warning sign. There can be big misses from analysts' estimates.
- Buyback track record
If a company is buying back its own stock, it is usually considered a positive sign. With this item, we check the track record of the company with its buybacks over the past. If it doesn't have a good track record, the warning sign is triggered. This means that the company is not good at timing its buybacks.
- All insiders selling and no insiders buying
If a company's executives and directors are selling its shares heavily, and no insider buys, a warning sign is triggered.
- Tax rate
In principle, if a company pays a lower tax rate, it is good for shareholders. But if a company claims good earnings but pays a lower tax rate, investors need to know why. Is this due to a tax haven, poor quality of earnings, or other reasons? This warning sign triggers if the tax rate the company pays is too low.

We perform a thorough inspection of the company with these questions, just like the annual checkups we undergo at a doctor's office. It is impossible for a company to trigger no warning signs. These warning signs may not stop us from buying the stock, but they should be taken into consideration when we buy.
The checkup questions are based on the company's financial data. Therefore, none of them should replace your work of understanding the business and learning about its products, its customers, its suppliers, its competitors, and the people who work in the company. The warning signs serve as reminders of where you are. They are not meant to substitute for understanding. If we paid attention only to the numbers and signs and ignored the business itself, we would be like the business consultant in this joke:
If we gain a solid understanding of the business, these numbers and signs will help us to appreciate where we are and where we are probably going. If business understanding is qualitative and the numbers are quantitative, both are needed to gain the confidence we need for our research.
Positive Signs
In opposition to the warning signs, some signs are positive and indicate that the company is improving its operation or that management is more confident about the company. These signs are complementary to the strong balance sheet, high business returns, and revenue and earnings growth that come with the good companies we want to buy.
- Profit-margin growth
Long-term and steady growth in profit margins is a strong indication that the company is doing well. As the company grows its sales, it gets better at what it does and becomes more productive; also, its customer acquisition cost may not grow as fast, which leads to faster profit growth than sales growth, that is, profit-margin growth.
Long-term, steady profit-margin growth can be powerful. For example, AutoZone, the auto parts retailer, was able to grow its gross margin from 48.9 percent in 2005 to above 52 percent in 2015. This increase of gross margin was achieved mainly by lower product acquisition costs and lower shrinkage expenses. Although 3 percent doesn't look like a lot, most of this enhancement is translated into the improvement in operating margins, which increased from 17.08 percent in 2005 to 19.17 percent in 2015. The seemingly small improvement of 6.3 percent in gross margin results in a much higher 12 percent improvement in operating margin. Therefore, during the past ten years, AutoZone's earnings have been growing faster than its sales growth. Its return on invested capital improved from 30 percent in 2005 to 46 percent in 2015. Its stock gained more than 700 percent during this period.
For any business, even if it is at the same level of operation, its operating cost gradually increases because of inflation-induced higher costs of salary, rent, and maintenance. It has to grow its sales at least faster than inflation to be sustainable over the long term.
Two things can lead to profit-margin growth. I want to use the example of a retail chain to explain. For a chain store that grows by opening more stores, its cost on inventory management, marketing, and administration does not grow as fast as the number of its stores. As the company opens more stores, its profit margin increases. This is growth-driven profit-margin growth. If the chain store no longer opens new stores, it can still make more money by selling more at each store. This is productivity-driven profit-margin growth.
The two parts of profit growth can exist at the same time. A company must control cost as it grows. The productivity-driven profit-margin growth is an indication of the competitiveness and pricing power of the business.
- Share buyback
Instead of issuing new shares that dilute shareholder value, the company is buying back shares. Usually the buyback is considered as returning value to shareholders. It may drive up the stock prices as the profits are now distributed on a smaller number of shares.
Not all share buybacks are created equal, as pointed out by Buffett. Share buyback is valuable only if the company buys back its shares at below the intrinsic value of the stocks. If a company buys back at above the stock's intrinsic value, it destroys value for the remaining shareholders over the long term. This is why Buffett set a threshold for the share buyback at Berkshire Hathaway, which is 1.2 times the book value of the shares.
We have observed all kinds of behavior with companies' buybacks. Companies like AutoZone, Wal-Mart, and Moody's have been buying back every year since 2000. They buy back their shares without regard for the valuation. Others, like Netflix, sometimes bought back shares, but issued more shares at other times. With the interest rate at all-time lows, as it is currently, some companies issued debt to support the share buyback.
Share buyback inevitably weakens the balance sheet of the company. While enjoying the support of stock prices by share buybacks, investors need to look at long-term effects. In the first half of the 2000s, Washington Mutual, the largest savings and loan bank at the time, spent billions to buy back its shares. When the financial crisis hit in 2008, the company became insolvent and was seized by the government, and shareholders lost all their money. Washington Mutual would have been in a much better position had it kept the cash on its balance sheet. Sears spent close to $5 billion buying back shares from 2006 to 2013. Now it has to borrow money to support its continuing struggle. Its market cap is less than one-fifth of what it spent on buybacks. The buyback benefited only those who sold out at the time. The remaining shareholders were left holding the bag.
- Raising dividends
If a company is raising dividends, it means that the company is confident in its profitability. It is a positive sign. But as with share buybacks, paying dividends weakens the balance sheet of the company. Investors need to think about its effect over the long term.
- Paying down debt
Paying down debt is always good for a company to do, although it may reduce return on equity as the company is now less leveraged.
- Insider buying
The only reason insiders are buying their own company's shares is because they think they will go up, as Lynch pointed out. Academic studies also found that insiders are mostly long-term value investors. They buy their own company stocks when they think their companies are favorable as long-term investments.13
The checklist is a useful tool for investors to maintain discipline in their stock picking. The warning signs and positive signs can help investors gain a deeper understanding of the company and build the confidence necessary to direct their future actions.
Lynch once suggested that investors write a note for every stock they research and buy, then compare the company's business performance with these notes over time to see if the original investment thesis still holds.14 The checklist, warning signs, and positive signs explained in this chapter should also be included in the research notes.
With all these procedures, we hope to reduce errors and failures and avoid the value traps that ensnare many value investors.