CHAPTER 5
Buy Good Companies at Fair Prices
“Anything worth doing is worth doing slowly.”
—Mae West
In the previous two chapters, I examined the kinds of companies that qualify as the “good companies” we will buy and where to find them. But buying good companies itself does not guarantee good results. It works only if they are bought at fair prices. I have asserted that if you buy a good company, there is no risk of permanent loss of capital as long as its business continues to perform well and the company's value keeps growing. But any excess payment above the fair price will eat into your returns.
For example, riding the tide of the stock market bubble, Wal-Mart stock gained more than 500 percent in three years, to around $70 a share by the end of 1999. Then it took 12 years for anyone who bought Wal-Mart stock at the end of 1999 to break even. Even today, Wal-Mart is barely higher than it was 16 years ago. Wal-Mart certainly met the good-company requirement in 1999. It had been always profitable, had a ROIC in the mid-teens, and grew its earnings at double digits. But the problem was that the stock was overvalued. It had a P/E ratio of 60 at the end of 1999. Today, the P/E ratio of the stock is 16. Wal-Mart has quadrupled its earnings from 1999, but those who bought in 1999 have not benefited because they overpaid for the stock.
Another example is Coca-Cola. The stock was traded at $43 (split-adjusted) in the middle of 1998. After 18 years, today the stock is traded at below $43. Coca-Cola is a great company. Warren Buffett bought it in 1988. Its return on invested capital was above 30 percent in the 1990s. But from the middle of 1998 to today, the stock hasn't done much. The reason is the same as it is for Wal-Mart. The stock was even more overvalued than Wal-Mart's. In the middle of 1998, the stock was traded at the P/E ratio of 95. The only returns investors received over those 18 years are in the form of dividends, which have averaged a dismal 2 percent. The 400 million shares of Coca-Cola that Berkshire Hathaway owns was worth $17 billion 18 years ago. It remains worth that much today.
As a reminder, you can check out the historical P/E ratios and dividend yields and numerous other key statistics using GuruFocus's Interactive Chart.
To some extent, Buffett regretted not selling the overvalued stock later, after the 1999 bubble burst. He wrote in his 2004 shareholder letter:1
Therefore, satisfactory returns can only be achieved if stocks are bought at reasonable prices.
I have previously compared the long-term holding of great companies to marriage. Charlie Munger said that the secret to a happy marriage is to find someone who has low expectations. This applies as well to the investor's marriage to a good company. High expectations from the market create overvaluation, which will not generate pleasant results for those involved.
So, what kind of valuation is fair? There are many ways to evaluate businesses. Each may apply to a different situation, depending on the nature of the business itself. I will discuss the different valuation methods in further detail in Chapter 9. Here, I will focus on the two most common methods: the discounted cash flow model (DCF) and price/earnings (P/E) ratio. Both have limitations and cannot be applied to every situation, but both work quite well for the good companies we want to buy. They are ultimately equivalent in assessing the fair values of businesses.
Discounted Cash Flow Model
The theory of discounted cash flow (DCF) was originated by John Burr Williams in his PhD thesis at Harvard in 1937. It was published in 1938 as a book titled The Theory of Investment Value.2 The theory for the discounted cash flow model can be summarized as: The value of any stock, bond, or business today is determined by the cash inflows and outflows—discounted at an appropriate interest rate—that can be expected to occur during the remaining life of the asset.
Therefore, the DCF model is looking into the future. But we know only the past. We have to make some assumptions about the future, though many of these are based on how the business did in the past. These assumptions include:
- The future business growth rate
- The number of years of the business's remaining life
- The discount rate
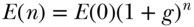
Assuming the business is currently earning  in free cash flow per year and the business growth rate is
  , in
, in  years the business will earn this much:
After n years, the amount  is not worth as much as the present value of
  ; it has to be discounted to its current value, which is equal to:

where  is the discount rate. If the business can consistently do this for
  years, the total earnings over the years will be:
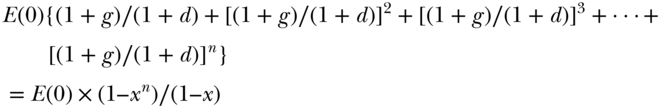
where 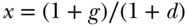 .
.
Obviously, no business can grow forever. At some point the growth will slow and then cease. But the business still has its value for as long as it is generating cash for its owners. Therefore, we divide the business into two stages. One is the growth stage; the other is the terminal stage. Assume at the terminal stage that the business growth rate is  after
after  years of growth at the rate of
  . The duration of the terminal stage lasts
  years. The terminal value of the business will be:
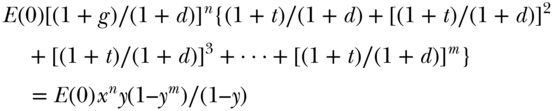
where  .
.
Putting everything together, as established by the DCF model, the intrinsic value of a business can be calculated using this equation:

Therefore  where
where  , and
, and  .
.
This is the intrinsic value equation based on the discounted earnings. These are the parameters used in the equation:
| E(0) | = | current earnings (Here I don't explicitly distinguish earnings and free cash flow as the formula works for both cases in the same way.) |
| G | = | the growth rate at the growth stage |
| d | = | the discount rate |
| t | = | the growth rate at the terminal stage |
| n | = | the number of years at the growth stage |
| m | = | the number of years at the terminal stage |
GuruFocus has created a two-stage fair value calculator based on the DCF model. We assume by default that the growth rate of the growth stage of the next ten years is equal to its average earnings-per-share growth rate in the previous ten years or 20 percent, whichever is smaller; the growth rate in the terminal stage is 4 percent, which also lasts ten years. We used earnings (without nonrecurring items) per share instead of free cash flow per share for the calculation because our studies found that over the long term, the stock prices are more correlated to earnings than free cash flow. The default discount rate is 12 percent. GuruFocus also calculates the margin of safety here, which is calculated as:

You can get the current intrinsic values and the margin of safety of any stock traded worldwide with the discounted cash flow model on GuruFocus.com. The link for Wal-Mart is: http://www.gurufocus.com/dcf/WMT.
A more complex three-stage DCF model can also be set up in a similar way. But it is unnecessary as the calculation itself is an estimate and more assumptions will not give better results.
It's helpful to have the intrinsic value and the margin of safety for the stocks you are interested in, but investors need to be aware of the limitations of the DCF model. First, the DCF model is attempting to predict the future performance of the business. Therefore, the business needs to be predictable. The companies that have steadier growth are more predictable than those with fluctuating earnings. These companies are usually ranked highly with GuruFocus's Business Predictability Rank. The calculation results for those companies are more reliable. The DCF model is not applicable to the companies that have large fluctuations with business performance. The model also does not apply to situations such as asset plays, turnarounds, or cyclicals.
For the companies that have predictable earnings, the assumptions on the calculation parameters can drastically affect the results. The parameters need to be carefully chosen to reflect the real performances of the companies. Next, I discuss the impact of each parameter on the calculation of intrinsic value and how they should be selected in the calculation.
Growth Rates
In GuruFocus's DCF calculator, we assume that in the next ten years a company will grow as fast as it did in the previous ten years. But this will most likely overestimate the growth of the company, especially if the company was growing quickly. Applying a 20 percent growth rate cap reduces overestimation. For example, Priceline averaged 40 percent per year in EPS growth over the past ten years. But for the past five years, the growth rate slowed to about 25 percent. It seems reasonable to assume that it will grow at about 20 percent per year in the next ten years.
For the terminal growth stage, the growth rate of 4 percent per year is probably too low for companies like Priceline. This may underestimate its intrinsic value; 4 percent per year is slightly higher than the long-term inflation rate.
The effect of the growth rate on the value of the business is illustrated in Table 5.1. We assume that the company is earning $1 per share now. Its terminal growth rate is 4 percent. The discount rate is 15 percent. The duration of both the growth period and terminal period is 10. At different growth rates, as reflected in the first column of the table, the value is displayed in the last column.
Table 5.1 Dependence of Value on the Growth Rate
| Growth Rate | Growth Value | Terminal Value | Total Value |
| 10% | 7.9 | 3.8 | 11.7 |
| 11% | 8.3 | 4.2 | 12.5 |
| 12% | 8.7 | 4.6 | 13.3 |
| 13% | 9.1 | 5.0 | 14.1 |
| 14% | 9.5 | 5.5 | 15.0 |
| 15% | 10.0 | 6.0 | 16.0 |
| 16% | 10.5 | 6.5 | 17.0 |
| 17% | 11.0 | 7.1 | 18.1 |
| 18% | 11.6 | 7.8 | 19.3 |
| 19% | 12.1 | 8.4 | 20.6 |
| 20% | 12.7 | 9.2 | 21.9 |
| 21% | 13.4 | 10.0 | 23.3 |
| 22% | 14.0 | 10.8 | 24.9 |
| 23% | 14.7 | 11.7 | 26.5 |
| 24% | 15.5 | 12.7 | 28.2 |
| 25% | 16.3 | 13.8 | 30.1 |
Obviously, at a higher growth rate, the stock is worth more. If a company grows at 25 percent per year for the first ten years, then grows 4 percent for the next ten, its stock is worth about 30 times its earnings, as we can see from the table. This coincides with Peter Lynch's rule of thumb that a fair P/E ratio for a company is roughly its growth rate. Of course, the fair value calculation result is affected by the discount rate. If the discount rate is 12 percent instead of 15 percent, the values move higher and Lynch's rule of thumb would seem conservative. During Lynch's years at Fidelity, the interest rate was in double digits. The higher discount rate was justified.
Number of Years for Growth and Terminal Stage
The number of years in the growth and terminal stages that are used for calculation can also vastly affect the calculation results. The reasonable assumption for the number of years varies from business to business. If you have teenaged children, like I do, you have surely noticed how they liked Aeropostale T-shirts. The adolescent T-shirt chain store was unstoppable, growing at 50 percent a year in the early 2000s. Then it hit a wall. Its revenue started to decline in the early 2010s and its stock has since lost more than 99 percent. If we use the DCF model to calculate its intrinsic value in the early 2000s, it would be too generous to assume that it has 20 years of life remaining.
Heard of “live fast, die young”? This saying seems also applicable to the life of businesses. Yet the opposite is also true!
Just as Buffett said, for a business that operates in a fast-changing industry, either no action, or acting too slowly, or acting incorrectly can cost it its life. The businesses that have a long life expectancy are the ones that can sell the same products and services 5, 10, or 20 years from the present. The required change in the business is minimal, and that provides the opportunity to keep improving in making and selling its products while building a network effect, brand recognition, taste habits, and addictions.
Consider Coca-Cola. For more than 100 years, the company has been selling essentially the same soft drink it introduced in the late nineteenth century. The assumption of ten years in the growth stage and another ten in the terminal stage would drastically underestimate the intrinsic value of the company. Curiously, in 1985, almost a century after its debut, Coca-Cola tried to make changes to its product and invented a new formula called “New Coke.” But then it found that Coke drinkers preferred the “good old days” and were opposed to the new taste. The company gave in and returned to the old formula. With this lesson behind it, Coca-Cola will probably stay with the same formula for at least another century.
The number of years used in the calculation is how the economic moat is reflected on the intrinsic value of a business. With a wide economic moat, a company can protect its territory and maintain its profitability for the long haul. The number of years used in the calculation needs to be greater.
Another example is See's Candy. For all the future cash flow the company would generate, Buffett paid $25 million in 1972. Table 5.2 uses the real earnings numbers for See's Candy's from 1972 to 1999,3 except for the years 1973 to 1975, when Berkshire didn't disclose the earnings numbers. Instead, I assumed linear growth from 1972 to 1976. All the earnings after 1972 are discounted to the year of the purchase, 1972, with the discount rate of 25 percent a year. The last column shows the cumulative discounted earnings of See's from 1972 to the year calculated.
Table 5.2 See's Candy Earnings and Discounted Earnings
| Year | Pre-tax Earnings ($M) | Discounted Earnings ($) | Cumulative Earnings ($M) |
| 1972 | 4.2 | 4.2 | 4.2 |
| 1973 | 6.0 | 4.8 | 9.0 |
| 1974 | 7.8 | 5.0 | 14.0 |
| 1975 | 9.5 | 4.9 | 18.9 |
| 1976 | 11.0 | 4.5 | 23.4 |
| 1977 | 12.8 | 4.2 | 27.6 |
| 1978 | 12.5 | 3.3 | 30.8 |
| 1979 | 12.8 | 2.7 | 33.5 |
| 1980 | 15.0 | 2.5 | 36.0 |
| 1981 | 21.9 | 2.9 | 39.0 |
| 1982 | 23.9 | 2.6 | 41.5 |
| 1983 | 27.4 | 2.4 | 43.9 |
| 1984 | 26.6 | 1.8 | 45.7 |
| 1985 | 29.0 | 1.6 | 47.3 |
| 1986 | 30.4 | 1.3 | 48.7 |
| 1987 | 31.7 | 1.1 | 49.8 |
| 1988 | 32.5 | 0.9 | 50.7 |
| 1989 | 34.2 | 0.8 | 51.5 |
| 1990 | 39.6 | 0.7 | 52.2 |
| 1991 | 42.4 | 0.6 | 52.8 |
| 1992 | 42.4 | 0.5 | 53.3 |
| 1993 | 41.2 | 0.4 | 53.7 |
| 1994 | 47.5 | 0.4 | 54.0 |
| 1995 | 50.2 | 0.3 | 54.3 |
| 1996 | 51.9 | 0.2 | 54.5 |
| 1997 | 59.0 | 0.2 | 54.8 |
| 1998 | 62.0 | 0.2 | 55.0 |
| 1999 | 74.0 | 0.2 | 55.1 |
The reason I used a steep 25 percent discount rate is that Buffett was concurrently growing the book value of Berkshire Hathaway at 25 percent a year. Therefore, by 1999, which is the last year that Berkshire reported See's revenue and earnings separately, See's had generated $55 million of pretax earnings in 1972 dollars. If I used a more generous 15 percent discount rate, for Buffett the earnings would be worth $114 million in 1972 dollars. If the discount rate is 12 percent, the cash flow is worth $154 million in 1972 dollars. After paying tax, it is still worth around $100 million. Thus, the $25 million Buffett paid for See's Candy in 1972, which he thought was expensive, was really less than 70 cents on the dollar after the tax payment. It was a bargain, considering the quality of See's business.
Nevertheless, See's life didn't stop in 1999. Just ask the Berkshire shareholders, who stood in long lines to buy the candies during shareholder meetings. To be honest, I find See's chocolates too sweet; I like the nuts and chews better. And those candies are expensive. I wouldn't buy them if I weren't a Berkshire shareholder. Yet See's continues to prosper. In the 15 years from 2000 through 2014, it generated more than $1 billion in pretax earnings for Berkshire Hathaway.4 The earnings are worth more than $500 million if discounted to year-2000 dollars with a discount rate of 12 percent. Buffett could still sell See's for $500 million in 2000, after generating all the cash flow and originally paying only $25 million. See's life didn't stop in 2014, either. Cash continues to flood in.
I have emphasized the application of the DCF model to Coca-Cola and See's Candy. The point is that the life expectancy of the business is a vital factor when considering buying a company. The companies that have the luxury of changing slowly can stay in business longer and are more valuable to their shareholders.
Is this why the turtle lives so long? I wonder, between the rabbit and the turtle, which one covers more distance during its lifetime.
The effect of the number of terminal years on the intrinsic value is reflected in the table below. Again, we assume that the company is earning $1 now. The discount rate is 12 percent. The growth stage lasted ten years and the growth rate was 12 percent. The terminal growth rate was 4 percent.
| # of Terminal Years | Growth Value | Terminal Value | Total Value |
| 10 | 10.0 | 6.8 | 16.8 |
| 15 | 10.0 | 8.7 | 18.7 |
| 20 | 10.0 | 10.0 | 20.0 |
We can see that if we increase the number of terminal year growth from 10 to 20, the value of the stock is increased by about 20 percent. Further increase in the number of terminal years will not increase the value by much because of the discount, but a business with a longer life is definitely more valuable.
Discount Rate
I mentioned the effect of the discount rate briefly in the See's Candy calculation. Table 5.3 lists the discounted values for the $859 million pretax earnings that See's Candy earned from 1972 through 1999 at different discount rates if discounted to the year 1972, when Buffett bought See's. Clearly, the discount rate can also wildly affect the intrinsic value calculation.
Table 5.3 See's Candy Pretax Earnings as Discounted to the Year 1972 at Different Discount Rates
| Discount Rate | Earnings Discounted to Year 1972 ($million) |
| 25% | 55.1 |
| 23% | 62.1 |
| 20% | 75.8 |
| 17% | 95.6 |
| 15% | 114 |
| 12% | 153 |
| 10% | 192 |
So, what is a reasonable discount rate that an investor should use in the calculation of the intrinsic value of a stock? Academically, one should use the weighted average cost of capital (WACC) for the discount rate. But the reasonable discount rate is the rate of return you can achieve if you invest the money somewhere else. If you plan to invest in stocks, the discount rate should be the expected rate of return from a passive investment such as an index fund or ETF. That is why we used a 25 percent discount rate in the calculation for See's Candy—it is the rate of return Buffett was achieving with the book value of Berkshire Hathaway at the time. He could have put that $25 million somewhere else to achieve that kind of return.
If you also consider other options such as bonds, real estate, and so forth, the discount rate should be the rate of return you can expect from those investments plus a risk premium for investing in stocks. For instance, if you can get a risk-free return of 3 percent from a savings account, you should at least use a discount rate of 9 percent, with the additional 6 percent as the equity risk premium.
Therefore, the reasonable discount rate is highly dependent on the rate of return you can achieve from alternative investment options. In the current zero-interest environment, the possible returns from everything from bonds to real estate have declined. The discount rate should be reduced, too. Therefore, the values of stocks have increased. Stocks are traded at high valuations relative to historical levels, but this is probably justified by the current historically low interest rate.
For the example discussed in the previous section, the effect of the discount rate is illustrated in the table below. Both the growth and terminal stages lasted ten years and the growth rate was 12 percent. The terminal growth rate was 4 percent.
| Discount Rate | Growth Value | Terminal Value | Total Value |
| 18% | 7.59 | 3.16 | 10.75 |
| 16% | 8.29 | 4.05 | 12.34 |
| 14% | 9.08 | 5.23 | 14.31 |
| 12% | 10 | 6.8 | 16.8 |
| 10% | 11.06 | 8.91 | 19.97 |
This is the effect of the interest rate on the discount rate. Buffett calls the interest rate gravity. When the gravity is lower, everything flies higher.
Excess Cash
When Buffett bought See's Candy, the price he paid was actually $35 million instead of $25 million. But See's had $10 million in cash that it did not need in its operations. Buffett did not count that cash into his cost. In estimating the intrinsic value of businesses, any excess cash should be added to the discounted earnings. These days, companies like Microsoft and Apple have a tremendous amount of cash that they don't need for their operations. This cash should be added to the total of future earnings to get a more accurate valuation.
GuruFocus's fair-value calculator has an item called “Tangible Book Value.” You can add portions or all of that to the calculation to compensate for the excess cash the company may have.
Earnings vs. FCF
If you look at the intrinsic value equation:

other than the growth rate and discount rate, intrinsic value is proportional to  , which is the earnings for the past year. I haven't distinguished between earnings and free cash flow. The formula applies to both. Just replace
  with the earnings per share or free cash flow per share, whichever is preferred.
In GuruFocus's DCF calculator, we use earnings instead of free cash flow because our study found that historically the stock performance was more correlated to the earnings than to free cash flow. This finding was a little surprising because free cash flow is the real cash a business generates from its operations. But the free cash in any given year can be affected by the company's spending on property, plant, and equipment (PPE). For a company that is in steady operation, where the DCF model is applicable, the effect of the more random capital spending is smoothed out in earnings through the estimates of depreciation, depletion, and amortization (DDA).
An example is a company called Church & Dwight, which produces Arm & Hammer baking soda and Trojan condoms. Its EPS has been rising steadily, but its free cash flow is doing anything but. In some years, its free cash flow was negative because the company spent more cash on PPE those years. (See Figure 5.1.) Similar behavior was observed with Wal-Mart, which also has steady operations and earnings but fluctuating free cash flow.
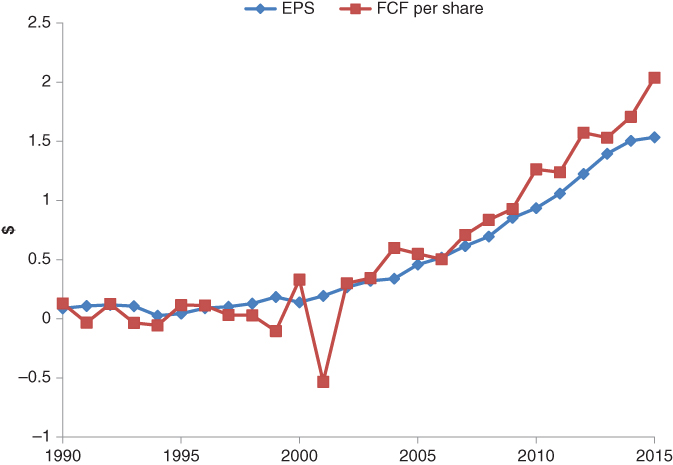
Figure 5.1 CHD EPS vs. FCF
In deciding which parameter to use for  , be aware of the impact of the onetime effect. Earnings can be distorted by a onetime boost from selling businesses or a tax rebate, or a onetime impairment from write-downs of inventories or other assets. With free cash flow, it may be even more random, as management's decision on spending in the year can have a major impact. The normalized earnings over several years is a better number. GuruFocus uses earnings without nonrecurring items in the past 12 months as the default.
Margin of Safety
The margin of safety is defined as:

It is the difference between the intrinsic value and the price that investors are willing to pay relative to the intrinsic value.
A common question is how much margin of safety is enough for one to buy a stock. The answer is, not enough. The more it is, the better.
Although we have beautiful formulae that seem able to calculate the intrinsic value to any accuracy we want, in reality it is only as accurate as the parameters we input for discount rate, the growth rate, the lifetime of the business, and so on. They are affected by factors such as the long-term economic characteristics of the business, the management, and external issues such as future tax rate and inflation, among others. All are about the future, and they come with much uncertainty. The required margin of safety is dependent on the degree of confidence you have regarding these factors.
Furthermore, the intrinsic value of a company is never a fixed number. It changes all the time with the progress of business. A combination of good economic characteristics and capable management can grow the intrinsic value faster, whereas a business with poor economic characteristics can destroy value quickly. To verify this, consider how Buffett has grown the intrinsic value of Berkshire Hathaway while the business values of Sears, JC Penney, BlackBerry, and many other companies have eroded.
I have seen investors put too much belief in DCF calculations. Sometimes we receive questions from GuruFocus users such as why their calculation of the intrinsic value gets $60.01 per share while GuruFocus's DCF calculator gives $59.99 per share. With so many uncertainties in the calculation of intrinsic value, any result is simply an estimate, and the error is much higher than two cents on 60 dollars. The point of the calculation is to give investors a rough idea of where the intrinsic value lies. Remember what John Keynes said: “It is better to be roughly right than precisely wrong.”
I have also seen investors dismiss the DCF model completely. To its credit, DCF does give a quite reasonable valuation to the companies that have relatively consistent performance. We can see it from the recent acquisition decisions of Buffett. Berkshire Hathaway acquired BNSF Railway in 2010 for $100 per share, at the time the GuruFocus DCF model assigned an intrinsic value of $91. In 2012 Berkshire acquired Lubrizol Corp. for $135 per share while DCF calculated the value as $114 per share. In 2016 Berkshire acquired Precision Castparts Corp. at $250 per share, and DCF estimates that it was worth $249 per share.
Given the uncertainties with the DCF model, the higher margin of safety is obviously better. The stocks that can be purchased at higher discounts relative to their intrinsic values deliver higher returns to investors. The outperformance comes from the closure of the difference between the intrinsic values and the prices. We may also get higher returns from the deeper discounted price if we get the intrinsic value correct.
Of course, the market doesn't very often sell the stocks we want to buy at the prices we want to pay. As investors, we need to set ourselves an investment hurdle, as Donald Yacktman does with his investing. This hurdle can be the minimum difference between the price we want to pay and the value we will get. This hurdle is the margin of safety.
Reverse DCF
The reverse DCF valuation method is, as its name suggests, the reverse of the DCF model. Instead of assigning an intrinsic value to a business, the reverse DCF tries to see how much future growth is required to justify the current stock price.
The default input parameters of GuruFocus's reverse DCF calculator are:
- Earnings per share: the EPS from the past 12 months (Again, we use earnings instead of free cash flow.)
- The years of growth at the growth stage and the terminal stage: 10
- Terminal growth rate: 4%
- Discount rate: 12%
These parameters are the same as in GuruFocus's DCF calculation. All are adjustable, and adjusting any of them will trigger recalculation.
After you determine the expected growth rate, compare it with the past growth rates and ask yourself if the growth rate is possible with this company. If the calculated growth rate is higher than the past growth rates, the stock price might be ahead of itself. If the calculated growth rate is lower than the past growth rates, the stock might be undervalued.
Similar to the DCF calculation, reverse DCF applies only to the companies that have been profitable and have predictable revenue and earnings growth. Interestingly, when we released GuruFocus's reverse DCF Calculator in March 2013, someone asked why he got an infinite growth rate for Amazon.com. Well, in March 2013, we used Amazon's 2012 annual earnings per share as the default input for earnings, which was negative nine cents. For a company with negative earnings, the DCF model is not applicable and reverse DCF will tell you that no growth rate can justify the current price of the company.
In the case of Apple, the company has grown its revenue by 34 percent per year and its earnings by 47 percent per year over the ten years from 2006 to 2016. Assuming it will grow 20 percent per year over the next ten years, the DCF calculator thinks the stock is worth $243 per share. This is much higher than the current price of $108 per share and gives us a margin of safety of 56 percent. Now, if we switch to reverse DCF, it tells us that at the current price of $108 per share, the company will need to grow its earnings by 7.6 percent per year over the next ten years to justify its current price. Will Apple be able to grow at 7.6 percent per year over the next decade? The company's growth has slowed dramatically over the past 12 months. Will it restore its previous growth? This is the $64,000 Question when it comes to using the reverse DCF calculator.
Fair P/E Ratio
Though Benjamin Graham and Buffett talked extensively about intrinsic value, Peter Lynch rarely used the term. He prefers to measure stock valuations with P/E ratio. A growth stock has a fair P/E ratio; it is where the stock should be traded to justify its earnings and earnings growth.
The fair P/E ratio and the intrinsic value calculation are in fact talking about the same thing. If you look at the intrinsic value equation:

the equation for fair P/E should be:
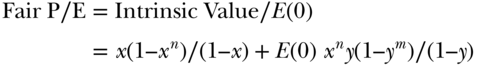
Therefore, the fair P/E is dependent on the future growth of the company and the discount rate, just as with intrinsic value. As I mentioned before, if we assume the discount rate is 15 percent, and ten years for both the growth and the terminal stages, and the growth rate is 4 percent, the fair P/E we get is close to the growth rate in percentages. This is Lynch's rule of thumb: that the fair P/E for a growth company is about the same as its earnings growth rate.5 If the discount rate gets lower, the fair P/E gets higher. This is the situation we are currently in. The interest rate has come to a historical low, which lowers the expected return of all assets and lifts their valuations.
Growth of Value
As I said before, a company's intrinsic value is never a fixed number. It changes as the business evolves. For a business that continues to grow its earnings power while maintaining its competitive advantage, its intrinsic value grows higher.
For example, when Buffett bought See's Candy in 1972, its intrinsic value was really $55.1 million, which is the total of the discounted earnings of the company for the 27 years from 1972 through 1999 at a 25 percent discount rate. When 1999 came, See's was in a position similar to that in 1972. Instead of being “terminated” as predicted in the DCF model, the company seemed to have no problem repeating what it did in the past 27 years, except it was now selling much more candy and at much higher prices. The company was therefore worth far more. At the same discount rate of 25 percent, the company was now worth 18 times what it was in 1972 because it was selling more than 18 times the candies in a dollar amount, and seemed like it would have no problem selling candies for another 27 years. Seventeen years have passed since 1999 and it appears that See's will continue to sell candies—and the business is worth even more. This is the growth of intrinsic value.
Of course, while See's continued to sell more candies for a greater profit and grew its business values, some companies destroyed their values and were indeed terminated. Remember RadioShack, Blockbuster, and Circuit City?
The myth persists that value investors don't value growth enough. The financial market divides investors into different categories: value, growth, momentum, and so on. Actually, value investors love growth. It is true that we love to buy dollar bills for 50 cents; we love it even more if we can pay 50 cents for the dollar bill that is growing. This kind of growth is found in the good companies this book urges readers to buy.
Of course, we don't want to overpay for that growth or for the growth that is not proven. That is probably the difference between value investors and others. Value investors seek to “buy and hold” and grow with the business or “buy low” when a business is undervalued and “sell high” if it becomes overvalued; growth investors look for “emerging” growth companies that have the potential to achieve high earnings growth but have not necessarily established a history of earnings growth; momentum investors try to “buy high and sell higher.” Paying $2 for something and hoping to sell it for $3 to someone else is not investing. It is speculating.
We also don't want to pay for the growth that is funded by ever more capital infusion and that loses ever more money as it grows. Incomprehensible as it seems, this is happening in the current market. Many companies become “unicorns,” which are supposed to be rare but are no longer. They are valued at tens of billions of dollars as they lose more money to “grow.” They spend heavily, bribing customers and hoping that competitors' pockets aren't as deep as theirs. It is a race to the bottom and is not the kind of growth we want to pay for.
I am reminded of a story about the energy secretary during Jimmy Carter's presidency, James Schlesinger.6 Schlesinger had a Harvard PhD in economics and at one time taught the subject at the University of Virginia. Two of his students were so influenced by him regarding capitalism that upon graduation they went into business. As the story goes, they were buying up firewood in the Virginia farm country and trucking it to the District of Columbia, where firewood was in high demand. As their business boomed, they found themselves working feverishly, nights and weekends, to meet demand. Thus, they were shocked when their bank reported that their working capital had been depleted and their truck repossessed. It turned out that they paid $60 per cord for the wood and then sold at $55 per cord. They went anxiously to professor Schlesinger and asked where they had gone wrong. Dr. Schlesinger puffed on his signature pipe a long moment before replying, “You should have bought a bigger truck.”
A different version of the story was also told by Howard Marks in one of his recent memos.7 The point is that if a business is selling its products and services at below its cost, the more it grows, the more money it loses. It is not a field in which we want to play.
“All intelligent investing is value investing,” as Charlie Munger said.8
How Can a Good Company Be Sold at a Low Price?
If a company's business is strong, wouldn't the stock market recognize this and give it a higher valuation? This is a valid question. Good companies are rarely sold cheap because the market does recognize their value most of the time, especially when things are peaceful. But there are so many players in the market—the buy side, the sell side, short sellers, long-term investors, day traders, stock brokers, the media, and the manipulators. They all exist for the same purpose: to make money. But they achieve this purpose in different ways. That's why a company's stock price can fluctuate more than 50 percent in a rather short period while its value barely changes. This gives opportunities to those who are prepared.
Then there are the not-so-peaceful times, which present additional opportunities for long-term investors. These turbulent periods can be divided into three types. The first type is a broad market panic. This usually happens when the economy is in recession and the market has collapsed. Investors have seen deep losses and think that the market will go down forever. So, they give up and sell everything regardless of its quality. Even the best companies are traded at bargain prices during this time. This happened twice in the past 16 years, during the recessions of 2001 and 2008. Each lasted quite a while, and investors had many opportunities to pick up good companies. This is the easiest time to buy great companies at good prices.
The second type is industry-wide distress although the broad market is relatively peaceful. Certain industries are out of favor and the stocks in that industry are traded at lower valuations than the broad market and their historical average. There are opportunities in this industry during such a time. This happened during the market bubble in the late 1990s, when many old-economy stocks were traded at distressed levels and they then outperformed tremendously after the tech bubble burst in the early 2000s. In the past year, energy stocks have been beaten down and have traded at far below their average valuations over the past decade.
The third type is when the broad market is peaceful and no broad opportunities exist in the industries in which you want to invest. This is a harder time to invest, but spots of opportunity may appear from time to time, caused by market manipulators or by influential investment firms. Remember the stock of Fairfax Financial? Short attacks erased 50 percent of its market value while the broad market was going up. Insurance software provider EBIX's stock lost more than 60 percent in less than a year when in 2012 short sellers published articles on popular financial websites to attack it. And steady business operator Church & Dwight saw its stock drop 5 percent when Goldman Sachs downgraded it in January 2016.
Then there are the times when the market panics for other reasons. Lauren Templeton, who is the great-grandniece of Sir John Templeton, compiled a list of these a few years ago:9
- Attack on Pearl Harbor (1941)
- Korean War (1950)
- President Eisenhower's heart attack (1955)
- Blue Monday (1962)
- Cuban missile crisis (1962)
- President Kennedy assassination (1963)
- Black Monday 1987 crash
- United Airlines LBO failure (1989)
- Persian Gulf War (1990)
- Tequila crisis (1994)
- Asian financial crisis (1997–98)
- September 11 (2001)
- Financial crisis 2008–2009
- European debt crisis (2010–2015)
I can add recent events, such as:
- U.S. government debt-ceiling crisis (2011)
- Ebola outbreak (2014)
- Brexit referendum (2016)
Thankfully, during the Ebola outbreak in 2014, only 11 people in the United States contracted the disease, and 9 of them were exposed outside the country. The market panicked anyway and quickly lost 10 percent.
How to be ready to react to these events? “Preparation, preparation, preparation,” just as Lauren Templeton said.
And from Charlie Munger: “Opportunity meeting the prepared mind; that's the game. Opportunity doesn't come often, so seize it when it comes.” So, act quickly when the time comes!
Of course, it is not easy to buy stocks when everyone else is selling, or when some powerful brokerage house is downgrading the stock. But this is the time to make a difference in your performance over that of others. Understand the nature of the business you want to buy and know the price you want to pay. Build enough confidence in your research and have enough conviction to act when opportunities arise. Independent thinking is the basic requirement for an investor to succeed, and independent thinking is built on knowledge and hard work.
If you haven't built the necessary confidence, stay away from the stock. If you have conducted solid research and have built a watch list for the stocks you want to buy, and know the price you want to pay, the opportunities will come.
Wouldn't It Be Even Better to Buy Good Companies at Lower Prices?
It is certainly better if we can buy good companies at low prices. But, most times you don't get to do this. In his early years running Berkshire Hathaway, Buffett was looking to buy “wonderful companies at very attractive prices.” As Berkshire grew larger and Buffett had far more money to invest, he gradually changed it to: “wonderful companies at attractive prices.” Later he again adjusted it to: “wonderful companies at fair prices.” Two factors changed his mindset. One is that his portfolio was getting so large, his investment universe had shrunk to only big companies.10 The other is market conditions. In an expensive market, it is simply impossible to find good companies at attractive prices.
Most of us don't have the problem of having too much money like Buffett. We just need to be patient and wait for opportunities. But what is the fair price to pay? A fair price is when you can still get above-market-average returns over the long term through the investment. With a fair price, you don't get additional returns from the closure of the gap between the price and the intrinsic value. Your returns are solely from the growth of the intrinsic value of the company. With the good company you are buying, the company is able to grow its value faster than the market average and you as a shareholder are rewarded.
Still, buying good companies at fair prices is far better than buying fair companies at good prices. You don't want to overpay, even for a good company. Remember the examples of Wal-Mart and Coca-Cola? If you pay too much, the closure of the price and intrinsic value works against you even when the company is growing its value faster than the market average.
Summary
I have used some formulas in this chapter to illustrate the DCF model and fair P/E. That makes stock valuation look like rocket science. But it is not. The formula itself is simple and the calculator is readily available online. The key is to choose which parameters to use, and that requires a full understanding of the underlying business. Without carefully choosing the parameters, there is no point in performing a DCF calculation.
Furthermore, there are many ways to evaluate a business. DCF calculation is just one, and it is only applicable to a very small subset of companies that have predictable revenue and earnings. The point of DCF or any other calculation is to give you a rough idea of where the right price rests for the stock. Always leave yourself a margin of safety.
At times, you will not be able to find any stocks of the good companies worth buying. It is time, then, to get prepared and wait for the opportunities to be presented by the market. And don't forget, before doing any calculation, investors should always look at the company's business and answer one question: Is this the good company we want to buy?
Buy only good companies and buy them at reasonable prices.