CHAPTER 3
Buy Only Good Companies!
“Take a simple idea and take it seriously.”
—Charlie Munger
Yes, there are better ways to make money!
Instead of buying companies with deteriorating values on the cheap and hoping things will improve, why not buy companies that grow value over time? Warren Buffett summarized in a single sentence the priceless lessons he learned from his personal “bargain-purchase folly.” These words should forever remain in the minds of investors: “It's far better to buy a wonderful company at a fair price than a fair company at a wonderful price.”
This is the philosophy that Donald Yacktman has relied on to help him build one of the best long-term track records. In the early 1990s, one of his sons suggested that he buy Chrysler. The stock was traded at around $10 and seemed like a bargain, but he told his son: “I think you are going to make money, but I just don't want to be in there. I just don't like the business.”
Yacktman explained his reasoning in his keynote address at the 2016 GuruFocus Value Conference:
Appreciate the point, Sears shareholders? Though the company has assets that seem valuable, when was the last time you actually shopped at Sears?
Yacktman likens buying companies that have mediocre business at bargain prices to riding moving sidewalks, and buying good companies to riding escalators—it is an escalator that keeps raising the value of the business. So, as investors, we should focus on these value escalators and buy only good companies!
Even if deep bargains exist among marginal businesses, investors should ignore these and instead pay attention to good companies. Good companies are what we want to buy, even if they don't look like a steal.
So, what kind of company is considered a good company?
What Are Good Companies?
A good company is one that can continuously grow value through its operations. It will be worth more tomorrow than it is today. As opposed to mediocre businesses that erode value over time, a good business can grow its value and do so consistently, as in Yacktman's analogy. The value of the company rises higher and higher and time is its friend.
The relationship between the value and price of good companies is illustrated in Figure 3.1. The value of the business is growing; over time, the stock price will follow the value and also move higher.
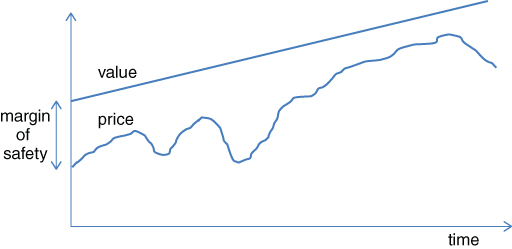
Figure 3.1 Price vs. Value for Good Businesses
Because the value of the business is growing—much like love in a marriage—many problems cease to exist. I hope you like this story:
A marriage counselor was giving a seminar to a room filled with people seeking marital advice. He projected his first slide, the key to a successful marriage, which showed just one phrase: “Love each other, forever.” Participants started to shake their heads and said the sentiment was hard to put into practice. Then the marriage counselor put up his second slide, which said: “If you cannot do that, now you need to follow these four rules: (1) Compromise, tolerate, and forgive. (2) Make it a habit to compromise, tolerate, and forgive. (3) Pretend to be a fool. (4) Make that a habit, too.” The participants grew more vocal, saying these four rules are impossible to follow. Waiting until they quieted down, the counselor put up his third slide, which said: “If you cannot follow these four rules, now you need to do these 16 things right: (1) Don't lose your tempers at the same time. (2) Don't yell unless it is an emergency. (3) When getting into an argument, let your spouse win. (4) Don't let an argument last overnight. (5) Always be ready to apologize…” After reading these, some laughed and some sighed. The counselor then showed his fourth slide, which said: “If you still cannot follow 16 rules, now you need to do these 256 things right…”
So, life is much easier if you can find companies that are growing their value. The following offer some of the advantages of buying good companies:
No Worries About Timing
Unlike buying mediocre businesses, where investors are forced to sell if the price is getting close to the value and they need to sell before the value erosion hurts the stock price, you only need to buy the stock at a reasonable price, and you don't have to worry about selling. You can indeed hold the stock forever because its value keeps going up. Of course, stock prices fluctuate, but they always follow the direction of value over the course of time.
More Forgiving with Purchase Price
A good company deserves a higher valuation. It is possible that you paid a slightly higher price than you wanted to pay for the stock, which lowers your overall rate of return, but time is on your side and your long holding time minimizes the impact of the higher purchase price to your overall return. Also, you will always find the opportunity to add to your position at lower valuations, though not necessarily at lower prices.
Buffett was reluctant to pay $25 million for See's Candy in 1972. Later he felt lucky that the seller accepted the price and it was such a bargain, although it didn't seem to be one to him at the time. Missing the opportunity to buy good companies at reasonable prices can cost much more!
No Risk of Permanent Loss of Capital
As Peter Lynch said, “Companies that have no debt can't go bankrupt.” Good companies have a strong balance sheet and can consistently generate profit. Their value continues to accumulate. Investors will sooner or later profit from holding good companies. In addition, an investor with the sense of buying good companies is also unlikely to pay an outrageous price for a stock. Again, time is on your side.
More Tax-Efficient
Clearly, with a long holding time, investors can grow their capital and defer tax payments on the capital gain, as long as they don't sell. Even if the investor does sell, the gain is taxed at a lower tax rate. Berkshire Hathaway has owned Coca-Cola for three decades and has $16 billion of capital gain on it, but Buffett hasn't paid a penny of capital gain tax because he hasn't sold any Coca-Cola shares.
You Sleep Better
You don't have to stay alert with a business that is steadily growing and cranking out cash, other than reading its quarterly and annual reports. You sleep better, which is, for an investor, extremely valuable.

So, how do I know if it is a good business? Investors can learn a tremendous amount about the quality of the business by simply looking at its historical financial statements. But looking at the financial statements from one year isn't enough. We should look at the financial statements of companies for at least one business cycle to see how the business has done during good times and bad. You can find the historical financial data of every company that is traded in the United States and in other countries on GuruFocus.com. We compile the historical financial data specifically for this purpose.
Of course, the requirement of at least one business cycle will exclude many companies that have short histories, or new IPOs. Investors should avoid new companies that haven't yet proven themselves.
Don't worry about missing the Next New Thing. Avoiding mistakes and danger zones is more important for long-term investment performance.
To see if a company qualifies as a good company, investors need to ask themselves three fundamental questions while consulting the historical financial statements of companies:
- Is the company consistently profitable at decent and stable profit margins, through good times and bad?
- Is this an asset-light business that has a high return on investment capital?
- Is the company continuously growing its revenue and earnings?
I will now expand upon each of the three questions.
1. Is the company consistently profitable at decent and stable profit margins, through good times and bad?
Just as Lynch said with “earnings, earnings, earnings,” people may bet the hourly wiggles in the market, but it's the earnings that waggle the wiggles, long term.1 “Demonstrated consistent earning power” is also an essential requirement that Buffett expects from the companies he might acquire.
If the company can consistently make money, its intrinsic value will steadily increase. Shareholders are rewarded through the growth of the business, share buybacks, or dividends. The value increases have a great impact on stock prices, too, because over a long period, price always follows value.
The table below shows the performances of the 454 companies of the S&P 500 companies that have been traded from July 2006 through July 2016. The first column is the number of years a company has been profitable, from fiscal year 2006 through 2015. The second column is the number of companies that were profitable during those same years. The third column is the average annualized gain of the stocks over the past ten years. The fourth and fifth columns are the number and percentage of stocks that are still losing money after ten years.
| Years of Profitability (2006–2015) | # of Companies | Average Annualized Gain % | # of Stock Losers | % of Stock Losers |
| 10 | 291 | 11.1 | 6 | 2% |
| 9 | 88 | 7.1 | 15 | 17% |
| 8 | 32 | 6.6 | 9 | 28% |
| 7 | 20 | 4.4 | 7 | 35% |
| 6 | 12 | 0.8 | 4 | 33% |
| 5 | 8 | 4.5 | 3 | 38% |
| 4 | 1 | 42.8 | 0 | 0% |
| 3 | 0 | |||
| 2 | 1 | –0.6 | 1 | 100% |
| 1 | 1 | 4.2 | 0 | 0% |
From the table above, we can clearly discern a correlation between the company's profitability and its stock performance. Out of the 454 companies that were traded for the last ten years, 291 or 64 percent were profitable every fiscal year from 2006 to 2015. On average, they delivered an annualized return of 11.1 percent a year over the ten-year period. The next group, which was profitable nine out of the ten years, had an average annualized gain of 7.1 percent, which underperformed the first group by a significant 4 percent a year. At the same time, only six stocks, or 2 percent in the first group, had a negative return through the ten years, while 17 percent of stocks in the second group lost money for those who held it for ten years. The next group included those that were profitable eight out of the past ten years and had an annualized average gain of 6.6 percent; 28 percent of the stocks lost money during the ten-year holding period. Again, it underperformed the second group and had more losses. The trend continues.
Therefore, if investors stick to companies that consistently make money, the chance of losing money is greatly diminished. The average gain is much higher.
One may wonder why the gain in the table above is higher than the gain of the S&P 500 Index over the past ten years. There are several deviations for this study from the Index itself:
- The constituent companies of the S&P 500 changed many times over the ten years while in the calculation they do not.
- No rebalance is involved in the calculation.
- All the stocks are initially equal weighted.
I have performed an additional calculation for all the U.S. companies that have been traded in the U.S. market over the past ten years. The results are represented in the table below:
| Years of Profitability (2006–2015) | # of Companies | Average Annualized Gain % | # of Stock Losers | % of Stock Losers |
| 10 | 1045 | 8.5 | 61 | 6% |
| 9 | 466 | 4.2 | 96 | 21% |
| 8 | 331 | 2.7 | 100 | 30% |
| 7 | 285 | 0.8 | 91 | 32% |
| 6 | 288 | –1.4 | 99 | 34% |
| 5 | 306 | –0.7 | 88 | 29% |
| 4 | 256 | –3.3 | 83 | 32% |
| 3 | 208 | –2.9 | 68 | 33% |
| 2 | 188 | –4.2 | 55 | 29% |
| 1 | 204 | –7 | 79 | 39% |
The conclusion is essentially the same as for the S&P 500 companies. There have been 3,577 companies traded continuously over the past ten years. Among these 3,577 stocks, 1,045 or 29 percent were able to make money every year. Collectively they averaged an annualized gain of 8.5 percent a year, doubling the gain of 4.2 percent generated by the second group, which were profitable in nine of the ten years. For the companies that were profitable six or fewer years over the past ten, the average gain is negative, even if held for ten years. Overall, the companies that are in the S&P 500 list did better than the average. The overall trend is highlighted in Figure 3.2.
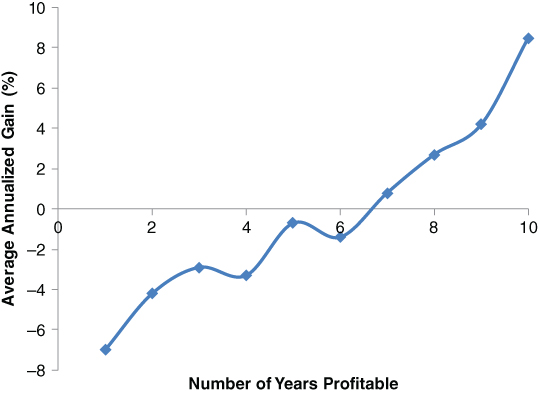
Figure 3.2 S&P 500 Gain vs. Years of Profitability
The possibility of losing money with any stock is greatly diminished for a company that is consistently profitable. The companies that were profitable over the ten years had a 6 percent chance of losing investors' money while the companies that were profitable nine out of the ten years had a 21 percent incidence of losing money. The trend continues, as is evident in Figure 3.3.
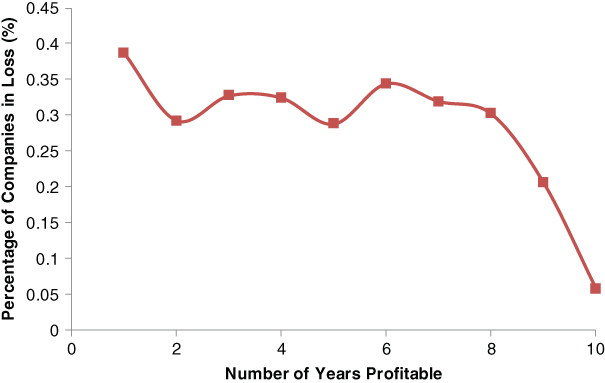
Figure 3.3 S&P 500 Loss vs. Years of Profitability
One may question whether the study is survival-biased because it only considers the companies that were traded ten years ago and are still traded today. Yes, it is survival-biased, but it is also heavily biased toward the companies that have been losing money. Those that continued to lose money and went bankrupt are not included. If they had been, the gain for the companies that lost money would be even smaller and the percentage of the companies that lost money would be even greater. As an example, SandRidge Energy, the company mentioned in Chapter 1, lost money in six out of the past ten years and has gone bankrupt and therefore has been delisted, but it is not counted toward the loss in the above table. The ones that kept making money but are no longer traded are delisted, mostly as a result of being acquired at a premium to the market price. Again, it proves that time is a friend of the good business and an enemy of the mediocre.
By simply investing only in the companies that are always profitable, investors can avoid losses and achieve above-average returns. But we cannot predict the future. Even if a company has always been profitable, that doesn't mean it will continue to be, which is why we want to invest in those that consistently have above-average profit margins. If a company can maintain a higher profit margin over the long term, it most likely has an economic moat that protects its pricing power from competition. A higher profit margin also leaves room for the business to stay profitable during bad times, when a low and unstable profit-margin business may fall into loss, which usually results in major punishment to its stock price.
A good question is what kind of profit margin is considered high. Figure 3.4 reflects the distribution of the operating margins (trailing 12 months of June 2016) of the 3,577 companies referenced earlier.
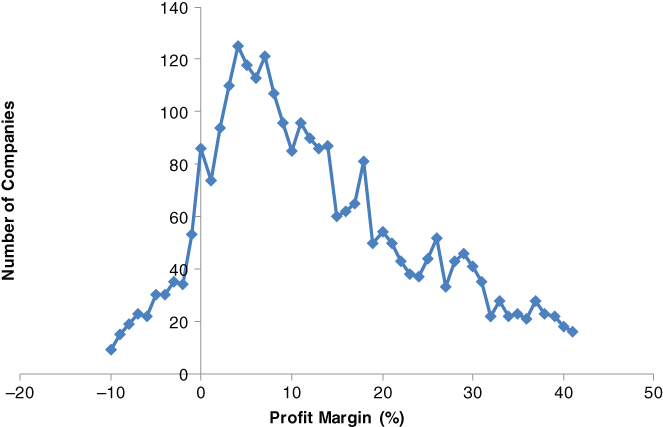
Figure 3.4 Profit Margin Distribution
Many companies have an operating margin between 3 and 8 percent. The median is 10 percent. Roughly 29 percent of companies have an operating margin higher than 20 percent; 16 percent of companies have a profit margin of 30 percent or higher; 12 percent of companies have been profitable and have a 10-year median operating margin higher than 20 percent over the past ten years.
Therefore, if we apply our requirement of consistent profitability with a 10-year operating margin of 20 percent, only 429, or 12 percent, of the companies in the United States qualify. That is actually quite a few. We will ask more questions about these companies and thereby eliminate many of them.
Interestingly, as long as a company was consistently profitable over the ten years, the absolute value of the operating margin didn't make a statistical difference on its stock performance over the past decade. As shown in Figure 3.5, for the 1,045 companies that were consistently profitable over the past ten years, there is no clear correlation between the average annualized gain of the stock and the median operating margin over the same ten-year period.
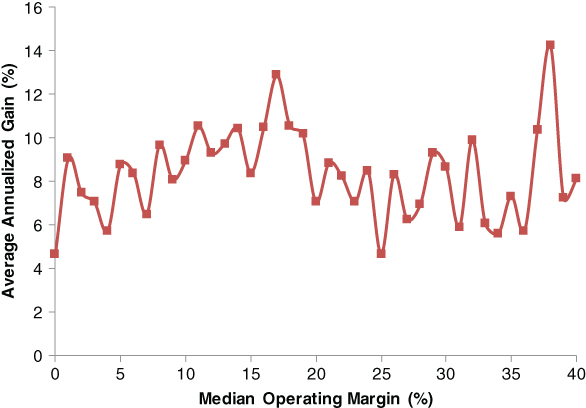
Figure 3.5 Gain vs. Profit Margin
The consistency of the operating margin is more important than its absolute number. But we still prefer those with higher margins because a lower profit margin leaves less room for error.
As an example, the table below gives the ten-year history of operating margins of Apple, Costco Wholesale, and Alcoa:
| Fiscal Year | 2006 | 2007 | 2008 | 2009 | 2010 | 2011 | 2012 | 2013 | 2014 | 2015 |
| Apple, Inc. | 13 | 18 | 19 | 27 | 28 | 31 | 35 | 29 | 29 | 30 |
| Costco Wholesale | 2.70 | 2.50 | 2.72 | 2.49 | 2.66 | 2.74 | 2.78 | 2.90 | 2.86 | 3.12 |
| Alcoa, Inc. | 11.93 | 9.69 | 2.94 | –8.12 | 2.61 | 6.01 | 2.00 | –6.03 | 4.25 | 3.32 |
Clearly, Apple has a much higher profit margin than Costco and Alcoa. Though Costco's profit margin is below 3 percent, its margin has been very stable. Its stock averaged more than 13 percent a year over the past ten. Alcoa fell into operating loss in the recessions of 2009 and 2013. After paying interest on its debt, Alcoa lost money in four out of the past ten years. The stock lost 64 percent over the past decade.
Therefore, to determine whether a business is good, consistent profitability is the first and foremost question to answer. Always remember Lynch's earnings, earnings, earnings—businesses are set up to make money. Only those making money can be sustainable. Being able to make money consistently is an essential requirement for a company to qualify as a wonderful business. Isn't this obvious and just common sense?
2. Is this an asset-light business with a high return on investment capital?
If you've ever run a business, you will know how hard it is to run an asset-heavy and capital-intensive business. Starting up is harder, and once the business is running, you continually have to invest a large portion of your earnings into accounts receivable, inventories, and hard assets such as equipment and buildings. You are always tight on cash and must borrow money from time to time to support the expansion of the business.
A friend of mine once ran a small retail business. He kept telling his wife that he had made money from the business. His wife was in doubt and asked him where the money was; in turn, he pointed to the piles of unsold goods in his garage and said, “Here it is.”
Such is the situation when you run a capital-intensive business. You don't generate as much cash as your income statement indicates because a large percentage of earnings are reinvested into the business buying and maintaining equipment and increasing inventories. This is required by the business to stay competitive and grow.
It's true that if a business is capital intensive, it is harder for new competitors to come after your market. But it is even better if the business is both light in assets and protected from competition by factors other than capital requirement.
Buffett's own drastically different experiences with the capital-intensive legacy textile business at Berkshire Hathaway and the cash cow See's Candy turned him toward buying asset-light businesses that usually have higher returns on invested capital and employ little debt. He said, “All earnings are not created equal.” If an asset-heavy business wants to double its revenue, whether because of inflation or real growth, it has to double the amount of capital tied to inventories and tangible assets. The business has to generate at least the same amount of market value for the amount it reinvested to make it meaningful, which is not often easy to do.
On the other hand, an asset-light business is required to invest less and is positioned to deliver higher real returns to shareholders. An asset-light business can therefore generate higher return on invested capital (ROIC) and higher returns on shareholders' equity (ROE). Because of the light requirement on capital, the company usually employs little debt, unless the management is too aggressive in borrowing to fund growth and acquisitions.
This can be ascertained from the correlation between the average return on invested capital and the percentage of capital expenditure out of the operating cash flow, as shown in Figure 3.6. The chart shows the relationship between the average 10-year median ROIC and the percentage of capex out of operating cash flow for the 3,577 companies discussed earlier. The trend is clear: When a company needs to spend less money out of its operating cash flow, the average return on invested capital is higher.
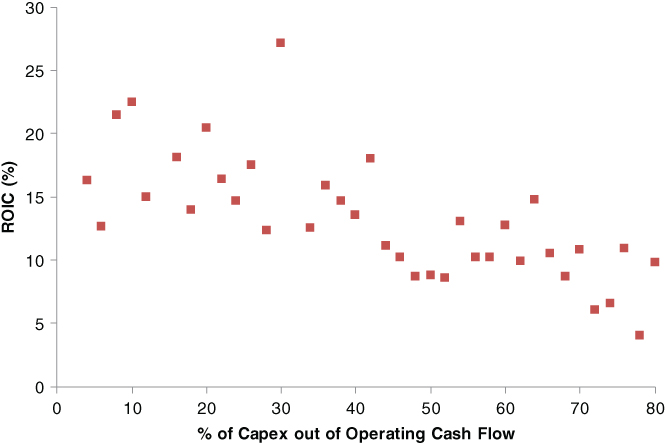
Figure 3.6 ROIC vs. Capex Out of Cashflow
Over the past ten years, very few companies achieved return on invested capital of more than 20 percent, even among companies that are consistently profitable. Figure 3.7 reflects the distribution of the median ROIC over the past ten years for the 1,045 companies that were profitable every single year.
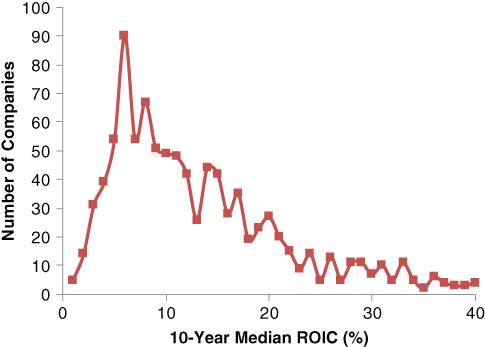
Figure 3.7 ROIC Distribution
The majority of companies have the ten-year median ROIC of less than 15 percent. The peak is at 6 percent. Investors who look for companies that can consistently achieve ROIC of more than 20 percent are searching for diamonds in the rough. Just over 20 percent of the 1,045 companies that were profitable every single year over the past ten years have achieved ROIC over 20 percent.
Not surprisingly, there is a strong correlation between the stock performance and the return on invested capital of companies, even without considering factors such as stock valuation. The relationship of the average gains and the ten-year median ROIC of the 1,045 consistently profitable companies is shown in Figure 3.8.
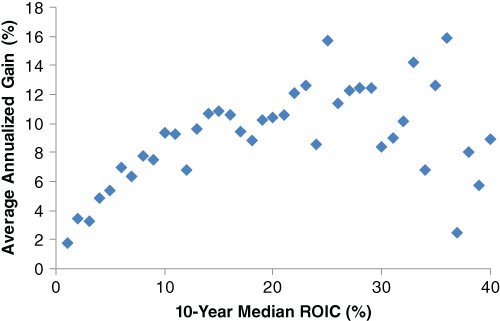
Figure 3.8 Gain vs. ROIC
A similar correlation is found between the performance of stocks and the ten-year median ROE. Figure 3.9 highlights the distribution of the ten-year ROE of the 1,045 companies.
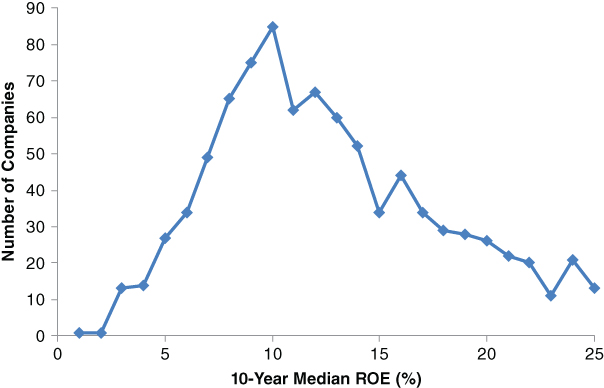
Figure 3.9 ROE Distributions
The ROE distribution reflects the same trend as that for ROIC. Very few companies can achieve long-term average ROE of more than 15 percent. Those that did rewarded their shareholders with far above-average returns, as shown in Figure 3.10.
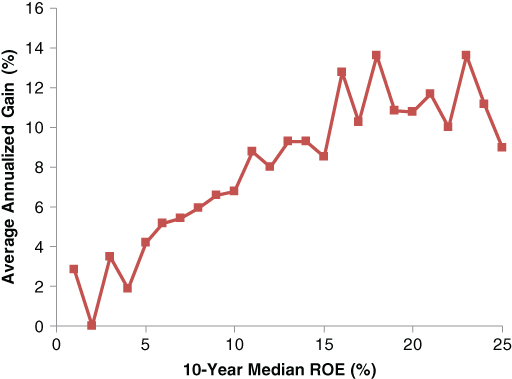
Figure 3.10 Gain vs. ROE
Clearly, if we as investors simply invest in good companies that are consistently profitable and deliver high ROIC and ROE, we would achieve above-average returns. We could achieve this just by buying good companies, and we haven't even mentioned stock valuation.
Back in 2006, the stock market was close to its October 2007 peak for the preceding decade. Today the stock market as a whole is at a similar valuation, as measured by the cycle-adjusted Shiller P/E, and is probably close to another peak. The ten-year period from 2006 to the present is close to a complete market cycle. The outperformance of good companies therefore constitutes convincing evidence that buying good companies will generate above-average returns.
One may argue that this is like looking in the rearview mirror. The fact that the stock of the companies that were consistently profitable and achieved higher returns on invested capital did well in the past ten years does not guarantee that the same kind of stock will continue to perform well. This is true, but if a company is consistently profitable and delivers higher returns, its business value is destined to continuously grow at a faster rate than others. Over a full market cycle, the value will be reflected in its stock price.
Buffett discussed a Fortune study that made similar findings in his 1987 shareholder letter.2 The Fortune study found that only 25 of the 1,000 largest companies achieved an average return on equity of over 20 percent in the ten years from 1977 through 1986, and no year worse than 15 percent. “These business superstars were also stock market superstars: During the decade, 24 of the 25 outperformed the S&P 500.”
If value goes up, sooner or later price follows. Some things never change, like the laws of physics.
3. Is the company continuously growing its revenue and earnings?
Growth is an extremely important matrix for a good business. If a company can steadily grow its revenue and earnings over the long term while maintaining its profit margin, the company is in an advantageous competitive position within its industry. As a company grows, its fixed cost may not grow as fast; the company will even see its profit margin expand over time. Now it can make even more money on the same amount of goods sold. This is usually the case with asset-light and low-capital-requirement businesses.
Figure 3.11 is the ten-year average earnings-per-share (EPS) growth rate distribution of the 1,045 companies that were profitable through all of the past ten years. We can see that the ten-year average EPS growth rate peaks at about 7 percent a year. The majority of the companies grew their earnings at less than 10 percent a year. Among those 1,045 companies, more than 13 percent had negative EPS growth over the past ten years, although they have always been profitable. Only about 15 percent of companies can grow faster than 15 percent a year.
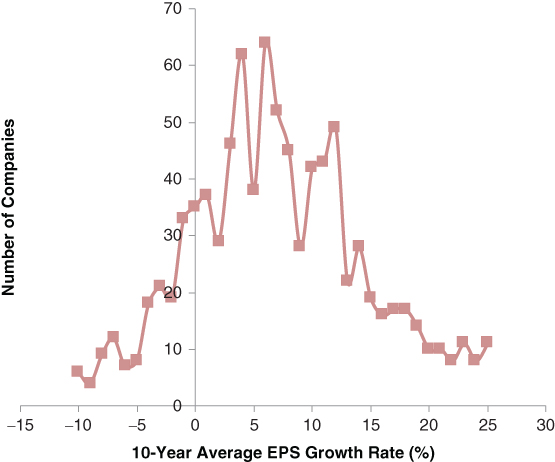
Figure 3.11 Growth Distribution
It is obvious that a faster-growing company can grow its business value faster than a company that is growing slowly. Its stock should do better, too, if everything else is the same. This is exactly the case for the group. Figure 3.12 shows the correlation between the ten-year average gains of the stock and the ten-year average EPS growth rate for the 1,045 consistently profitable companies.
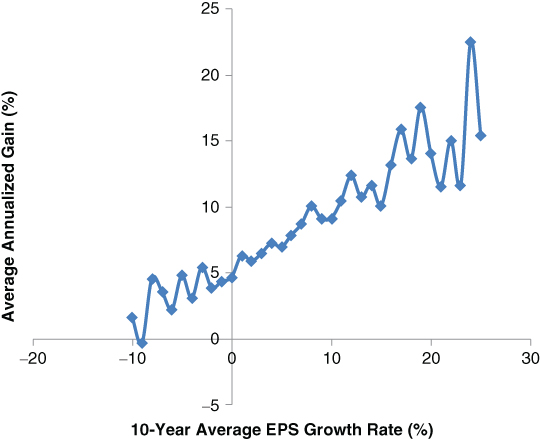
Figure 3.12 Gain vs. Growth
There is a positive correlation between the rate of EPS growth and the stock performance of the companies. Those that were profitable over the past ten years but had declining EPS did the worst. The stock of the companies that grew 20 percent a year outperformed those that grew 5 percent a year by more than 6 percent on average. The advantage in investing in faster-growing companies is significant. As a group, the faster-growing companies represent a better place to look for better-performing stocks.
Here's an interesting observation from the chart: If the stock of two companies had the same price-to-earnings (P/E) ratio ten years ago, but Company A grows at 5 percent per year and Company B grows at 20 percent per year, and their stock still has the same P/E today, Company B's stock would have outperformed by exactly the same outperformance in the growth of the earnings, which is 15 percent per year. But the 15 percent outperformance in earnings was translated to only about half of that in outperformance of stocks, as is evident in the chart in Figure 3.12.The difference is caused by the shrinkage of P/E for faster-growing companies over the ten years. Very few companies can keep growing at a 20 percent rate for decades. P/E shrinkage is usually what a fast-growing company faces when its growth prospect gets bleaker.
In addition to the growth rate, the consistency of the growth itself plays into the performance of the stock. In 2008, GuruFocus conducted a study and found that if a company could grow its earnings more consistently, its stock did better. Based on the consistency of the revenue and earnings growth, GuruFocus assigned each company a predictability ranking. We repeated the study today and found similar results. The results of the two studies are shown in Figure 3.13. Those with more consistent revenue and earnings growth can outperform those with less consistent growth by as much as 5 percent per year over the ten-year period. Therefore, it is more rewarding to buy companies that can grow consistently and at a faster rate.
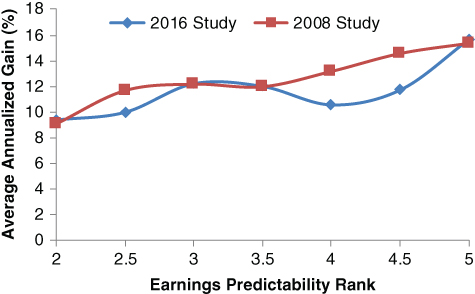
Figure 3.13 Gain vs. Predictability
Now we return to the three fundamental questions. The answers should echo the example I offer ahead for a company to qualify as a good company that we want to buy:
- Question 1. Is the company consistently profitable at decent and stable profit margins, through good times and bad?
Answer: Yes. The company has been profitable every single year of the past ten. Its operating margin has been quite stable at double digits, even during the recession and throughout the last industry slowdown.
- Question 2. Is this an asset-light business that has a high return on investment capital?
Answer: Yes. This is a capital-light business that on average uses only 30 percent of its operating cash flow for capital expenditure. It is also a high-return business with ROIC of more than 20 percent and ROE of more than 15 percent.
- Question 3. Is the company continuously growing its revenue and earnings?
Answer: Yes. The company has been growing its EPS at double digits per year over the past ten years and its growth was consistent, even during recessions and an industry slowdown.
Now we have yes answers to all three questions. We have found a company that has demonstrated great past business performance. Before we invest in the company, however, we still need to answer a fourth, more important question about the nature of the business:
4. What is in the nature of the business that has made the company do well in the past?
Will the business continue to do as well as before? The investment returns for those who buy the stock today are much more related to how the company will do in the future than in the past. Baseball Hall of Famer Yogi Berra once said, “It's tough to make predictions, especially about the future.” But much like when predicting human behavior in psychology, the best predictor of future behavior is past behavior. A company that did well consistently in the past is much more likely to do well in the future than those that didn't previously do well. A company's past success is more likely due to its business nature than other reasons.
We need to answer these questions about the nature of the business: Can the company continue to produce the same or similar products, or provide the same or a similar service in the next five or ten years? Can it grow by simply replicating what it has been doing on a larger scale? What is protecting its pricing power?
We prefer companies that grow just by continuing to do what they have been doing, and on a larger scale. This is Buffett's observation, as he wrote in his 1987 Berkshire Hathaway shareholder letter:
If a company continues to produce the similar product, it has the opportunity to continuously improve efficiency, gain more experience, and get better at doing so than everyone else. It also has the time to build the brand and name recognition, and even cultivate taste habits and addictions. Over time, the company can build an economic moat that is hard for others to invade and maintain its high returns.
It is even better if the product or service seems unexciting and has a short consumer purchase cycle. Again, think of consumer staples such as toothpaste, baking soda, and condoms. Consumers are used to the brand or taste and don't compare when they buy. The purchase habits also give the companies tremendous pricing power. These businesses are boring and unsexy, just as Buffett noted about the 25 Fortune business superstars in 1987:
With a company whose products are quickly changing, it is much easier for a new player to come in and do better. Constant changes create opportunities for newcomers. The new players are usually smaller and led by smart and ambitious people. They can make decisions quickly and are willing to take risks. Think of the smartphone market. Apple never produced phones when BlackBerry was the king of the smartphone market. Tesla didn't exist 13 years ago, but now it has the biggest market share in the electric car market and has the reputation of producing the sexiest car in the world. Buffett wrote:
So far I have only referenced the quality of the business—the essential factor to consider when investing in a company. Without quality, there is no need for further consideration.
The quality of a business is just like love in a marriage. As noted in the story in the beginning of the chapter, without love, many more things need to be right to make things work. These things constitute the areas that I have not touched on and include the roles of management, the financial strength of the company, and the valuation of the stock. It is not that they aren't important. They are, but only secondary to the quality of business. They are usually less of a problem for a quality business. I will now discuss these factors in more detail.
Management
Management can make a difference to the operations of the business. But it is even better if the business is immune to the quality of the management and an idiot can run it. These are the businesses that have the economic moat to protect themselves from mistakes or are relatively inert to management decisions. Think Moody's or McDonald's.
The success of a business is much more dependent on the nature of the business than on who runs it. Those that require the best managers are usually not there for the long term “because sooner or later any idiot probably is going to be running it.”6
An individual investor and minor shareholder rarely has the resources to intimately know the management of a company. The results of operations are mostly decided by the nature of the business rather than management. Buffett likened a poor business to a leaking boat, or a broken car, or a lame horse. It will not do well no matter who rows it, drives it, or rides it. He wrote:
I cannot agree more.
Financial Strength
Robust financial strength is of course essential for a company's long-term survivability. Investors may incur permanent loss of capital with those that have weak financial strength. A consistently profitable company with high returns usually generates a lot more cash flow than it needs to grow and doesn't need to borrow money. Naturally it has great financial strength.
You can see this from Figures 3.14 and 3.15. Each point on these charts represents a company, showing where the company is on the map of interest coverage ratio vs. ten-year median return on invested capital. Figure 3.14 is for the companies that were consistently profitable over the ten years while Figure 3.15 is for the companies that were profitable seven or eight years out of the ten. Clearly, a smaller percentage of the companies on Figure 3.14 has an interest coverage ratio less than 5. Many of the companies on Figure 3.14 have little debt or no debt, and their interest coverage ratio went off the chart and as such they are not displayed. The same isn't true for the companies on Figure 3.15.
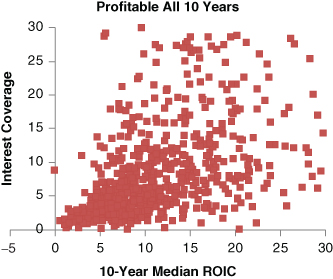
Figure 3.14 Interest Coverage Profitable 10y
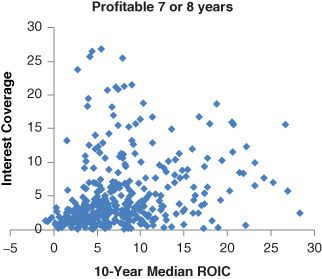
Figure 3.15 Interest Coverage Profitable 7/8y
For both charts, if the ten-year median ROIC is higher than 15 percent, very few companies have an interest coverage of less than 5. A consistently profitable company with high returns automatically has a strong balance sheet and financial strength.
Valuation
Valuation is of course extremely important to the overall investment return of investors. The portion you overpay for the stock directly reduces your return by the same amount. But buying a consistently profitable and high-return company and holding it for the long term is more forgiving to your initial valuation. An initial overpay of 20 percent is translated to 1.8 percent a year in underperformance if the holding time is ten years, and 6.2 percent a year if the holding time is three years.
A consistently profitable and high-return company also deserves a higher valuation than others because it can grow its intrinsic value faster. Assume we have two companies that both had intrinsic values of $100 per share ten years ago. Company A grows its intrinsic value at 10 percent per year while Company B grows at 18 percent per year. Ten years later, Company A has a per-share intrinsic value of $259 while Company B has $523. Assume that the market recognized that Company B was a better company ten years ago and gave it a much higher valuation; we bought Company A at $50 per share, which was a 50 percent discount on its intrinsic value, and bought Company B at $100 per share, which was fully valued. After ten years, Company B lost its favor in the market, and both companies are now sold at a 50 percent discount on their intrinsic values. Investors would achieve about the same return from the two investments, which is 10 percent per year over the past ten years, although they paid twice the price for Company B.
If ten years ago the market gave investors the opportunity to buy Company B at $70 instead of $100, the annualized return with Company B would be 14.1 percent a year. Although investors still paid Company B a 40 percent higher price than with Company A for the same intrinsic value, the investment with Company B rewarded investors with an additional 4.1 percent a year for ten years because Company B is a better business and grew its intrinsic value faster.
It would be ideal if we could buy Company B at a 50 percent discount on its intrinsic value, too. But the stock market usually gives higher valuations to better companies. However, it is still worthwhile to pay up for a good business.
This serves as mathematical proof of the Buffett philosophy that it is far better to buy good companies at fair prices than fair companies at good prices.
Charlie Munger said: “The difference between a good business and a bad business is that good businesses throw up one easy decision after another. The bad businesses throw up painful decisions time after time.”8 Good businesses offer investors the opportunity to make easier decisions and also fewer decisions.
All things considered, buying good businesses that are consistently profitable, generating high returns, and growing is paramount. With good companies, other circumstances will take care of themselves.
So, buy only good companies!