CHAPTER 10
EMPLOYEE SATISFACTION, IDENTITY, AND ENGAGEMENT
People are at the heart of every technology transformation. With market pressures to deliver technology and solutions ever faster, the importance of hiring, retaining, and engaging our workforce is greater than ever. Every good manager knows this, but there is still a lack of information on how to measure these outcomes and on what impacts them, particularly in the context of technology transformations.
We wanted to include in our study the people affected by DevOps adoptions—to see what could improve their work and if these improvements had impacts on the organization. Our research found that employee engagement and satisfaction are indicative of employee loyalty and identity, can help reduce burnout, and can drive key organizational outcomes like profitability, productivity, and market share. We also show you how to measure these key employee factors so you can implement them in your own teams—whether you’re a leader, manager, or an interested practitioner.
In this chapter, we discuss employee loyalty (as measured by employee Net Promoter Score and identity) and job satisfaction, and then close with a discussion of diversity.
EMPLOYEE LOYALTY
To understand employee engagement in the context of technology transformations and DevOps, we looked at it through the lens of a broadly used benchmark of customer loyalty: Net Promoter Score (NPS).
High performers have better employee loyalty, as measured by employee Net Promoter Score (eNPS). Our research found that employees in high-performing organizations were 2.2 times more likely to recommend their organization as a great place to work, and other studies have also shown that this is correlated with better business outcomes (Azzarello et al. 2012).
MEASURING NPS
Net Promoter Score is calculated based on a single question: How likely is it that you would recommend our company/product/service to a friend or colleague?
Net Promoter Score is scored on a 0-10 scale, and is categorized as follows:
In our study, we asked two questions to capture the employee Net Promoter Score:
We compared the proportion of promoters (those who scored 9 or 10) in the high-performing group against those in the low-performing group. We found that employees in high-performing teams were 2.2 times more likely to recommend their organization to a friend as a great place to work, and 1.8 times more likely to recommend their team to a friend.
This is a significant finding, as research has shown that “companies with highly engaged workers grew revenues two and a half times as much as those with low engagement levels. And [publicly traded] stocks of companies with a high-trust work environment outperformed market indexes by a factor of three from 1997 through 2011” (Azzarello et al. 2012).
Employee engagement is not just a feel-good metric—it drives business outcomes. We found that the employee Net Promoter Score was significantly correlated with the following constructs:
As we demonstrated in Chapter 8, when employees see the connection between the work they do and its positive impact on customers, they identify more strongly with the company’s purpose, which leads to better software delivery and organizational performance.
NPS Explained
While this may seem like a simplistic measure, research has shown that NPS correlates to company growth in many industries (Reichheld 2003). Similar to company NPS, employee Net Promoter Score (eNPS) is used to measure employee loyalty.
There’s a link between employees’ loyalty and their work: loyal employees are the most engaged and do their best work, often going the extra mile to deliver better customer experiences—which in turn drives company performance.
NPS is calculated by subtracting the percentage of detractors from the percentage of promoters. For example, if 40% of employees are detractors and only 20% are promoters, the Net Promoter Score is -20%.
CHANGING ORGANIZATIONAL CULTURE AND IDENTITY
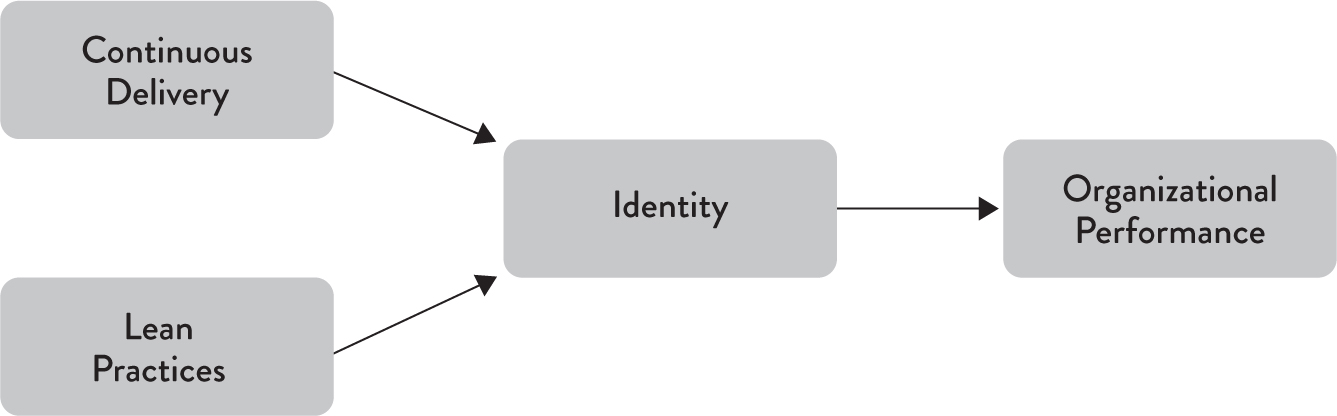
People are an organization’s greatest asset—yet so often they’re treated like expendable resources. When leaders invest in their people and enable them to do their best work, employees identify more strongly with the organization and are willing to go the extra mile to help it be successful. In return, organizations get higher levels of performance and productivity, which lead to better outcomes for the business. These findings are shown in Figure 10.1.
Figure 10.1: Impacts of Technical and Lean Practices on Identity
Effective management practices combined with technical approaches, such as continuous delivery, don’t just impact performance, they also have a measurable effect on organizational culture. As we continued our research, we added a new measure: the extent to which survey respondents identify with the organizations they work for. To measure this, we asked people the extent to which they agreed with the following statements (adapted from Kankanhalli et al. 2005):
We used a Likert-type scale to measure agreement or disagreement with these statements. The items met all statistical conditions for measuring a construct (in this case, identity); therefore, to measure identity in your own teams, you can average the five item scores together into a single score for a person’s identity. (Refer to Chapter 13 for a discussion of psychometrics and latent constructs.)
Our key hypothesis in asking these questions was that teams implementing continuous delivery practices and taking an experimental approach to product development will build better products, and will also feel more connected to the rest of their organization. This, in turn, creates a virtuous cycle: by creating higher levels of software delivery performance, we increase the rate at which teams can validate their ideas, creating higher levels of job satisfaction and organizational performance.
Another key point is that identity includes values alignment with the goals of the team and organization. Recall from the previous chapter that one of the key contributors to burnout is a mismatch of personal and organizational values. What this tells us is that a sense of identity can help reduce burnout by aligning personal and organizational values. Therefore, investments in continuous delivery and Lean management practices, which contribute to a stronger sense of identity, may very well help reduce burnout. Once again, this creates a virtuous circle of value creation in the business where investments in technology and process that make the work better for our people are essential for delivering value for our customers and the business.
This is in contrast to the way many companies still work: requirements are handed down to development teams who must then deliver large stacks of work in batches. In this model, employees feel little control over the products they build and the customer outcomes they create, and little connection to the organizations they work for. This is immensely demotivating for teams and leads to employees feeling emotionally disconnected from their work— and to worse organizational outcomes.
The extent to which people identified with their organization predicted a generative, performance-oriented culture and also predicted organizational performance, as measured in terms of productivity, market share, and profitability. That shouldn’t surprise us. If people are a company’s greatest asset—and many corporate leaders declare they are—then having employees who strongly identify with the company should prove a competitive advantage.
Adrian Cockcroft, Netflix’s seminal cloud architect, was once asked by a senior leader in a Fortune 500 company where he got his amazing people from. Cockcroft replied, “I hired them from you!” (personal communication). Our analysis is clear: in today’s fast-moving and competitive world, the best thing you can do for your products, your company, and your people is institute a culture of experimentation and learning, and invest in the technical and management capabilities that enable it. As Chapter 3 shows, a healthy organizational culture contributes to hiring and retention, and the best, most innovative companies are capitalizing on this.
HOW DOES JOB SATISFACTION IMPACT ORGANIZATIONAL PERFORMANCE?
We mentioned the virtuous circle earlier in reference to software delivery performance, and we see it at work here, too: people who feel supported by their employers, who have the tools and resources to do their work, and who feel their judgment is valued, turn out better work. Better work results in higher software delivery performance, which results in a higher level of organizational performance. We show these findings in Figure 10.2.
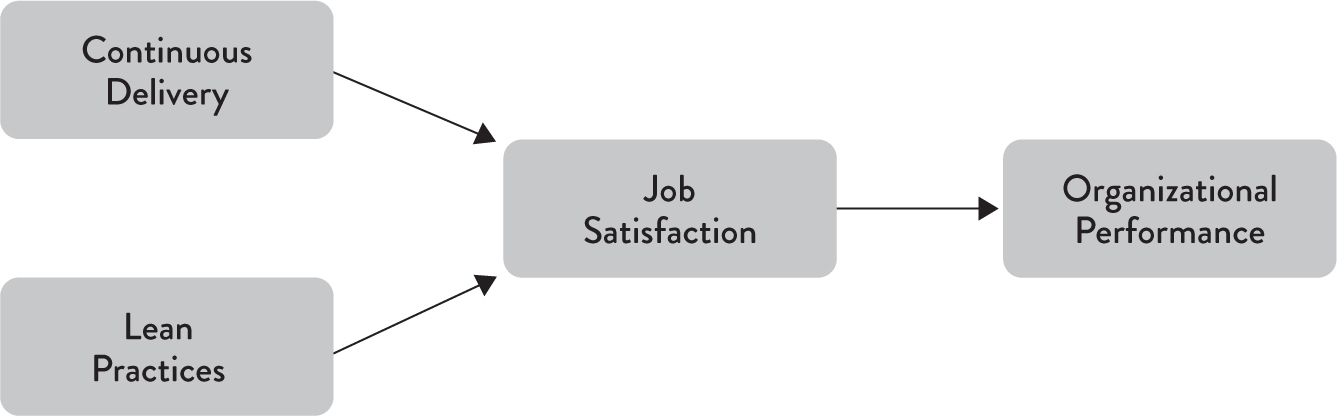
Figure 10.2: Impacts of Technical and Lean Practices on Job Satisfaction
This cycle of continuous improvement and learning is what sets successful companies apart, enabling them to innovate, get ahead of the competition—and win.
HOW DOES DEVOPS CONTRIBUTE TO JOB SATISFACTION?
Although DevOps is first and foremost about culture, it’s important to note that job satisfaction depends strongly on having the right tools and resources to do your work. In fact, our measure of job satisfaction looks at a few key things: if you are satisfied in your work, if you are given the tools and resources to do your work, and if your job makes good use of your skills and abilities. It’s important to call these out, because taken together, this is what makes job satisfaction so impactful.
Tools are an important component of DevOps practices, and many of these tools enable automation. Furthermore, we found that good DevOps technical practices predict job satisfaction. Automation matters because it gives over to computers the things computers are good at—rote tasks that require no thinking and that in fact are done better when you don’t think too much about them. Since humans are so bad at these kinds of tasks, turning them over to computers allows people to focus on the things they’re good at: weighing the evidence, thinking through problems, and making decisions. Being able to apply one’s judgment and experience to challenging problems is a big part of what makes people satisfied with their work.
Looking at the measures that correlate strongly with job satisfaction, we see some commonalities. Practices like proactive monitoring and test and deployment automation all automate menial tasks and require people to make decisions based on a feedback loop. Instead of managing tasks, people get to make decisions, employing their skills, experience, and judgment.
DIVERSITY IN TECH-WHAT OUR RESEARCH FOUND
Diversity matters. Research shows that teams with more diversity with regard to gender or underrepresented minorities are smarter (Rock and Grant 2016), achieve better team performance (Deloitte 2013), and achieve better business outcomes (Hunt et al. 2015). Our research shows that few teams are diverse in this regard. We recommend that teams wanting to achieve high performance do their best to recruit and retain more women and underrepresented minorities, and work to improve diversity in other areas too, such as people with disabilities.
It is also important to note that diversity is not enough. Teams and organizations must also be inclusive. An inclusive organization is one where “all organizational members feel welcome and valued for who they are and what they ’bring to the table.’ All stakeholders share a high sense of belonging and fulfilled mutual purpose” (Smith and Lindsay 2014, p. 1). Inclusion must be present in order for diversity to take hold.
WOMEN IN DEVOPS
We started asking questions about gender in 2015, which sparked some lively discussion in social media on the topic of women in tech. We heard everything from wholehearted support from many women and men in the DevOps community to questions about why gender diversity in tech matters. Of the total respondents, 5% self-identified as female in 2015, 6% in 2016, and 6.5% in 2017. These numbers were much lower than we expected, given that women made up about 7% in 2011 (SAGE 2012), down from 13% in 2008 (SAGE 2008) in systems administration and 27% in computer and information management (Diaz and King 2013). We were hoping to find more reassuring numbers of women working on technical teams.
Among survey respondents:
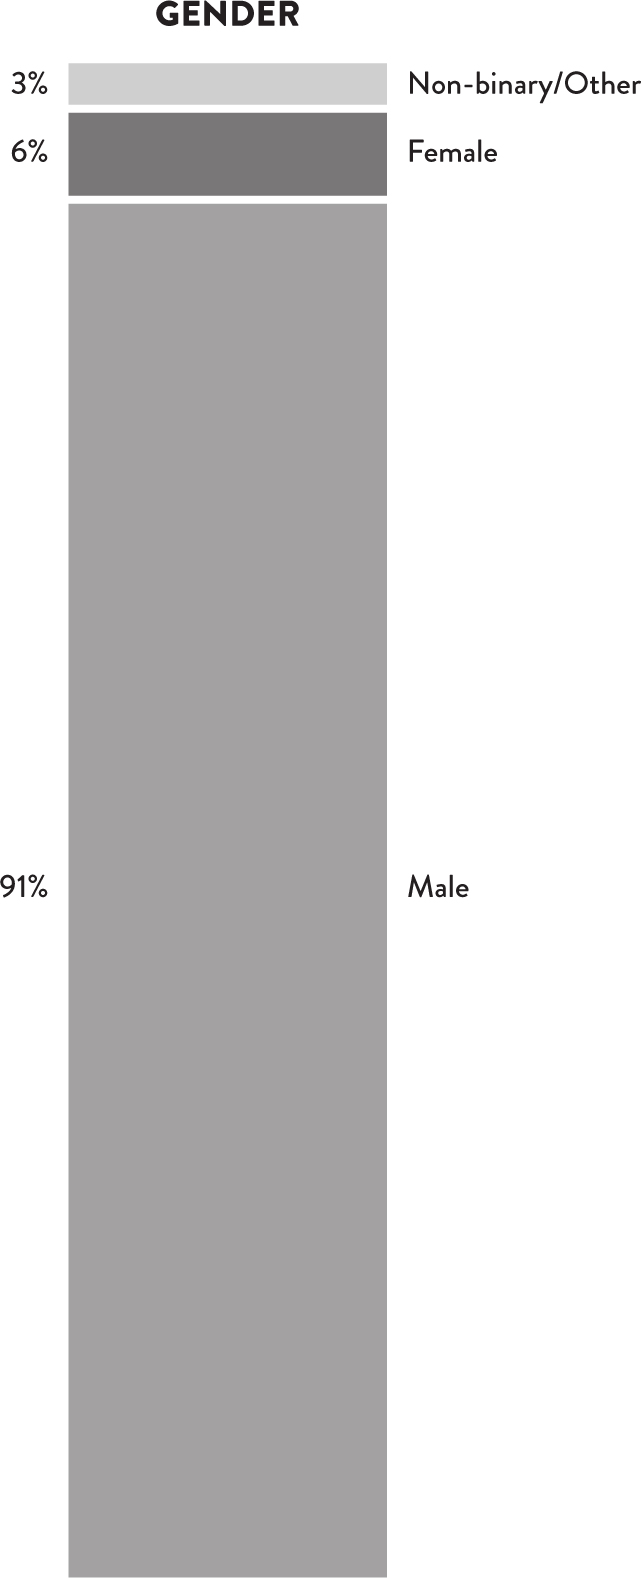
Figure 10.3: Gender Demographics in 2017 Study
We started our research around binary gender because that allowed us to compare our results with existing research. We hope to extend our work into non-binary gender in the future. We can report basic statistics about reported gender for the 2017 study (see also Figure 10.3):
UNDERREPRESENTED MINORITIES IN DEVOPS
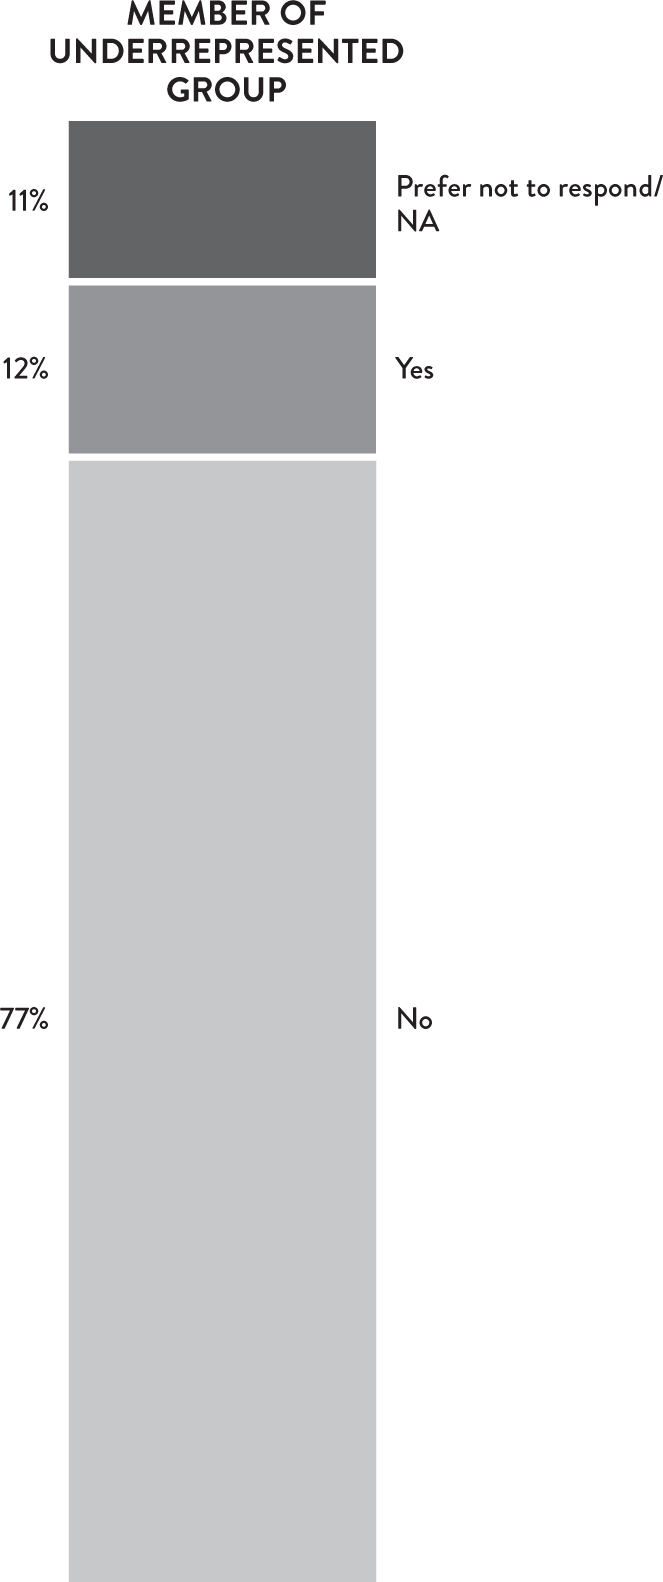
Figure 10.4: Underrepresented Minority Demographics in 2017 Study
We also asked if respondents identified as an underrepresented minority (see also Figure 10.4).
Because the data was collected around the world, this selfidentification was as specific as we could get. For example, the United States identifies and defines several ethnicities and nationalities as minority groups (e.g., African American, Hispanic, Pacific Islander, etc.) that do not exist or would not make sense as identifiers in other countries around the world.
We have not extended our research into people with disabilities yet, but hope to in the future.
WHAT OTHER RESEARCH TELLS US ABOUT DIVERSITY
Most research in diversity looks at binary gender, so let’s start there. What does the current research tell us? There’s plenty of research linking the presence of women in leadership positions to higher financial performance (McGregor 2014), stock market performance (Covert July 2014), and hedge fund returns (Covert January 2014). Furthermore, a study conducted by Anita Woolley and Thomas W. Malone measured group intelligence and found that teams with more women tended to fall above average on the collective intelligence scale (Woolley and Malone 2011). Despite all of these clear advantages, organizations are failing to recruit and retain women in technical fields.
Since there are no significant differences between men and women in terms of ability or aptitude in STEM (science, technology, engineering, and mathematics) fields (Leslie et al. 2015), what’s keeping women and other underrepresented groups out of tech?1 The answer could be nothing more than the pervasive belief that some men are naturally more suited to technical work because they possess innate brilliance (Leslie et al. 2015).
It is that pervasive belief that seeps into our culture, creating an environment in which it is increasingly difficult for women to stay (Snyder 2014). Women are leaving tech at a 45% higher rate than men (Quora 2017), and the outlook for minorities is likely similar. Women and underrepresented minorities report harassment, microaggressions, and unequal pay (e.g., Mundy 2017). These are all things we can actively watch for and improve as leaders and peers.
WHAT WE CAN DO
It’s up to all of us to prioritize diversity and promote inclusive environments. It’s good for your team and it’s good for the business. Here are some resources to help you get started:
1 Note that Leslie et al.’s study only investigated women and African Americans, but the findings are likely generalizable to other underrepresented minorities.