
No man who is correctly informed as to the past will be disposed to take a morose or desponding view of the present.
—Thomas B. Macaulay, History of England
THIS IS THE chapter where you learn how to become a financial bookie. Reading it will still leave you unable to predict the course of the market over the next month or the next year—no one can do that—but you will be able to better the odds of constructing a winning portfolio. Although the price levels of stocks and bonds, the two most important determinants of net worth, will undoubtedly fluctuate beyond your control, my general methodology will serve you well in realistically projecting long-run returns and adapting your investment program to your financial needs.
WHAT DETERMINES THE RETURNS FROM STOCKS AND BONDS?
Very long-run returns from common stocks are driven by two critical factors: the dividend yield at the time of purchase, and the future growth rate of earnings and dividends. In principle, for the buyer who holds his or her stocks forever, a share of common stock is worth the “present” or “discounted” value of its stream of future dividends. Recall that this “discounting” reflects the fact that a dollar received tomorrow is worth less than a dollar in hand today. A stock buyer purchases an ownership interest in a business and hopes to receive a growing stream of dividends. Even if a company pays very small dividends today and retains most (or even all) of its earnings to reinvest in the business, the investor implicitly assumes that such reinvestment will lead to a more rapidly growing stream of dividends in the future or alternatively to greater earnings that can be used by the company to buy back its stock.
The discounted value of this stream of dividends (or funds returned to shareholders through stock buybacks) can be shown to produce a very simple formula for the long-run total return for either an individual stock or the market as a whole:
Long-run equity return = Initial dividend yield + growth rate.
From 1926 until 2022, for example, common stocks provided an average annual rate of return of about 10 percent. The dividend yield for the market as a whole on January 1, 1926, was about 5 percent. The long-run rate of growth of earnings and dividends was also about 5 percent. Thus, adding the initial dividend yield to the growth rate gives a close approximation of the actual rate of return.
Over shorter periods, such as a year or even several years, a third factor is critical in determining returns. This factor is the change in valuation relationships—specifically, the change in the price-dividend or price-earnings multiple. (Increases or decreases in the price-dividend multiple tend to move in the same direction as the more popularly used price-earnings multiple.)
Price-dividend and price-earnings multiples vary widely from year to year. For example, in times of great optimism, such as early March 2000, stocks sold at price-earnings multiples well above 30. The price-dividend multiple was over 80. At times of great pessimism, such as 1982, stocks sold at only 8 times earnings and 17 times dividends. These multiples are also influenced by interest rates. When interest rates are low, stocks, which compete with bonds for an investor’s savings, tend to sell at low dividend yields and high price-earnings multiples. When interest rates are high, stock yields rise to be more competitive and stocks tend to sell at low price-earnings multiples. Common-stock returns were well below average from 1968 to 1982, when returns were only about 5½ percent per year. Stocks sold at a dividend yield of 3 percent at the start of the period, and earnings and dividend growth was 6 percent per year, a bit above the long-run average. Had price-earnings multiples (and dividend yields) remained constant, stocks would have produced a 9 percent annual return, with the 6 percent dividend growth translated into 6 percent capital appreciation per year. But a large increase in dividend yields (a large fall in price-earnings multiples) reduced the average annual return by about 3½ percentage points per year.
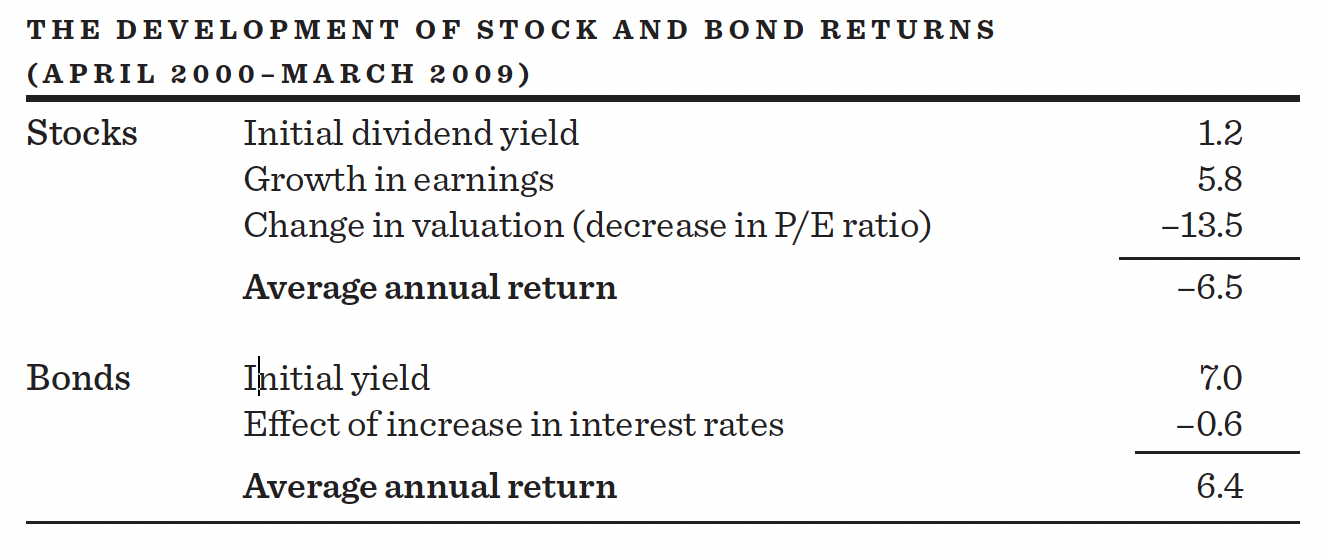
A perfectly dreadful period for stock-market investors was the first decade of the 2000s. The Age of Millennium turned out to be the Age of Disenchantment. At the start of April 2000, at the height of the Internet bubble, the dividend yield for the S&P 500 had fallen to 1.2 percent. (Price-earnings multiples were above 30.) Dividend growth was actually very strong during the period, averaging 5.8 percent per year. Had there been no change in valuation relationships, stocks would have produced a rate of return of 7 percent (1.2 percent dividend yield plus 5.8 percent growth). But price-earnings multiples plummeted and dividend yields rose over the decade. The change in valuation relationships lopped 13½ percentage points from the return. Hence, stocks did not return 7 percent—they lost an average of 6½ percent per year, leading many analysts to refer to these years as “the lost decade.”
Many analysts question whether dividends are as relevant now as they were in the past. They argue that firms increasingly prefer distributing their growing earnings to stockholders through stock repurchases rather than dividend increases. Two reasons are offered for such behavior—one serves shareholders and the other management. The shareholder benefit was created by tax laws. The tax rate on realized long-term capital gains has often been only a fraction of the maximum income tax rate on dividends. Firms that buy back stock tend to reduce the number of shares outstanding and therefore increase earnings per share and, thus, share prices. Hence, stock buybacks tend to create capital gains. Even when dividends and capital gains are taxed at the same rate, capital-gains taxes can be deferred until the stocks are sold, or even avoided completely if the shares are later bequeathed. Thus, managers acting in the interest of the shareholder will prefer to engage in buybacks rather than increasing dividends.
The flip side of stock repurchases is more self-serving. A significant part of management compensation is derived from stock options, which become valuable only if earnings and the price of the stock rise. Stock repurchases are an easy way to bring this about. Larger appreciation benefits the managers by enhancing the value of their stock options, whereas larger dividends go into the pockets of current shareholders. From the 1940s until the 1970s, earnings and dividends grew at about the same rate. During the last decades of the twentieth century, however, earnings grew faster than dividends. Over the very long run, earnings and dividends are likely to grow at roughly similar rates, and, for ease of reading, I have elected to do the analysis below in terms of earnings growth.
Long-run returns from bonds are easier to calculate than those from stocks. Over the long run, the yield that a bond investor receives is approximated by the yield to maturity of the bond at the time it is purchased. For a zero-coupon bond (a bond that makes no periodic interest payments, but simply returns a fixed amount at maturity), the yield at which it is purchased is precisely the yield that an investor will receive, assuming no default and assuming it is held to maturity. For a coupon-paying bond (a bond that does make periodic interest payments), there could be a slight variation in the yield that is earned over the term of the bond, depending on whether and at what interest rates the coupon interest is reinvested. Nevertheless, the initial yield on the bond provides a quite serviceable estimate of the yield that will be obtained by an investor who holds the bond until maturity.
Estimating bond returns becomes murky when bonds are not held until maturity. Changes in interest rates (bond yields) then become a major factor in determining the net return received over the period during which the bond is held. When interest rates rise, bond prices fall so as to make existing bonds competitive with those that are currently being issued at the higher interest rates. When rates fall, bond prices increase. The principle to keep in mind is that bond investors who don’t hold to maturity will suffer to the extent that interest rates rise and gain to the extent that rates fall.
Inflation is the dark horse in any handicapping of financial returns. In the bond market, an increase in the inflation rate is unambiguously bad. To see this, suppose that there was no inflation and bonds sold on a 5 percent yield basis, providing investors with a real (that is, after inflation) return of 5 percent. Now assume that the inflation rate increases from zero to 5 percent per year. If investors still require a 5 percent real rate of return, then the bond interest rate must rise to 10 percent. Only then will investors receive an after-inflation return of 5 percent. But this will mean that bond prices fall, and those who previously purchased 5 percent long-term bonds will suffer a substantial capital loss. Except for the holder of the inflation-protected bonds recommended in chapter 12, inflation is the deadly enemy of the bond investor.
In principle, common stocks should be an inflation hedge, and stocks are not supposed to suffer with an increase in the inflation rate. In theory at least, if the inflation rate rises by 1 percentage point, all prices should rise by 1 percentage point, including the values of factories, equipment, and inventories. Consequently, the growth rate of earnings and dividends should rise with the rate of inflation. Thus, even though all required returns will rise with the rate of inflation, no change in dividend yields (or price-earnings ratios) will be required. This is so because expected growth rates should rise along with increases in the expected inflation rate. Whether this happens in practice we will examine below.
FOUR HISTORICAL ERAS OF FINANCIAL MARKET RETURNS
Before we attempt to project future stock and bond returns, let’s examine four periods of stock- and bond-market history and see whether we can make sense of how investors fared in terms of the determinants of returns discussed above. The four eras coincide with the four broad swings in stock-market returns from 1947 to 2009. The table below indicates the four eras and the average annual returns earned by stock and bond investors. The long bull market of the 2010s going into the 2020s will be analyzed in a following section.
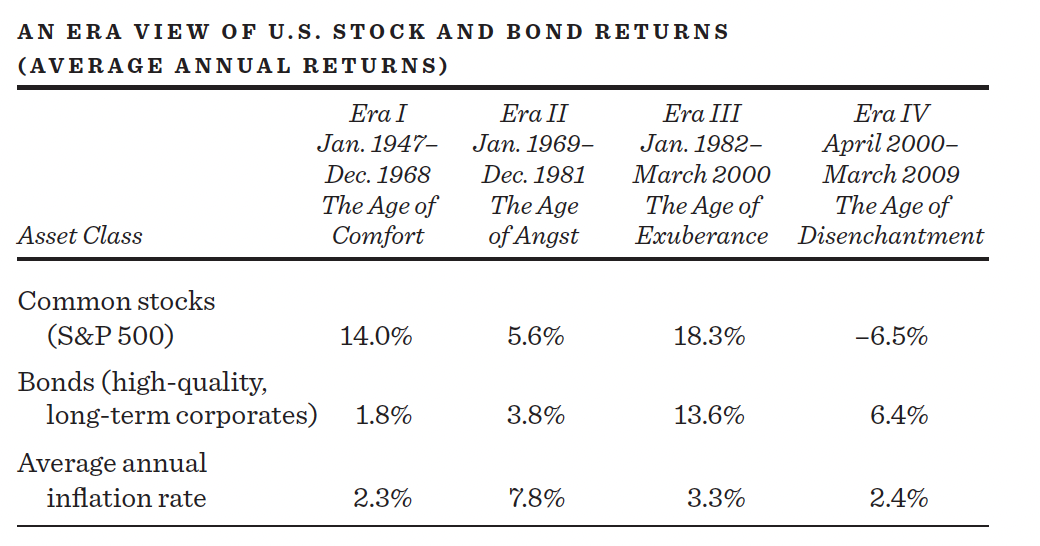
Era I, the Age of Comfort, as I call it, covers the years of growth after World War II. Stockholders made out extremely well after inflation, whereas the meager returns earned by bondholders were substantially below the average inflation rate. I call Era II the Age of Angst. Widespread rebellion by the millions of teenagers born during the baby boom, economic and political instability created by the Vietnam War, and various inflationary oil and food shocks combined to create an inhospitable climate for investors. No one was exempt; neither stocks nor bonds fared well. During our third era, the Age of Exuberance, the boomers matured, peace reigned, and a noninflationary prosperity set in. It was a golden age for stockholders and bondholders. Never before had they earned such generous returns. Era IV was the Age of Disenchantment, in which the great promise of the new millennium was not reflected in common-stock returns. But it did create the conditions for the spectacular rise in stock returns into the 2020s.
With these broad time periods set, let us now look at how the determinants of returns developed during those eras and look especially at what might have been responsible for changes in valuation relationships and in interest rates. Recall that stock returns are determined by (1) the initial dividend yield at which the stocks were purchased, (2) the growth rate of earnings, and (3) changes in valuation in terms of price-earnings (or price-dividend) ratios. And bond returns are determined by (1) the initial yield to maturity at which the bonds were purchased and (2) changes in interest rates (yields) and therefore in bond prices for bond investors who do not hold to maturity.
Consumers celebrated the end of World War II with a spending spree. They had gone without cars, refrigerators, and countless other goods during the war, and they forked over their liquid savings with abandon, creating a mini-boom with some inflation. It was hard, however, to forget the Great Depression of the 1930s. Economists (those dismal scientists) were worried as demand began to slacken and became convinced that a deep recession, or perhaps a depression, was just around the corner. President Harry Truman was responsible for a widely used definition of the difference between the two: “A recession is when you’re out of work. A depression is when I’m out of work.” Investors in the stock market noted the economists’ gloom and were clearly worried. Dividend yields at the start of 1947 were unusually high at 5 percent, and P/E multiples, which hovered around 12, were well below their long-term average.
It turned out that the economy did not sink into the depression many had feared. Although there were periods of mild recession, the economy grew at a quite reasonable rate through the 1950s and 1960s. President Kennedy had proposed a large tax cut in the early 1960s, which was enacted in 1964, after his death. With the stimulus from the tax cut and the increase in government spending for the Vietnam War, the economy was robust, with high employment levels. Inflation was generally not a problem until the very end of the period. Investors became progressively more confident; by 1968, P/Es were above 18, and the yield on the S&P 500-Stock Index had fallen to 3 percent. This created truly comfortable conditions for common-stock investors: their initial dividends were high; both earnings and dividends grew at reasonably robust rates of 6½ to 7 percent; and valuations became richer, further augmenting capital gains. The following table shows the different components of the returns from stocks and bonds over the 1947–68 period.
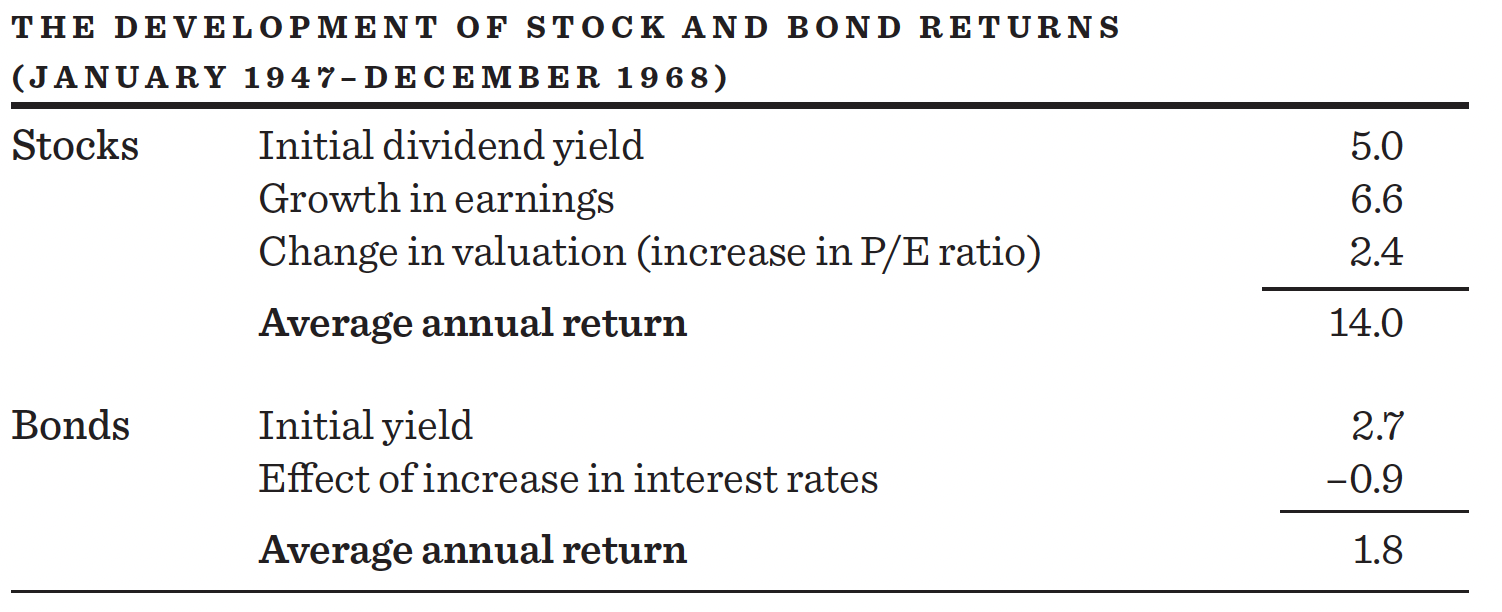
Unfortunately, bond investors did not fare nearly as well. For starters, initial bond yields were low in 1947. Thus, bond returns were destined to be low even for investors who held to maturity. During World War II, the United States pegged long-term government-bond interest rates at no more than 2½ percent. The policy was implemented to permit the government to finance the war cheaply with low-interest borrowing, and it continued after the war until 1951, when rates were allowed to rise moderately. Therefore, bond investors suffered a double whammy during the period. Not only were interest rates artificially low at the start of the period, but bondholders suffered capital losses when interest rates were allowed to rise. As a result, bondholders received nominal rates of return below 2 percent over the period and real returns (after inflation) that were negative.
From the late 1960s through the early 1980s, accelerating inflation made an unexpected appearance and became the major influence on securities markets. In the mid-1960s, inflation was essentially unnoticeable—running at a rate of just over 1 percent. When our involvement in Vietnam increased in the late 1960s, however, we had classic, old-fashioned “demand-pull” inflation—too much money chasing too few goods—and the rate of inflation spurted forward to about 4 or 4½ percent.
Then the economy was beset by the oil and food shocks of 1973–74. It was a classic case of Murphy’s Law at work—whatever could go wrong did. The Organization of Petroleum Exporting Countries (OPEC) contrived to produce an artificial shortage of oil, and Mother Nature produced a real shortage of foodstuffs through poor grain harvests in North America and disastrous ones in the Soviet Union and sub-Saharan Africa. When even the Peruvian anchovy crop mysteriously disappeared (anchovies are a major source of protein), it appears that O’Toole’s commentary had come into play. (Remember, it was O’Toole who suggested that “Murphy was an optimist.”) Again, the inflation rate rose to 6½ percent. Then, in 1978 and 1979, a combination of policy mistakes—leading to considerable excess demand in certain sectors—and another 125 percent increase in the price of oil kicked the inflation rate up again, taking with it wage costs. By the early 1980s, the inflation rate went above 10 percent and there was considerable fear that the economy was out of control.
Finally, the Federal Reserve, under the leadership of its chairman at the time, Paul Volcker, took decisive action. The Fed initiated an extremely tight monetary policy designed to rein in the economy and kill the inflationary virus. Inflation did begin to subside in time, but the economy almost died as well. We suffered the sharpest economic decline since the 1930s, and unemployment soared. By the end of 1981, the U.S. economy suffered not only from double-digit inflation but from double-digit unemployment as well.
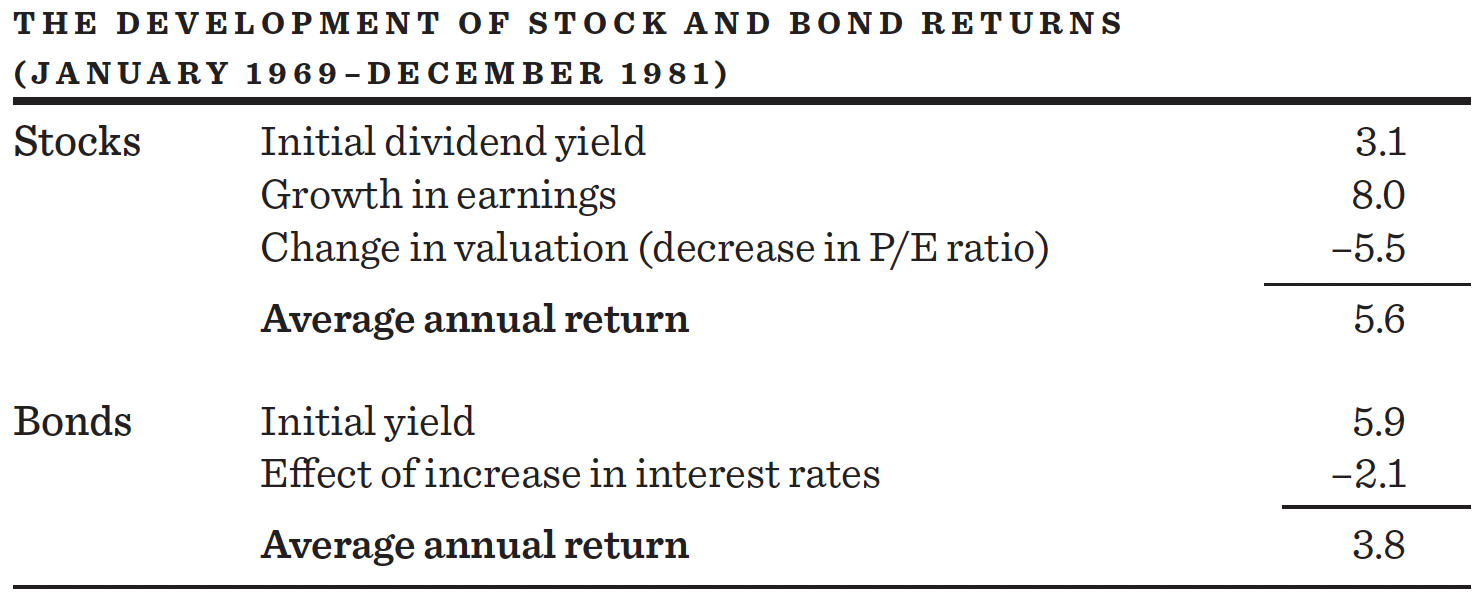
The table below shows the fallout in financial markets from the inflation and instability in the economy. Although nominal returns for both stockholders and bondholders were meager, the real returns, after factoring out the 7.8 percent inflation rate, were actually negative. On the other hand, hard assets such as gold, collectibles, and real estate provided generous double-digit returns.
Because the inflation was unanticipated and allowance for it was not incorporated into yields, investors in bonds suffered disastrous results. In 1968, for example, thirty-year, long-term bonds offered a yield to maturity of about 6 percent. This provided protection against the going inflation rate of about 3 percent and an anticipated after-inflation real rate of return of 3 percent. Unfortunately, the actual rate of inflation over the period 1969–81 was almost 8 percent, wiping out any positive real rate of return. That’s the good news part of this dreary story. The bad news was that there were capital losses. Who wanted to buy a bond yielding 6 percent in the late 1970s, when the rate of inflation was in double digits? No one! If you had to sell your bonds, you sold at a loss so that the new buyer could get a yield consonant with the higher rate of inflation. Yields rose even further as the risk premium on bonds rose to take into account their increased volatility. To make matters worse, the tax system delivered the unkindest blow of all to bond investors. Even though bond investors often actually earned negative pre-tax rates of return, their bond coupons were taxed at regular income tax rates.
The failure of bonds to protect investors against an unanticipated inflationary episode is hardly surprising. The common-stock flop was something else. Because stocks represent claims on real assets that presumably rise in value with the price level, stock prices—according to this line of logic—should have risen also. It’s like the story of the small boy on his first trip to an art museum. When told that a famous abstract painting was supposed to be a horse, the boy asked wisely, “Well, if it is supposed to be a horse, why isn’t it a horse?” If common stocks were supposed to be an inflation hedge, then why weren’t they?
Many different explanations involving faltering dividends and earnings growth have been offered that simply don’t hold up under careful analysis. One common explanation was that inflation had caused corporate profits to shrink drastically, especially when reported figures were adjusted for inflation. Inflation was portrayed as a kind of financial neutron bomb, leaving the structure of corporate enterprise intact, but destroying the lifeblood of profits. Many saw the engine of capitalism as running out of control, so that a walk down Wall Street—random or otherwise—could prove extremely hazardous.
The facts are, however, that there was no evidence that profits had been “sliding down a pole greased by cruel and inexorable inflation,” as some in the financial community believed in the early 1980s. As the preceding table shows, profit growth accelerated over the 1969–81 period and increased to an 8 percent rate, comfortably ahead of inflation. Even dividends held their own, rising at close to the same rate as inflation.
Movie buffs should recall the marvelous final scene from Casablanca. Humphrey Bogart stands over the body of a Luftwaffe major, a smoking gun in his hand. Claude Rains, a captain in the French colonial police, turns his glance from Bogart to the smoking gun to the dead major and finally to his assistant, and says, “Major Strasser has been shot. Round up the usual suspects.” We, too, have rounded up the usual suspects, but we have yet to focus on who shot the stock market.
The major reason for the poor equity returns during the 1970s was that investors’ evaluations of dividends and earnings—the number of dollars they were willing to pay for a dollar of dividends and earnings—fell sharply. Stocks failed to provide investors with protection against inflation, not because earnings and dividends failed to grow with inflation, but rather because price-earnings multiples quite literally collapsed over the period.
The price-earnings multiple for the S&P Index was cut by almost two-thirds during the 1969–81 period. It was this decline in multiples that produced such poor returns for investors in the 1970s and that prevented stock prices from reflecting the real underlying progress most companies made in earnings and dividend growth. Some financial economists concluded that the market was simply irrational during the 1970s and early 1980s—that multiples had fallen too far.
It is, of course, quite possible that stock investors became irrationally pessimistic in the early 1980s, just as they were possibly irrationally optimistic in the mid-1960s. But although I do not believe the market is always perfectly rational, if forced to choose between the stock market and the economics profession, I’d put my money on the stock market every time. I suspect that stock investors weren’t irrational when they caused a sharp drop in price-dividend and price-earnings multiples—they were just scared. In the mid-1960s, inflation was so modest as to be almost unnoticeable, and investors were convinced that economists had found the cure for serious recessions—even mild downturns could be “fine-tuned” away. No one would have imagined in the 1960s that the economy could experience either double-digit unemployment or double-digit inflation, let alone that both could appear simultaneously. Clearly, we learned that economic conditions were far less stable than had previously been imagined. Equity securities (dare I say equity insecurities) were, therefore, considered riskier and deserving of higher risk compensation.*
The market provides higher risk premiums through a drop in prices relative to earnings and dividends; this produces larger returns in the future consistent with the new, riskier environment. Paradoxically, however, the same adjustments that produced very poor returns in the late 1960s and throughout the 1970s created some very attractive price levels in the early 1980s, as I argued in earlier editions of this book. The experience makes clear, however, that if one wants to explain the generation of returns over a decade, a change in valuation relationships plays a critical role. The growth rate of earnings did compensate for inflation during 1969–81, but the drop in price-dividend and price-earnings multiples, which I believe reflected increased perceived risk, is what killed the stock market.
Era III: The Age of Exuberance
Let us now turn to the third era—a golden age of financial asset returns, from 1982 through early 2000. At the start of the period, both bonds and stocks had fully adjusted—perhaps even overadjusted—to the changed economic environment. Stocks and bonds were priced not only to provide adequate protection against the likely rate of inflation but also to give unusually generous real rates of return.
Indeed, in late 1981, the bond market was in disgrace. The Bawl Street Journal, in its 1981 annual comedy issue, wrote, “A bond is a fixed-rate instrument designed to fall in price.” At the time, the yield on high-quality corporate bonds was around 13 percent. The underlying rate of inflation (as measured by the growth of unit labor costs) was then about 8 percent. Thus, corporate bonds provided a prospective real rate of return of about 5 percent, a rate unusually generous by past historical standards. (The long-term real rate of return on corporate bonds has been only 2 percent.) To be sure, bond prices had become volatile, and it was therefore reasonable to suppose that bonds ought to offer a somewhat larger risk premium than before. But panic-depressive institutional investors probably overdiscounted the risks of bond investments. Like generals fighting the last war, investors had been loath to touch bonds because experience over the past fifteen years had been so disastrous. Thus, the initial conditions were such that bond investors could expect very generous returns in the years ahead.
What about stocks? As I mentioned above, it is possible to calculate the anticipated long-run rate of return on stocks by adding the dividend yield of the stock averages to the anticipated growth of earnings per share. The calculations I performed in 1981 suggested a total expected rate of return from common stocks of more than 13 percent—a rate well above the core rate of inflation and very generous by historical standards.
Common stocks were also selling at unusually low multiples of cyclically depressed earnings, at below-average price-dividend multiples, and at prices that were only a fraction of the replacement value of the assets they represented. Small wonder that we saw so many corporate takeovers during the 1980s. Whenever assets can be bought in the stock market at less than the cost of acquiring them directly, there will be a tendency for firms to purchase the equities of other firms, as well as to buy back their own stocks. Thus, I argued that in the early 1980s we were presented with a market situation where paper assets had adjusted and perhaps overadjusted to inflation and the greater uncertainty associated with it. The following table shows how returns developed during the 1982–2000 period.
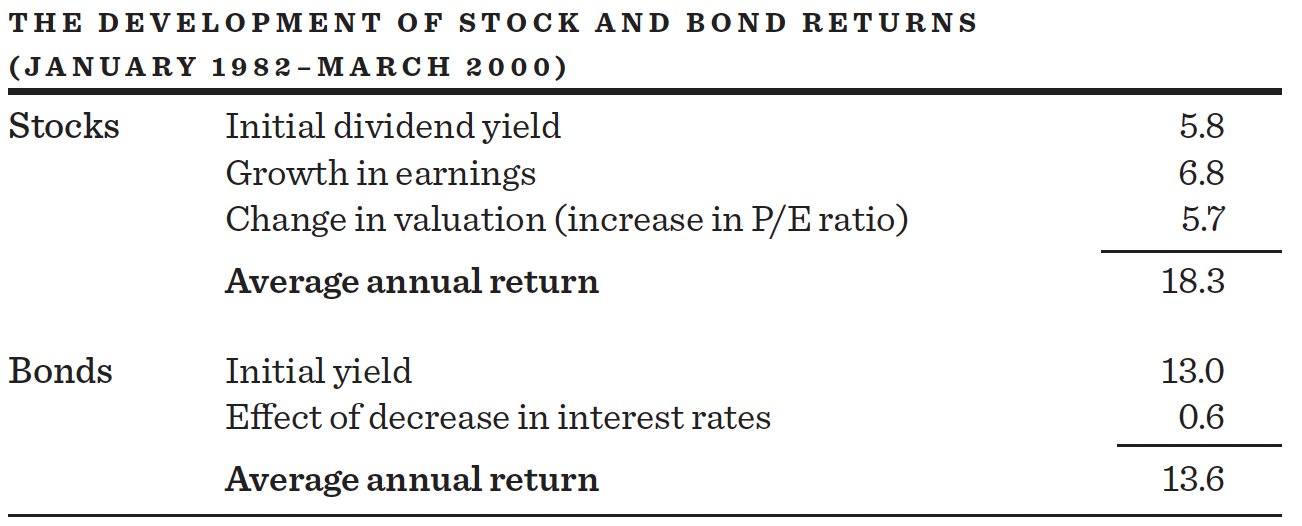
This was truly an age of investor exuberance, with both stocks and bonds producing unusually generous rates of return. Although the nominal growth in earnings and dividends was not any greater during this period than in the unsatisfactory period of the 1970s, two factors contributed to produce spectacular stock-market returns. First, initial dividend yields of nearly 6 percent were unusually generous. Second, market sentiment went from despair to euphoria. Price-earnings multiples in the market almost quadrupled, from 8 to 30, and dividend yields fell to just over 1 percent. It was the change in valuation that lifted stock returns from unusually good to absolutely extraordinary.
Similarly, the initial yield of 13 percent in the bond market guaranteed that long-term holders would achieve double-digit returns. As I have said, what yield long-term holders see is what they get. In addition, interest rates fell, augmenting the returns further. Moreover, because the inflation rate moderated to the 3 percent level, real returns (returns after inflation) were well above their long-term average. The 1982–early 2000 period offered a once-in-a-lifetime opportunity to be invested in financial assets. Meanwhile, hard assets such as gold and oil produced negative rates of return.
Era IV: The Age of Disenchantment
The Age of Exuberance was followed by one of the worst decades for the stock market ever recorded. The period was widely considered to be “the lost decade” or “the naughties.” It was a decade most stock-market investors would prefer to forget. The Internet bubble was followed by a crushing bear market. Later in the decade another bubble and crash rocked world stock markets as tumbling real estate prices destroyed the value of the complex mortgage-backed securities that were dependent on rising home prices. Investors were again reminded that the world was a very risky place. Valuation relationships changed accordingly.
Price-earning ratios fell and dividend yields rose. The investor who diversified her portfolio with bonds was able to mitigate the suffering, however, as bonds produced positive returns over the decade. The following table shows how returns developed during the Age of Disenchantment.
By the trough in the market in 2009, the P/E multiple for the S&P 500 had fallen to less than 15 times cyclically depressed earnings. The dividend yield had increased to almost 3 percent. These changes in valuation relationships created the conditions for positive stock-market returns over the next decade. As earnings grew at double-digit rates, prices rose even more, aided by falling dividend yields and rising P/E multiples. Through January of 2022, equities produced an average annual return of almost 17½ percent despite a hiccup in early 2020 as COVID disrupted economic activity. The average rate of inflation over the same period was 2.3 percent. Thus, stocks produced a real rate of return as large as they did during Era III, the era I called the age of exuberance. Bonds also did reasonably well. U.S. Treasury yields ranged between 3 and 4 percent in 2009. In January 2022, the ten-year U.S. Treasury bond yielded less than 2 percent. Thus, bonds offered some capital appreciation as their yields fell and they produced an annual rate of return of about 4 percent, about 2 percent after inflation.
So what’s ahead? How can you judge returns from financial assets for the years ahead? Although I remain convinced that no one can predict short-term movements in securities markets, I do believe that it is possible to estimate the likely range of long-run rates of return that investors can expect from financial assets. And it would be unrealistic to anticipate that the generous returns earned by stock market investors during the 2009–2022 period can be expected during the years ahead.
What, then, are the reasonable long-run expectations for returns? The same methods that I used in the past can be used today. I will illustrate the long-run return projections as of early 2022. The reader can perform similar calculations by using data appropriate for the time the projection is made.
Looking first at the bond market, as of 2022, we can get a very good idea of the returns that will be gained by long-term holders. Holders of good-quality corporate bonds will earn approximately 3½ percent if they hold the bonds to maturity. Holders of ten-year Treasury bonds until maturity will earn close to 2½ percent. Assuming that the inflation rate does not exceed the 2 percent per year Federal Reserve target, corporate bonds will provide investors with a positive but quite meager rate of return. These yields, however, are considerably lower than they have been since the late 1960s. But if inflation accelerates as it did in 2021–22, bond returns will be negative. And if rates rise, bond prices will fall and bond returns will be even lower. Government bonds will produce a zero or negative real return. It is hard to imagine that bond investors will be rewarded by the yields available in 2022.
What returns can we project for common stocks as of 2022? We can make reasonable estimates of at least the first two determinants of equity returns. We know that the 2022 dividend yield for the S&P 500 Index was under 1.3 percent. Suppose that earnings can grow at about 4.7 percent over the long term, a rate consistent with historical rates and similar to estimates made by Wall Street securities firms in 2022. Adding the initial yield and growth rate together, we get a projected total return for the S&P 500 of 6 percent per year—higher than bond yields but well below the long-term average since 1926, which had been close to 10 percent.
Of course, the major determinants of stock returns over short periods of time will be changes in the ways equities are valued in the market, that is, changes in market price-earnings multiples. Investors should ask themselves whether the valuation levels in the market during 2022 will in fact hold up. Cyclically-adjusted price-earnings multiples in early 2022 were over 35, considerably higher than their long-run historical average. And dividend yields of 1.3 percent were well below their 4½ percent historical average.
To be sure, interest rates were relatively low in early 2022. When interest rates are low, somewhat higher price-earnings multiples and lower dividend yields are justified. Still, we can’t simply assume that rates will always be so low and that inflation will always be benign. The unexpected frequently happens.
There is one predictable pattern in the stock market that also augurs for at best modest stock-market returns over the longer term. Depending on the forecast horizon involved, as much as 40 percent of the variability of future market returns can be predicted on the basis of the initial P/E multiple of the market as a whole.
An interesting way of presenting the results is shown in the diagram on page 345. The diagram was produced by measuring the P/E of the broad U.S. stock market each quarter since 1926 and then calculating the market’s subsequent ten-year total return. The observations were then divided into deciles depending upon the level of the initial P/E multiple. In general, the exhibit shows that investors have earned higher total rates of return from the stock market when the initial P/E of the market portfolio was relatively low, and relatively low future rates of return when stocks were purchased at high P/E multiples.
MEDIAN TEN-YEAR ANNUAL COMPOUND TOTAL RETURN FROM HISTORIC P/E DECILES 1926 TO DATE
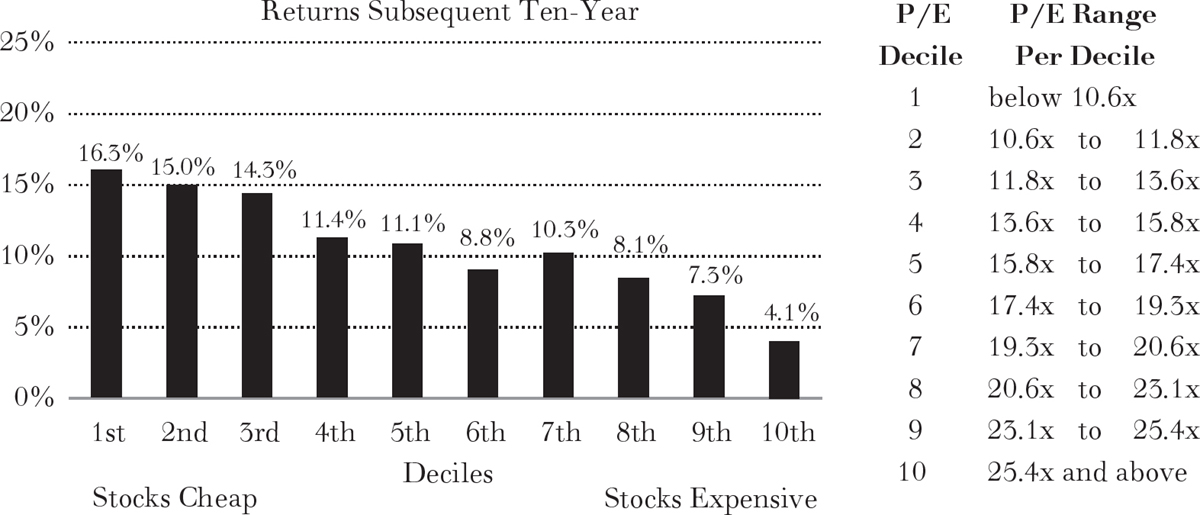
Source: The Leuthold Group, 2022.
In measuring the P/E for the market, these calculations do not use actual earnings per share but rather cyclically adjusted earnings. Thus, the measured P/Es are often referred to as CAPEs—cyclically adjusted P/E multiples. The CAPEs are available on Robert Shiller’s website, and the earnings are calculated as average earnings over the last ten years. (Similar calculations can be obtained by averaging the past five years of earnings.) The Shiller CAPE in 2022 was over 35, exceeded only by valuations in early 2000. CAPEs do a reasonably good job of forecasting returns a decade ahead and confirm the expectation presented here of modest single-digit returns over the years ahead that could be considerably less than the 6 percent estimate presented above. Of course, if your investment period is for less than a decade, no one can predict the returns you will receive with any degree of accuracy.
As a random walker on Wall Street, I am skeptical that anyone can predict the course of short-term stock-price movements, and perhaps we are better off for it. I am reminded of one of my favorite episodes from the marvelous old radio serial I Love a Mystery. This mystery was about a greedy stock-market investor who wished that just once he would be allowed to see the paper, with its stock-price changes, twenty-four hours in advance. By some occult twist his wish was granted, and early in the evening he received the late edition of the next day’s paper. He worked feverishly through the night planning early-morning purchases and late-afternoon sales that would guarantee him a killing in the market. Then, before his elation had diminished, he read through the remainder of the paper—and came upon his own obituary. His servant found him dead the next morning.
Because I, fortunately, do not have access to future newspapers, I cannot tell how stock and bond prices will behave in any particular period ahead. Nevertheless, I am convinced that the very conservative long-run estimates of bond and stock returns presented here are the most reasonable ones that can be made for investment planning decades into the twenty-first century. The point is not to invest with a rearview mirror projecting double-digit returns from the past into the future. We are likely to be in a low-return environment for some time to come.
*Economists often put the proposition in terms of the risk premium—that is, the extra return you can expect from an investment over and above the return from perfectly predictable short-term investments. According to this view, the risk premiums in the 1960s were very small, perhaps 1 or 2 percentage points. During the early 1980s, risk premiums demanded by investors to hold both stocks and bonds expanded to a range of probably 4 to 6 percentage points, as I shall show below.