
NEW METHODS OF PORTFOLIO CONSTRUCTION: SMART BETA, RISK PARITY, AND ESG INVESTING
Results? Why, man, I have gotten a lot of results. I know several thousand things that won’t work.
—Thomas A. Edison
AS THE SECOND QUARTER of the twenty-first century drew to a close, an increasing number of investors grew skeptical that traditional stock picking could produce a portfolio that was superior to a low-cost, tax-efficient, broad-based index fund. Hundreds of billions of dollars were switching from actively-managed mutual funds into passively-managed index funds. But a new breed of portfolio managers argued that one doesn’t have to be a stock picker to beat the market. Rather, you can manage a relatively passive (low turnover) portfolio to accomplish good results more dependably without extra risk.
The three new investment strategies are called smart beta, risk parity, and ESG investing. With the implicit promise that they can improve portfolio performance, they have also attracted hundreds of billions of dollars in assets. This chapter asks the questions: Is smart beta really smart? Is risk parity too risky? Can ESG funds do well financially by doing good for humanity?
There is no universally accepted definition of “smart beta” investment strategies. What most people who use the term have in mind is that it may be possible to gain excess (greater than market) returns by using a variety of relatively passive rules-based investment strategies that involve no more risk than would be assumed by investing in a low-cost total stock market index fund.
I have argued in earlier chapters that the core of every investment portfolio should consist of low-cost, tax-efficient, broad-based index funds. By holding a portfolio containing all the stocks in the market, in proportion to their relative size or capitalization (the number of shares outstanding times the price of their shares), the investor would be guaranteed to receive the market return. Index funds have generally provided higher net returns for investors than actively managed funds that try to beat the market.
If an investor buys a low-cost total (U.S.) stock market index fund, she will receive the market rate of return as well as assume the risks of the characteristic ups and downs of the U.S. stock market. Remember that the risk of the market can be measured by beta and that the beta of the market is defined to have a value of 1, as presented in chapter 9. By assuming the risk of being in the stock market the investor earns a risk premium, defined as the excess return from the market over and above the safe returns that can be earned by holding U.S. Treasury bills.
That risk premium for accepting the volatile ups and downs of stock prices has been substantial. Since 1927 stocks have rewarded investors with returns (including dividends and price increases) of about 7 percentage points per year greater than Treasury bill returns.
But there have been long periods when stocks did poorly and produced inferior returns compared with safe assets. During the nine years from March 2000 to March 2009, stock prices actually declined. Thus, the equity investor must be able to accept long periods of underperformance.
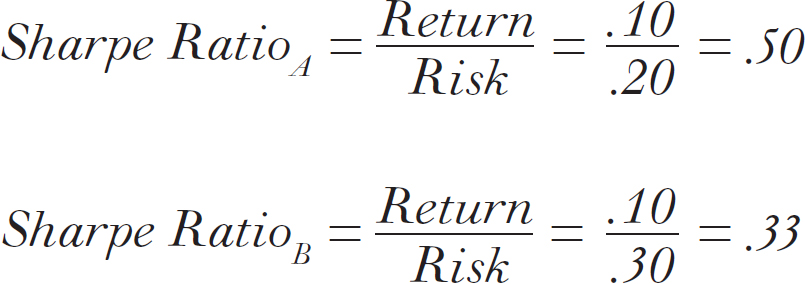
In evaluating the usefulness of tilting a portfolio in any one or in multiple directions, we will employ a statistic used by both academics and practitioners called the Sharpe Ratio. This eponymous statistic was created by William Sharpe, one of the developers of the capital-asset pricing model (CAPM). We know that investors desire high rewards (high returns) and low risk (low volatility). The Sharpe Ratio combines both of those elements in one statistic. The numerator is the return from the strategy, or more commonly, the excess return over the three-month Treasury bill rate. The denominator is the risk or volatility of the strategy measured by the standard deviation of the returns (how variable they have been over time). If strategy A produces a 10 percent excess return with 20 percent volatility, and strategy B produces the same return with 30 percent volatility, we can say that strategy A is preferred because it has a higher Sharpe Ratio—it has a higher return per unit of risk.
What the “smart beta” investment managers would have us believe is that pure indexing, where each company has a weight in the portfolio given by the size of the company’s total capitalization, is not an optimal strategy. A better risk-return tradeoff (i.e., a higher Sharpe Ratio) can be obtained. The trick is to tilt (or flavor) the portfolio in some direction such as “value” versus “growth,” small versus large companies, and relatively strong stocks versus weak ones.
Other tilts or flavors that have been suggested include “quality” (encompassing attributes such as stable sales and earnings growth, and low leverage), profitability, low volatility, momentum, and liquidity. Just as good cooking blends a number of food flavors, some “smart beta” portfolios mix two or more flavors together. There are portfolios that blend “value” and “small size” as well as those that mix several of the flavors mentioned above.
“Smart beta” strategies are related to the multifactor models discussed in chapter 9. Indeed, the technique is often called factor-based investing. If one assumes that the beta of the capital-asset pricing model is an incomplete measure of risk, the tilts or flavors listed above can be considered additional risk factors. By tilting the portfolio toward smaller companies, for example, the investor is making a bet that the risk premium that is available from smaller companies can enhance returns. Here, of course, “smart beta” is interpreted as a technique to enhance returns by assuming additional risk.
FOUR TASTY FLAVORS: THEIR PROS AND CONS
In 1934, David L. Dodd and Benjamin Graham published a manifesto for investors that has attracted strong adherents, including Warren Buffett. They argued that “value” wins over time. To find “value,” investors should look for stocks with metrics such as low price-earnings ratios and low prices relative to book value. “Value” is based on current realities rather than on projections of future growth. The theory is consistent with the views of behaviorists that investors tend to be overconfident in their ability to project earnings growth and thus overpay for “growth” stocks.
I have considerable intellectual sympathy with this approach. One of my cardinal rules of stock selection is to look for companies with good growth prospects that have yet to be discovered by the market and sell at relatively low earnings multiples. This approach is often described as GARP, “growth at a reasonable price.” I have warned investors repeatedly about the dangers of high-multiple stocks. Because earnings growth is so hard to forecast, it’s far better to be in low-multiple stocks. If growth does materialize, both the earnings and the multiple will likely increase, giving a double benefit. Buying a high-multiple stock whose earnings growth fails to materialize subjects investors to a double whammy. Both the earnings and the multiple can fall.
There is historical evidence that a portfolio of stocks with relatively low earnings multiples (as well as low multiples of book value, cash flow, and/or sales) produces above-average rates of return even after adjustment for risk, as measured by the capital-asset pricing model. For example, the figure that follows shows the return from ten equal-sized groups of stocks, ranked by their P/E ratios. Group 1 had the lowest P/E, Group 2 the second lowest, and so on. The figure shows that as the P/E of a group of stocks increased, the return decreased.
AVERAGE ANNUAL RETURNS VS. P/E RATIO
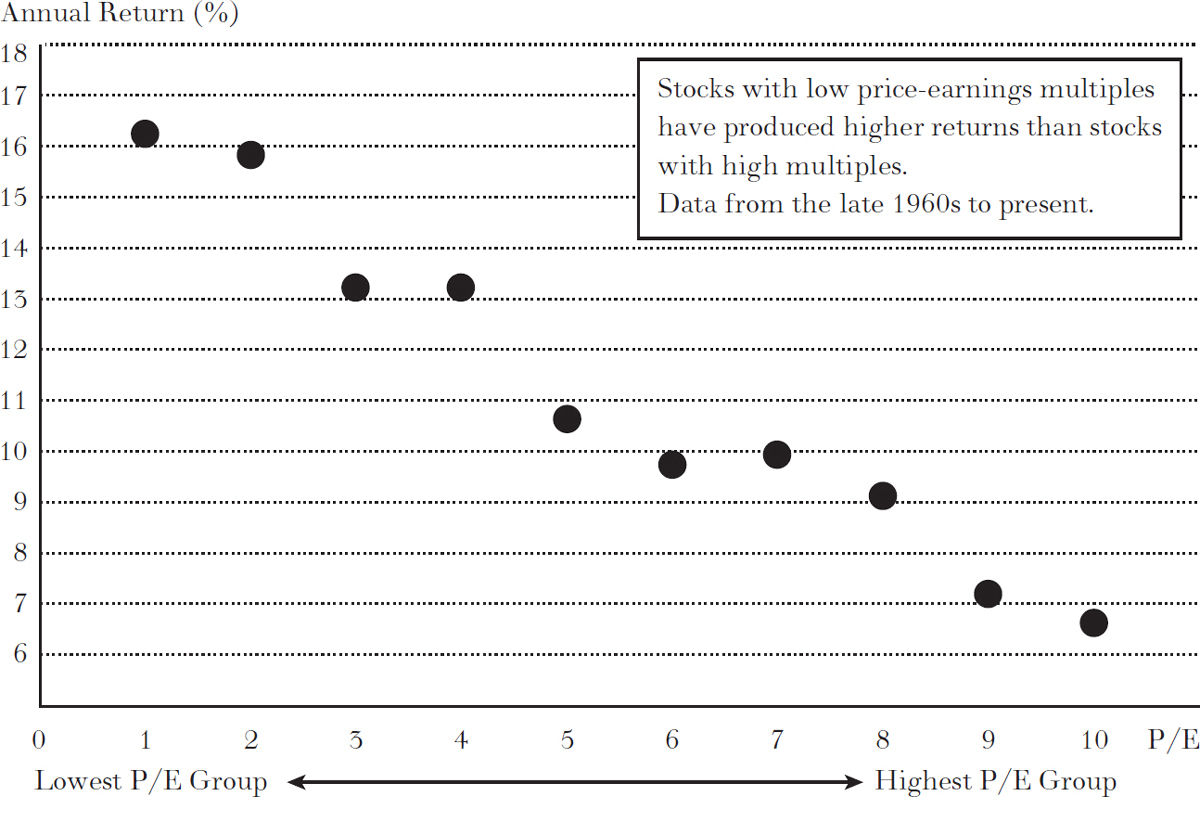
Source: Stern School of Business, New York University.
Low P/E multiples and low price-to-book-value (P/BV) ratios can reflect risk factors. Companies in some degree of financial distress are likely to sell at low prices relative to earnings and book values. For example, the big money center banks such as Citigroup and Bank of America sold at prices well below their reported book values during 2009, when it appeared that these institutions could quite possibly be taken over by the government and the stockholders’ equity wiped out.
The standard measurement of the value factor is referred to as HML—the return on the 30 percent of stocks selling at the highest ratios of book-to-market value minus the 30 percent of stocks selling at the lowest ratios of book-to-market value. From 1927 through 2020, the annual risk premium available from the value factor has been 4.0 percent.
Another way to measure the value premium is by calculating its Sharpe Ratio. Since 1927 the value factor (as measured by HML) has produced a Sharpe Ratio of 0.34—a sizeable reward to risk ratio that is almost as large as that for the beta market factor discussed above.
It is possible to purchase portfolios that divide the broad stock-market portfolio into two components—the “value” and the “growth” components. The “value” component holds those stocks with the lowest price-earnings and price-to-book ratios. A representative “value” ETF sponsored by the Vanguard Group trades under the ticker symbol VVIAX, which tracks the CRSP Large-Cap Value Index. The Vanguard VIGAX ETF tracks the performance of the “growth” component of the CRSP Large-Cap Index. “Value” and “growth” EFTs are available for small-cap broad indexes as well.
Another pattern that academic investigators have found is the tendency over long periods of time for small-company stocks to generate larger returns than large-company stocks. Since 1926, according to Roger Ibbotson, small-company stocks in the United States have produced rates of return about 2 percentage points higher than the returns from large-company stocks. The diagram that follows shows the work of Fama and French, who divided stocks into deciles according to their size. They found that decile 1, the 10 percent of stocks with the smallest total capitalization, produced the highest rate of return, whereas decile 10, the largest capitalization stocks, produced the lowest rate of return. Moreover, small firms tended to outperform larger firms with the same beta levels. While other studies have tended to cast doubt on the durability of the size phenomenon, it does appear that size is a factor explaining historical returns.
Nevertheless, we need to remember that small firms may be riskier than large firms and deserve to give investors a higher rate of return. Size is therefore a risk factor that deserves to be compensated with additional return, not an inefficiency.
AVERAGE MONTHLY RETURNS VS. SIZE: 1963–1990
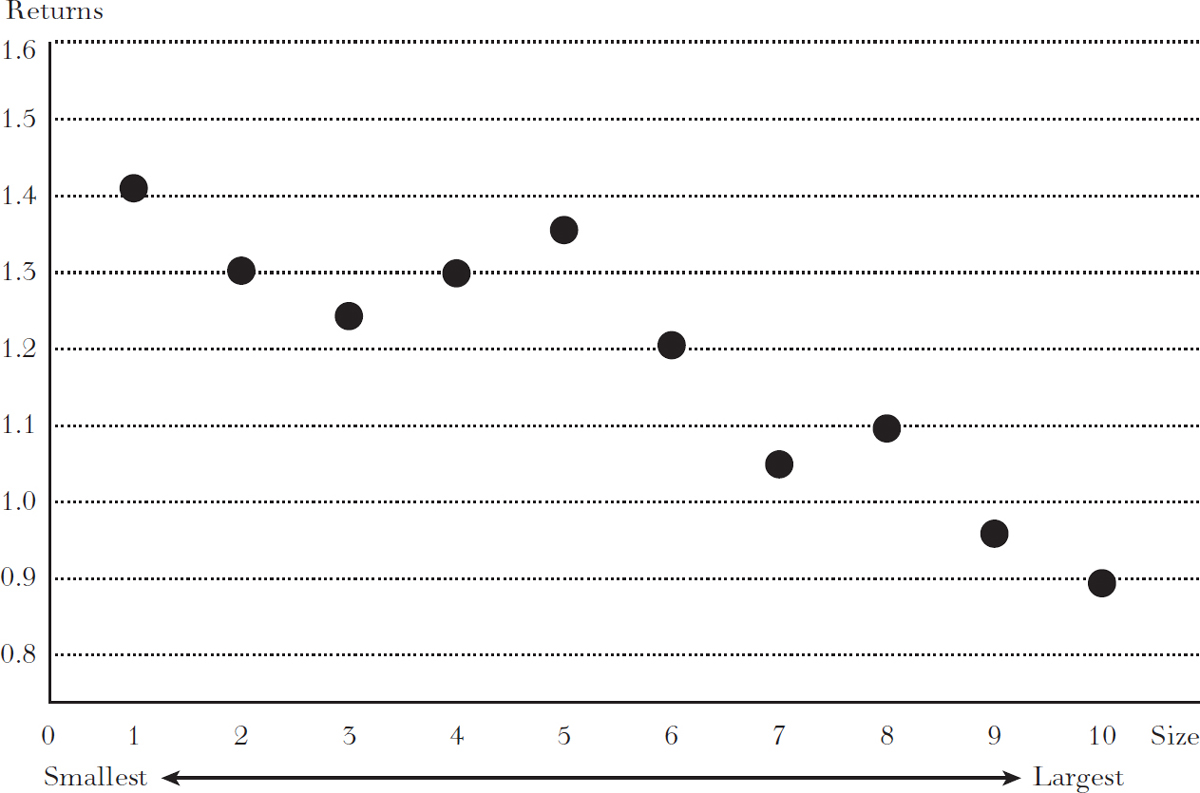
Portfolios of smaller firms have tended to produce higher rates of return than portfolios of larger firms.
Source: Fama and French, “The Cross-Section of Expected Stock Returns,” Journal of Finance (June 1992).
3. There Is Some Momentum in the Stock Market
The earliest empirical work on the behavior of stock prices, going back to the early 1900s, found that a sequence of random numbers had the same appearance as a time series of stock prices. But more recent work has indicated that the random-walk model does not strictly hold. Some patterns appear to exist in the development of stock prices. Over the short holding periods, there is some evidence of momentum in the stock market. Increases in stock prices are slightly more likely to be followed by further increases than by price declines. For longer holding periods, reversion to the mean appears to be the pattern. When large price increases have been experienced over a period of months or years, such increases are often followed by sharp reversals.
Two possible explanations for the existence of momentum have been offered: the first is based on behavioral considerations; the second, on sluggish responses to new information. Robert Shiller, a leader in the field of behavioral finance, emphasized a psychological feedback mechanism imparting a degree of momentum into stock prices, especially during periods of extreme enthusiasm. Individuals see stock prices rising and are drawn into the market in a kind of “bandwagon effect.” The second explanation is based on the argument that investors do not adjust their expectations immediately when news arises—especially news of company earnings that exceeded (or fell short of) anticipation. Abnormally high returns often follow positive earnings surprises as market prices appear to respond only gradually to earnings information.
It is hard to interpret evidence of momentum in the stock market as reflecting risk. It is the case, however, that there are frequent “momentum crashes,” where the stocks that have been market favorites have suffered punishing reversals. Certainly there is a degree of risk to trend-following strategies.
Momentum is typically measured by looking at the last twelve months’ return excluding the most recent month. (The most recent month is eliminated because it often exhibits a reversal.) The measurement of the momentum factor is the average return of the best performing 30 percent of stocks minus the average return of the worst performing 30 percent of stocks. From 1927 through 2020 a momentum strategy involving being long the best performing stocks and short the poorest performers generated a risk premium of 9.1 percentage points and a Sharpe Ratio of 0.59 over a period of more than ninety years. Of course, the assumption in the measurement of all the factors is that the investor is long the stocks with strongest momentum, deepest value, and smallest size, and short the stocks at the other end of the spectrum. No account is taken of trading costs, taxes, and other possible implementation costs.
4. Low-Beta Stocks May Return as Much as High-Beta Stocks
Recall the discussion in chapter 9 demonstrating the empirical result that the relationship between beta and return was flat. High-beta stocks do not produce the higher returns hypothesized by the capital-asset pricing model. But since low-beta stocks are less volatile, an investor can improve her Sharpe Ratio by holding low-beta portfolios. Hence low volatility can be considered an additional factor that can improve the investor’s risk-return tradeoff.
Investors can use this fact to fashion a variety of “betting against beta” portfolio strategies. For example, suppose very low beta portfolios have a beta of ½ (they are half as volatile as the broad market portfolio) but produce the same return as the market, which by definition has a beta of 1. Suppose the market return was 10 percent. By buying a low-beta portfolio on margin (putting up fifty cents for each dollar of market value), an investor could double the beta and double the return of the low-beta portfolio. We shall see later in this chapter that such a technique is the basis for so-called “risk parity” investing.
Numerous other factors have been suggested as helpful in “explaining” historical stock returns. Two of the most commonly used are statistics measuring a company’s “profitability” and “quality.”
Will the strategies work with real money? Historically four of the factors considered above—value, size, momentum, and low beta—have produced good risk-adjusted returns. But in practice it may not be possible for investors to capture the additional risk premiums that appear to be available.
Remember that the actual risk-return results researchers have calculated assume that the portfolio is long one factor and short the other (e.g., long value, short growth). In practice such a strategy can involve considerable transactions costs and may be difficult to implement. The cost of borrowing stock to sell short may be very expensive and the supply of stock available to borrow can be limited. If the factor returns are caused by behavioral errors rather than reflections of risks, they may get arbitraged away, particularly as more investment dollars flow into smart-beta products. Indeed, factor premiums have tended to attenuate after they are given wide publicity.
There are investment funds and ETFs available that allow investors to buy a portfolio that concentrates on each of the four factors discussed. The ETF VVIAX, sponsored by the Vanguard Group, is a representative “value” fund that tracks the performance of the CRSP U.S. Large-Cap Value Index, a broadly diversified index made up predominately of “value” stocks of large U.S. companies. The Vanguard VSMAX ETF tracks the performance of an index of small-sized companies, that is, small-cap stocks. Further, there are ETFs that tilt the portfolio toward stocks that are exhibiting relative strength compared with the whole market. The fund AMOMX, sponsored by the investment firm AQR, invests in large-cap and mid-cap companies that are determined to have positive momentum. There is also a single-factor ETF SPLV, which buys low-volatility stocks.
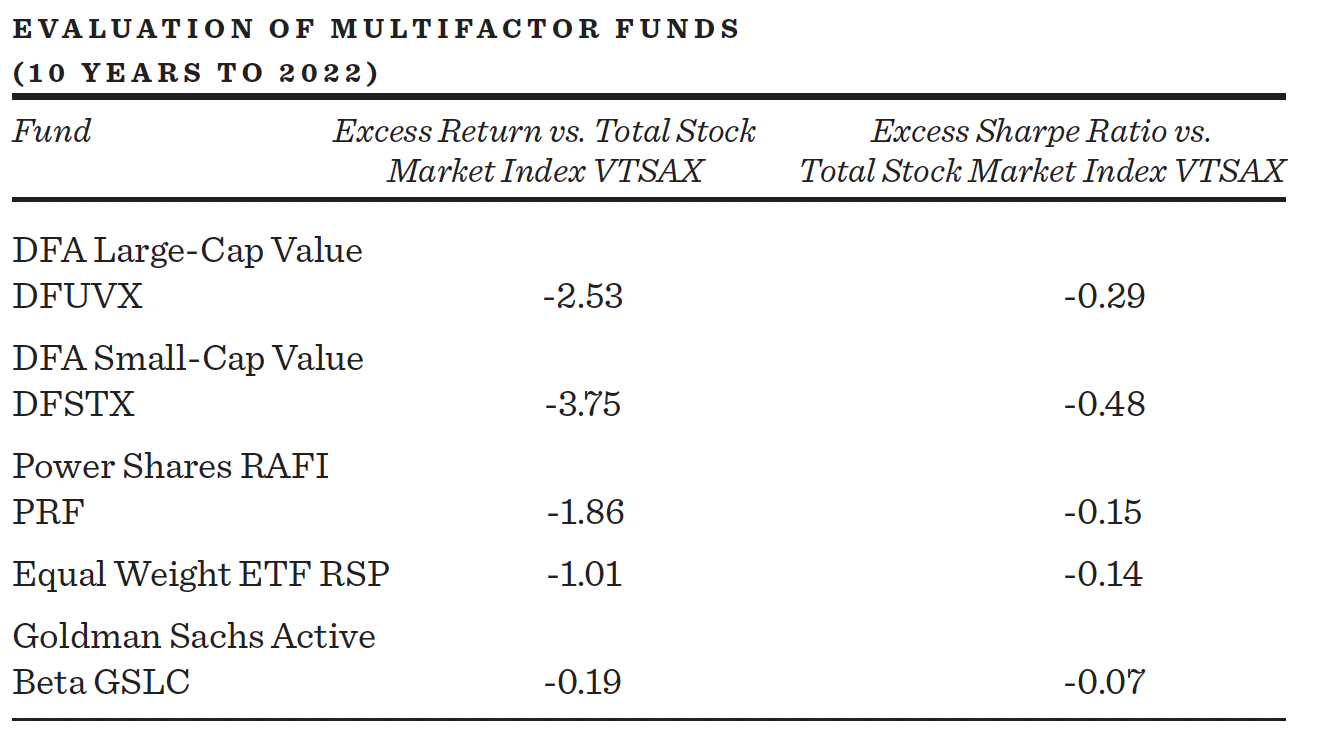
In the table on page 267, we compare four single-factor ETF results with comparison simple index funds. In the comparison we use a total stock market index fund from Vanguard (ticker symbol VTSAX). The table presents the results. The single-factor funds have either produced returns that are roughly equivalent to broad-based index funds or their returns have been inferior. Momentum stocks during this decade did slightly better than the broad market. But value, small-cap, and low volatility stocks did worse. All single-factor funds have experienced long periods of underperformance. Moreover, there has been no improvement in their risk-adjusted returns. Smart beta portfolios of single-factor funds have not proved to be a superior way to invest.

Thus far we have considered employing factor tilts (or flavors) such as “value,” “size,” and “momentum” singly in constructing portfolios. We can now examine whether blended strategies, where different tilts or flavors are applied simultaneously, may produce more consistent results. Perhaps diversification among the different factors can produce enhanced returns or lower risk for a given level of return. Factor diversification should help if the correlation between factors is small. If the correlation between some factors is actually negative, we should expect even higher risk-adjusted returns.
In fact, the correlations between factors are low or negative. For example, the momentum factor is negatively correlated with the market beta, value, and size factors. Thus, results should be improved by capturing the potential diversification benefits of using blended factor strategies. For example, when value tilting is not working, an exposure to momentum will tend to enhance returns. The table on page 268 shows the measured correlations between factors over the period 1964–2020.
CORRELATIONS BETWEEN FACTORS (1964–2020)
Factor |
Market Beta |
Size |
Value |
Momentum |
Market Beta |
1.00 |
0.26 |
-0.27 |
-0.19 |
Size |
0.26 |
1.00 |
-0.02 |
-0.12 |
Value |
-0.27 |
-0.02 |
1.00 |
-0.16 |
Momentum |
-0.19 |
-0.12 |
-0.16 |
1.00 |
Source: Andrew L. Berkin and Larry E. Swedroe, Your Complete Guide to Factor-Based Investing; updated data from Swedroe.
Andrew Berkin and Larry Swedroe, the authors of an excellent guide to factor investing, simulated results from building portfolios by combining the different factor tilts. In the table above the blended portfolio is allocated by placing 25 percent of the invested funds in each of the four factors: market beta, size, value, and momentum. We note that the blended portfolio exhibits a dramatically lower instability (standard deviation of returns) and a much higher Sharpe Ratio. Even higher Sharpe Ratios can be obtained by adding “profitability” and “quality” factors but at the cost of lower mean returns.
SWEDROE AND BERKIN SIMULATED RESULTS: 1927–2020 RETURN AND RISK
|
Mean Return (%) |
Standard Deviation (%) |
Sharpe Ratio |
|
Market Beta |
8.7 |
20.3 |
0.43 |
|
Size |
3.1 |
13.6 |
0.23 |
|
Value |
4.0 |
15.3 |
0.26 |
|
Momentum |
9.1 |
15.6 |
0.59 |
|
Factor Portfolio |
6.4 |
8.7 |
0.71 |
|
Of course these simulated results do not take account of any management fees or transaction costs. Moreover, the individual size, value, and momentum segments are long/short portfolios,* and it is assumed that there is no difficulty effecting short sales. The question remains whether the simulated gains in portfolio performance can actually be achieved in practice. Moreover, while the long-run results for many multifactor strategies have been good, it is interesting to examine the performance during the most recent decades ending in 2022 when the “size,” “value,” and “low volatility” factors have not had positive results.
Dimensional Fund Advisors (DFA)
Dimensional Fund Advisors was formed in the early 1980s to provide investors with vehicles that apply blended factor strategies to actual portfolios. The portfolios are designed using the size and value factors in the original Fama-French three-factor model, augmented by a tilting toward strong recent price momentum and strong profitability growth among other factors. DFA had well over $650 billion of assets under management in 2021.
DFA funds have experienced somewhat better performance than many of the other “smart beta” offerings available to investors. They are generally low cost with expense ratios only moderately higher than the fees of broad-based capitalization-weighted ETFs. DFA funds are available as both mutual and exchange-traded vehicles as well as through investment advisors. The company is quite explicit that any extra returns it may earn represent an appropriate compensation for added risk. Moreover, like all “smart beta” funds, the funds have experienced periods of underperformance, especially during the decades ending in 2022 when “value” stocks severely lagged the returns of “growth” stocks.
Research Affiliates Fundamental Index™ (RAFI)
Another early supporter of “smart beta” investing, Research Affiliates, had over $150 billion of assets under management in 2021. The founder of Research Affiliates, Robert Arnott, argues that capitalization weighting (i.e., weighting by the market value of each company) implies that holders of such portfolios will always be holding too big a share of overpriced growth stocks. He avoids this so-called “inefficiency” by adjusting the weight of each stock to its economic footprint such as earnings, assets, and the like. He calls this “Fundamental Indexing.” Of course, this weighting gives the RAFI portfolios a tilt toward value and small size so that the portfolios are similar to other multifactor “smart beta” offerings.
One period when RAFI delivered excellent results was 2009, when bank stocks, selling at discounts from their asset values, were substantially over-weighted. But the strategy was extremely risky since it was far from clear at the time that troubled banks would avoid nationalization. During periods when “value” stocks underperformed, so did the RAFI portfolios.
Goldman Sachs introduced their smart-beta fund in 2015. The exchange-traded fund trades under the ticker symbol GSLC. The ETF relies on four factors: good value, strong momentum, high quality, and low volatility. The expense ratio of the fund was only nine basis points (9/100 of one percent), the lowest of the smart-beta offerings and close to the lowest total stock-market index fund.
By weighting each stock in an index equally, rather than by its total capitalization, an investor can obtain similar results to those from some of the multifactor models. Equal-weighting therefore increases the weight of both small companies and value stocks while decreasing the weight of the most popular large-growth stocks. The Invesco Equal Weight 500 ETF (ticker symbol RSP) invests in each of the stocks in the S&P 500 Index at a 1/500 weight. Equally-weighted portfolios have different diversification and risk characteristics than capitalization-weighted portfolios. They are also tax inefficient. The rebalancing to maintain equal weight involves selling stocks that have risen the most in price so as to reduce their weight in the portfolio.
The long run records of the multifactor funds have been somewhat promising. Because they have been able to benefit from the low or negative correlations between the factors, some have been able to provide moderate increases in return, with Sharpe Ratios very close to those of the broad stock-market indexes. But, paradoxically, their performance during the ten-year period ending in 2022 was even worse than the single factor fund. They can also be somewhat less tax-efficient, as the rebalancing involved in the execution of the strategy can produce taxable capital gains.
“Smart beta” strategies rely on a type of active management. Rather than selecting individual stocks, they tilt the portfolio toward various characteristics that have historically appeared to generate larger than market returns. In their favor, the “smart beta” portfolios provide these factor tilts at expense ratios that are often considerably lower than those charged by traditional active managers.
In general, the records of “smart beta” funds and ETFs have been spotty. Multifactor ETFs have failed to produce excess returns over the past decade. Moreover, these funds are less tax efficient than capitalization weighted funds that do not require rebalancing.
And even during periods when these funds have produced excess returns and more favorable Sharpe Ratios, they should be interpreted as a reward for assuming a different set of risks. “Smart beta” portfolios may not represent a sophisticated, better mousetrap for investors. Investors should be wary of getting caught in the riskier mousetrap themselves.
Smart beta portfolios have been the object of considerable marketing hype. Whether “smart beta” strategies will turn out to be smart investing in the future depends crucially on the market valuations existing at the time the strategy is implemented. U.S. “value” strategies performed extraordinarily well coming out of the Internet bubble when technology “growth” stocks were priced richly relative to most “value” stocks. But over the decade ending at the start of 2022, “value” and “size” performed very poorly. Investors should be aware that if any factor becomes richly priced, as “smart beta” funds become increasingly popular, the results could well be disappointing. Over the ten-year period ending in the early 2020s, it was the “growth” factor that became increasingly popular.
Strategies that become well known often lose their effectiveness after publication of their results. This is especially so if they rely on pricing errors rather than compensation for risk. If you do want to take a chance that some risk factors will generate improved risk-adjusted returns in the future, you can do so most prudently if the core of your portfolio consists of capitalization-weighted broad-based index funds.
Ray Dalio is a unique individual. He is at once a billionaire and a number one best-selling author. He has run large hedge funds at Bridgewater Associates, where he developed the enormously successful risk parity fund, called the All Weather Fund. In his book, entitled Principles, he describes the more than 200 principles that guided his firm.
Whether Principles is a template to show people how to succeed in the investment business is unclear. One can’t argue with the idea that investment strategies must be “evidence based” and tested against vigorous debate. But the work environment that Dalio created at Bridgewater has been described as toxic.
Dalio insists that employees be constantly evaluated with “radical honesty” rather than with kindness in an attempt to improve their performance. Observations (so-called dots) are collected daily regarding the effectiveness of the organization’s individual people. All meetings are taped. Employees are subject to public criticism, and all have baseball cards detailing their weaknesses, available online for everyone to see. The public criticisms of employees who don’t measure up are called “public hangings.” Employees are told to look to the example of a pack of hyenas murdering a young wildebeest as a blueprint for how to deal with each other. Small wonder that a third of Bridgewater employees leave the firm within a few years. One employee complained to the Connecticut Commission on Human Rights that Bridgewater was a “cauldron of fear and intimidation.”
But there is no denying that the organization has been successful in gathering assets. And some people have appreciated this hardline culture. One of these was a former employee, James Comey of FBI fame. Comey has said, “I’ve been ‘probed’ in this strange field trip through life. I’ve testified in court, I have briefed the president of the United States repeatedly, I’ve argued in front of the United States Supreme Court, and I’ve been probed at Bridgewater. And Bridgewater is by far the hardest.” And for all you can criticize Ray Dalio, Comey said, “he is one smart bastard.”
One of Bridgewater’s greatest commercial successes had been the development of “risk parity” investment techniques. The evidence-based principle on which it rests is that relatively safe assets often provide higher returns than are appropriate for their level of risk, while riskier assets can be relatively overpriced and return less than they should. Investors can therefore improve their results by leveraging low-risk assets, buying them with some borrowed money, so as to increase their risk and return.
There are two methods by which an investor can hope to increase the return and risk of a portfolio. One technique is to overweight the portfolio with higher risk assets such as common stock. A second plan is to invest in a broadly diversified portfolio of relatively safer assets promising modest returns and relatively low expected volatility. The relatively safe assets can then be leveraged up to increase both their risk and return and offer the investor a better expected return per unit of risk. To be sure, leveraging can create its own unique set of extra risks since a leveraged investor is less able to ride out temporary storms in financial markets. But for investors with the capacity to accept the additional risks of leverage, the bargain offered by risk-parity portfolios may be sufficiently attractive to deserve a place in the overall portfolio.
There is considerable evidence that individuals appear to overpay for wagers that offer a slim likelihood of winning but a large potential payoff if they are successful. Imagine you are at a race track. If you bet on every horse you would be guaranteed to hold a winning ticket since one horse will always win the race. But after collecting your winnings you would find that you lost about 20 percent of your money, since the track figures the payoff only after deducting 20 percent from the total amount bet to take care of taxes, expenses, and profits.
In every race there are long shot horses, considered the most unlikely to win but with the largest potential payoffs. Suppose you thought the prospect of such big payoffs was so attractive that you bet on the longest shot in every race. You would win occasionally but over time you would lose approximately 40 percent of the amount bet. On the other hand, if you bet the favorite in every race you would win about a third of the time. Still, over time you would lose, but only about 5 percent of the amount bet. While there is no surefire way to win at the race track, it is less bad to bet favorites consistently than to bet long shots. While in general the betting odds do a good job of predicting the order of finish, people underbet favorites and overpay for long shots with the possibility of winning big.
In the world of asset classes there are also favorites and long shots. A striking similarity between payoffs in the stock market and at the race track is that there is a tendency for people to overpay for investments with high risks but a possibility for unusually high returns. Very safe stocks appear to offer higher returns than their risk would warrant.
In chapter 9 we reviewed the original Fama-French study showing that high beta stocks (those with the highest sensitivity to general declines in stock prices) do not provide investors with any higher rates of return than more stable stocks. These findings underlie one possible risk parity strategy. If the historical pattern of a flat return-beta relationship continues, it will be optimal to buy low-beta assets on margin to increase risk and return of the portfolio to the level the investor desires. By employing enough leverage, it will be possible to increase the portfolio beta to the same level as the market portfolio while earning a higher than market rate of return.
Safe Bonds May Also Provide Opportunities to Employ Risk-Parity Techniques
The finding that low-risk assets appear to produce higher rates of return than seem warranted holds up not only within the stock market, but also among different asset classes. Bonds are about half as volatile as stocks. The volatility of bond returns is about 50 percent lower than stock returns (2 percent standard deviation of returns for stocks versus less than 1 percent for bonds). But corporate bonds produced average returns of 5.9 percent versus stock returns of 10.3 percent over a more than 90-year period ending in 2022.
Risk parity recognizes such apparent empirical regularities and attempts to take advantage of them by buying bonds on margin to increase the bond’s return while increasing the level of risk to that of a portfolio of common stocks. An example of such a transaction is shown in the following table. Here we show what the results would have been over the 2007–2016 period for an investor buying bonds on 50 percent margin. Such an investor would double her return and double her risk.†
AN ILLUSTRATION OF RISK PARITYRETURNS OF STOCKS AND BONDS(TEN YEAR DATA FROM 2007)
|
Average Annual Return (%) |
Standard Deviation (%) |
S&P 500 |
8.6 |
2.0 |
10-Year U.S. Treasury Bond |
5.1 |
0.8 |
Leveraged Bond Investment(50 percent margin)* |
10.2 |
1.6 |
*Assuming zero cost of borrowing $50 for every $100 invested.
Risk Parity versus the Traditional 60/40 Portfolio
An alternative argument for risk parity can also be supported using the techniques described in chapter 8 in our discussion of portfolio theory. Many institutional portfolios and “balanced” funds contain 60 percent stocks and 40 percent bonds or use the 60/40 benchmark as a proxy for their performance benchmark. Risk parity, however, may provide a better risk-return tradeoff.
The 60/40 portfolio would appear to be very prudent and well designed to protect investors from the inevitable sharp dips in the stock market. In fact, about 90 percent of the volatility in these portfolios comes from the 60 percent portion invested in stocks. Moreover, in the “crisis” year 2008, 60/40 portfolios lost over 25 percent of their market values. We can easily demonstrate that a 60/40 portfolio may not be optimal.
Think of the locus of points (called the opportunity locus, such as the one pictured in the following diagram) as representing all combinations of stocks and bonds and the risk-return characteristics produced by the alternative portfolios. The lowest risk portfolio consists of 100 percent bonds since bonds have a lower standard deviation than stocks. By adding some stocks to the portfolio, we can obtain a higher rate of return since stock returns have historically been higher than bond returns. For at least some combinations of stocks and bonds, the standard deviation of the resulting portfolio can decline since bonds have typically had low (and sometimes even negative) correlations with stocks. Eventually, however, as we move to a 100 percent stock portfolio, risk increases, since the standard deviation of stock returns exceeds that of bond returns.
RISK PARITY VS. 60/40 PORTFOLIO
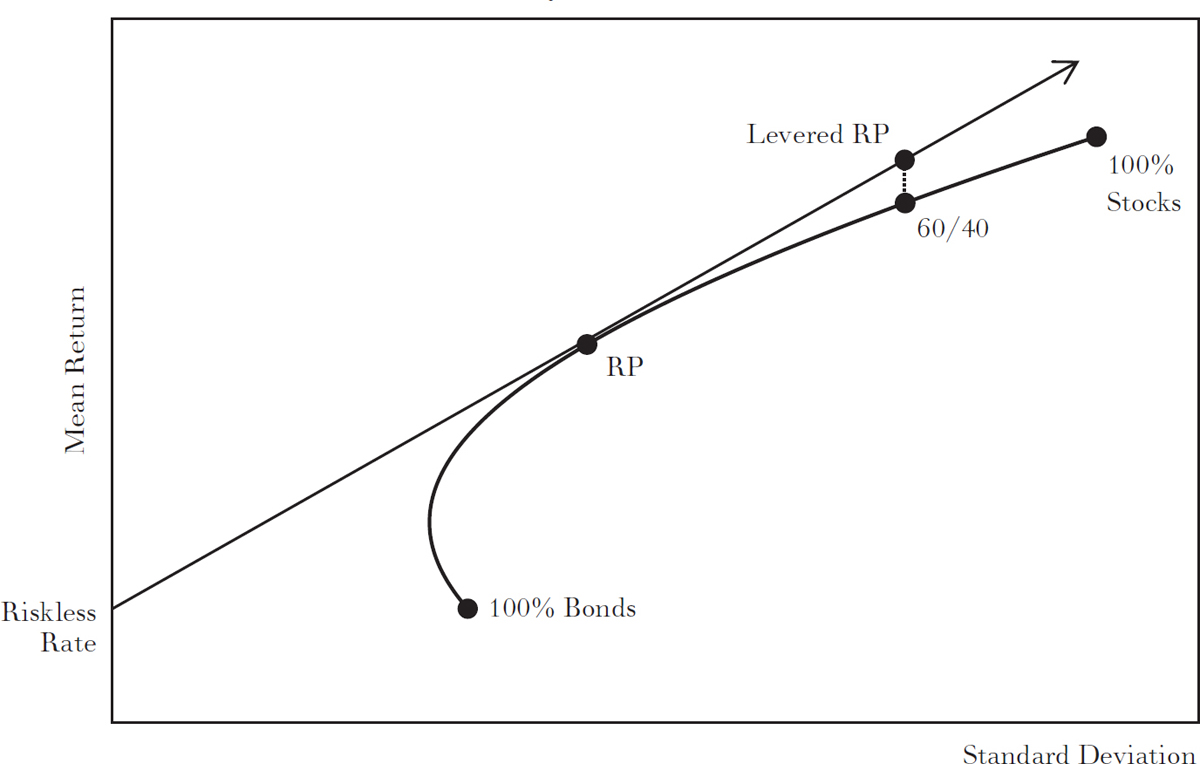
Two additional points along the curved locus are of interest. Note that the portfolio consisting of 60 percent stocks and 40 percent bonds lies along the locus close to the end of the point representing all stocks. Also, observe the line segment emanating from the risk-free rate that is tangent to the opportunity locus. We will call the portfolio at the tangency point the risk-parity (RP) portfolio of stocks and bonds.‡ An investor can move along the line to the right of the RP point by purchasing the RP portfolio on margin, borrowing at the risk-free rate. All the investment alternatives along the tangency line provide as good or better risk-return tradeoffs than portfolios on the curved locus. In particular, the leveraged RP portfolio clearly dominates the 60/40 portfolio. It has the same risk as the 60/40 portfolio, but it offers a higher return.
Bridgewater’s All Weather Fund
Thus far we have illustrated risk-parity portfolios using only two asset classes: stocks and bonds. In practice, risk-parity portfolios will include a number of asset classes. For instance, real estate assets (accessed, for example, with an REIT index fund) could be included in the overall portfolio; so could commodity funds as well as Treasury inflation-protected securities (TIPS). The lower-risk assets would be held on margin. As long as the added asset class has a relatively low correlation (or at least not a very high correlation), portfolio effects would tend to lower the volatility of the overall portfolio. Moreover, the different asset classes would react differently to different economic conditions. This is why Bridgewater Associates calls its risk-parity offering the All Weather Fund.
Note that the technique does not rely on active portfolio management. The component parts of the portfolio could be indexed and passively managed. The technique does not rely on switching among asset classes according to the timing instincts of the portfolio manager. Moreover, risk parity is applicable even if other risk measures, such as downward sensitivity, are deemed to be more appropriate than overall portfolio volatility. What is required is that asset allocations are adjusted so that all components of the portfolio contribute equally to portfolio risk.
The risk-parity approach gained in popularity during the 2008 financial crisis because RP portfolios tended to outperform traditionally-weighted portfolios with their large equity allocations. Different RP approaches use different weightings and different assets, but all tend to give bonds a heavier weight than in standard portfolios. While RP is not simply a bet on leveraged bonds, the risks involved need to be considered carefully.
Bonds have produced excellent risk-adjusted returns from the early 1980s through 2020. This permitted risk-parity investors to buy bonds with leverage and obtain a net return higher than that available from common stocks. But in the early 1980s U.S. Treasury bonds had double-digit yields. In 2020, 10-year Treasury yields were less than one percent. If yields rise to more normal levels, the prices of bonds will fall, further reducing their rates of return. While interest rates may remain low in the environment predicted by many economic forecasters, bonds are highly unlikely to produce returns anywhere near as high as they did during the 1982–2020 period.
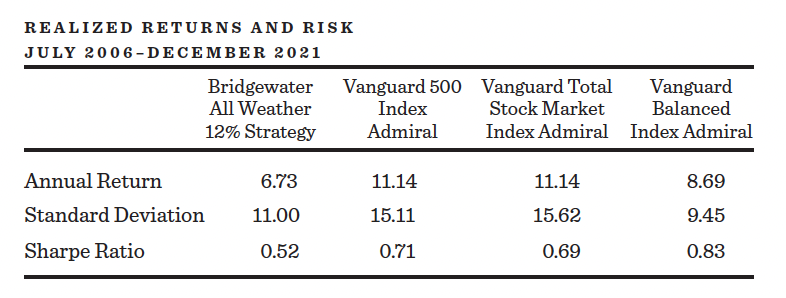
Leverage is a potentially dangerous tool for investors. An unlevered investor can continue to hold a bond that has fallen in price hoping that eventually the price bounces back or the bond matures at par. Levered investors may be forced to liquidate their positions during a sharp downturn and be forced to turn a temporary loss into a permanent one. Thus, while bond returns may have low volatility under normal circumstances, that volatility could rise sharply and exhibit a significant negative skew. It is also possible that other asset classes in the risk-parity portfolio may fail to produce adequate risk premiums and may not have the same correlations with economic conditions as they have had in the past. The actual historical results for the Bridgewater All Weather (12% strategy) Fund is shown in the table below. The fund did not produce returns higher than a Vanguard Balanced Index Fund and its Sharpe ratio was considerably lower. The more recent realized results from the original risk parity portfolio have failed to live up to their theoretical promise.
Risk-parity portfolios are clearly not optimal in all economic circumstances. Nevertheless, the use of leverage is one investment technique that needs to be in the investor’s tool box. In my view risk parity should not be considered as simply a leveraged bet on holding fixed-income securities. Rather the technique should be judged as being appropriate in some circumstances for investors who hold a broadly diversified portfolio (including international securities) and wish to enhance the entire portfolio’s return and risk with the use of leverage.
High net worth investors who seek to have a part of their portfolio in higher return assets, and who have the capacity to accept the risk of employing leverage, might consider adding a risk-parity portfolio to their other investments. As between concentrating the portfolio in higher return investments or enhancing returns with leverage, the latter strategy can be more effective.
ESG investing became the most popular form of active management in the early 2020s. It means that the portfolio manager will give explicit consideration to the environmental and social impacts of portfolio holdings as well as to whether each company’s leadership and board of directors comply with best governance practices. Some proponents of ESG investing believe that the incorporation of ethical considerations in portfolio construction will not only benefit society but can also improve investment returns. The mantra for the movement, often attributed to Benjamin Franklin, is “You can do well by doing good.” BlackRock, the world’s largest asset manager with almost $10 trillion in assets under management in 2021, explicitly suggests that “sustainable investing” can enhance investment returns. Bloomberg Intelligence expects that by 2025 over $50 trillion (more than one third of the estimated total funds under management) will be invested with an ESG mandate.
While no one can fault the virtuous motives behind the movement, in practice, it is extremely difficult to determine whether the companies in an ESG portfolio will have the desired social impacts. Rating agencies supposedly fulfill the need by providing composite ESG scores for publicly-traded companies. These agencies range from specialized enterprises like Sustainalytics to large index providers like MSCI and are increasingly influential in determining how capital is allocated. The scores from different providers disagree dramatically, however. A study done at the Massachusetts Institute of Technology found that the correlations among the raters average only 0.61 with some pairwise correlations as low as 0.42. To put these numbers into perspective, some correlations between the credit ratings of Standard and Poor’s and Moody’s is over 0.99.
ESG raters cannot even agree when they are considering the same attribute, such as carbon intensity. Within the electric utility industry, a company with some of the biggest carbon footprints is Xcel Energy. Xcel is ranked poorly by some raters because it generates a substantial share of its power from coal. But Xcel is the first U.S. utility committed to going 100 percent carbon free by 2050 and is a leader in building wind-generation facilities. Should we refuse to invest because of its carbon footprint, or do we approve of the company because of their responsible investments that may ultimately lead to lower carbon emissions?
ESG ratings also differ markedly for companies for which carbon is not a major factor. Apple gets a high ESG rating of 73 out of 100 from Refinitiv. S&P Global rates them only 23/100 and close to the bottom of their 22-company industry. Even on the identical ESG component of governance, ratings are not even close to one another. Sustainalytics considers Apple’s management among the most compliant with the best governance criteria, while MSCI considers the governance score second to last in its peer group.
If carbon footprint and governance are major factors in excluding companies from an ESG portfolio, what kinds of companies are favored for investment? Examining the top holdings in the largest ESG mutual funds and ETFs, we find that Alphabet (Google’s parent) and Meta Platforms (Facebook), as well as Visa and MasterCard are prominently featured. These companies have had their fair share of controversies. Would all ESG investors really have their social conscience assuaged by investing in companies that have been found to breach individual privacy as well as imposing exorbitant interest rates?
The popularity of ESG investing has led many companies to a practice of “greenwashing.” Organizations will market themselves as eco-friendly even though there are few, if any, environmental benefits. One airline claimed that its average carbon emissions were lower than its competitors on a transcontinental route even though the opposite was true. They justified their claim by measuring “emissions per passenger,” and on that statistic, they looked good because they flew larger planes with more compact seating. Some claims are as ludicrous as suggesting that there is no global warming if we change the measurements of current temperature from Fahrenheit to Celsius.
Many ESG fund providers claim that social investing can enhance returns. During particular periods, some funds with specific ESG mandates did outperform. In 2020, funds with no oil stocks did well as the price of oil plummeted during the COVID-19 pandemic and tech stocks soared. In 2021, however, oil stocks were some of the best performers. No credible studies show that ESG investing offers consistently superior long-term returns. Such funds are less diversified than broad-based index funds and can be riskier. They also have higher expense ratios, which tends to lower investment returns. When an ESG fund manager claims that your returns will be enhanced, it is more likely that it is the manager whose higher fees will be supplemented.
The most comprehensive survey of the returns from ESG investing was done by Sam Adams and Larry Swedroe. They find that while different studies come to contrasting conclusions, there is no unambiguous evidence that sustainable investing enhances long-run financial performance. They show that differences between short- and long-run returns can explain the different empirical results. A heightened demand for ESG-compliant investments can cause share prices to rise and thus enhance the returns of sustainable funds. But then the so-called “green” stocks will sell at higher valuation multiples and lower long-run required rates of return. Thus any short-term benefits will be realized at the expense of long-run performance. Investors who wish to invest sustainably should have reasonable expectations, including a willingness to accept lower long-run returns.
It is possible that a focus on ESG could influence corporate behavior. If ESG companies enjoy higher share prices and a lower cost of capital, then they will be incentivized to improve their ESG ratings. Thus a focus on sustainable investing can cause companies to behave in a more positive manner. ESG concerns by investors can have a positive effect in encouraging firms to take actions that have positive societal impacts, such as reducing their greenhouse gas emissions. There is no clear evidence, however, that action against unsustainable firms such as divestment has interfered with their ability to raise capital. It would also be a mistake to conclude that increasing investments going to sustainable companies will be sufficient to allow the country to meet its environmental goals. The most effective way to reduce an economy’s carbon intensity is to change the economic incentive to pollute. This could be accomplished with carbon taxation. Or the government could auction off a limited number of tradable pollution permits. Companies could reduce emissions to avoid the cost of a permit or buy permits if they faced especially high pollution-abatement costs. For those who question the morality of a government selling rights to pollute, there is a good answer: it’s better than giving such rights away.
There is clearly a strong demand by investors to ensure that their investments are consistent with their ethical principles. In addition to meeting financial goals, there are potential emotional benefits from investing. People want to align their investment strategies with their societal values. It would be unambiguously advantageous if they could push the firms in which they invest to improve societal outcomes while simultaneously enhancing their financial returns. But the broad-based investment products that advertise themselves as helping you to save the world and simultaneously increase your financial return do not deliver. The four ESG exchange-traded funds with the most assets under management trade under the ticker symbols ESGU, USSG, SUSL, and DSI. Only DSI has a long-run performance record. Over the ten-year period ending in 2022, the fund underperformed the broad-based index fund VTSAX. It is also far from clear that the holdings in these funds are all worthy of ESG merit. Moreover, such funds are less diversified and more expensive than pure index funds and may well underperform in the long run. In trying to do well by doing good, you may achieve neither objective.
So what should you do if you want to put at least some portion of your money where your mouth is and invest responsibly? I continue to believe that the core of your portfolio should consist of low-cost, broadly diversified index funds. Then you could add an allocation to a renewable energy fund or some other fund consistent with the particular themes that are important to you. But look carefully at the specific securities contained in the funds you buy to ensure that they are really consistent with your specific ethical goals. Due diligence is of overriding importance. And do not delude yourself into thinking that green investments will produce market-beating returns. It is not easy to be good.
Investors should certainly be aware of new methods of portfolio construction. High net worth investors might consider adding a multifactor smart beta offering or a risk-parity portfolio to the overall mix of their investments. Factor investing can potentially increase returns at the cost of assuming a somewhat different set of risk exposures than those of a standard broad-based index fund. And investors who are able to accept the added risks inherent in leverage might examine adding a risk-parity portfolio to their set of investments. All investors may wish to add a fund or funds dedicated to “environmentally sustainable” investments to their portfolios. Such offerings should only be considered, however, if they are low cost and if their potentially adverse tax effects can be offset in other parts of the overall portfolio. And I continue to believe that a broad-based total stock market index fund should be the core of everyone’s portfolio. Investors also need to be completely realistic in their expectations about what returns such funds will produce and what pitfalls are involved. None will substitute for a broad-based, well diversified, indexed core. Certainly, for investors who are starting to build an equity portfolio in planning for retirement, standard capitalization-weighted index funds are the appropriate first investments they should make.
* For example, the size portfolio holds the smallest stocks as a long position, while selling short the largest stocks.
† The precise calculation would need to include the cost of funding the leveraged position as, for example, borrowing at the risk-free rate. If the margin purchase was financed by borrowing at the risk-free rate, the return on the leveraged bond investment would be reduced to 9.9 percent. But even if she borrows the money and pays an interest rate at or somewhat higher than the short-term risk-free rate, the same advantage continues to hold. The desired leverage can also be established using derivative markets. The embedded cost of borrowing through derivatives is typically lower than the cash financing rate.
‡ Note that all portfolios to the left of RP represent a mixture of the investment in the risk-free rate and the RP portfolio.