
HOW GOOD IS FUNDAMENTAL ANALYSIS? THE EFFICIENT-MARKET HYPOTHESIS
How could I have been so mistaken as to have trusted the experts?
—John F. Kennedy after the Bay of Pigs fiasco
IN THE BEGINNING he was a statistician. He wore a white starched shirt and threadbare blue suit. He put on his green eyeshade, sat down at his desk, and recorded meticulously the historical financial information about the companies he followed. The result: writer’s cramp. But then a metamorphosis set in. He rose from his desk, bought blue button-down shirts and gray flannel suits, threw away his eyeshade, and began to make field trips to visit the companies that previously he had known only as a collection of financial statistics. His title now became security analyst.
As time went on, his salary and perks attracted the attention of his female cohorts, and they too donned suits. And just about everybody who was anybody was now flying first-class and talking money, money, money. The new generation was hip; suits were out, and Gucci shoes and Armani slacks were in. They even wore designer sweaters while on Zoom during the COVID-19 pandemic. They were so incredibly brilliant and knowledgeable that portfolio managers relied on their recommendations and Wall Street firms used them increasingly to cultivate investment banking clients. They were now equity research stars. Some, however, whispered unkindly that they were investment banking whores.
THE VIEWS FROM WALL STREET AND ACADEMIA
No matter what title, derogatory or otherwise, these individuals hold, the great majority are fundamentalists. Thus, studies casting doubt on the efficacy of technical analysis would not be considered surprising by most professionals. At heart, the Wall Street pros are fundamentalists. The really important question is whether fundamental analysis is any good.
Two opposing views have been taken about the efficacy of fundamental analysis. Wall Streeters feel that fundamental analysis is becoming more powerful all the time. The individual investor has scarcely a chance against the professional portfolio manager and a team of fundamental analysts.
Many in the academic community sneer at such pomposity. Some academicians have gone so far as to suggest that a blindfolded monkey throwing darts at the stock listings can select stocks with as much success as professional portfolio managers. They have argued that fund managers and their analysts can do no better at picking stocks than a rank amateur. This chapter will recount the major battle in an ongoing war between academics and market professionals, explain what is meant by “the efficient market hypothesis,” and tell you why it is important to your wallet.
ARE SECURITY ANALYSTS FUNDAMENTALLY CLAIRVOYANT?
Forecasting future earnings is the security analysts’ raison d’être. As Institutional Investor put it, “Earnings are the name of the game and always will be.”
To predict future directions, analysts generally start by looking at past wanderings. “A proven score of past performance in earnings growth is,” one analyst told me, “a most reliable indicator of future earnings growth.” If management is really skillful, there is no reason to think that it will lose its Midas touch in the future. If the same adroit management team remains at the helm, the course of future earnings growth should continue as it has in the past, or so the argument goes. While it sounds suspiciously like an argument used by technical analysts, fundamentalists pride themselves on the fact that it is based on specific, proven company performance.
Such thinking flunks in the academic world. Calculations of past earnings growth are no help in predicting future growth. If you had known the growth rates of all companies during, say, the 2000–2010 period, this would not have helped you at all in predicting what growth they would achieve in the 2010–2020 period. This startling result was first reported by British researchers for companies in the United Kingdom in an article charmingly titled “Higgledy Piggledy Growth.” Learned academicians at Princeton and Harvard applied the British study to U.S. companies—and, surprise, the same was true here!
For a while IBM was a glaring exception. But after the mid-1980s, IBM failed to continue its dependable growth pattern. Polaroid, Kodak, Nortel Networks, Xerox, and dozens of other firms chalked up consistent high growth rates until the roof fell in. I hope you remember not the current exceptions, but rather the rule: Many in Wall Street refuse to accept the fact that no reliable pattern can be discerned from past records to aid the analyst in predicting future growth. Even during the boom years of the 1990s, only one in eight large companies managed to achieve consistent yearly growth. And not even one continued to enjoy growth into the first decades of the new millennium. Analysts can’t predict consistent long-run growth, because it does not exist.
A good analyst will argue, however, that there’s much more to predicting than just examining the past record. Some will even admit that the past record is not a perfect measurement but that skilled portfolio analysts can do much better. Unfortunately, the careful estimates of security analysts (based on industry studies, plant visits, etc.) do little better than those that would be obtained by simple extrapolation of past trends, which we have already seen are no help at all. Indeed, when compared with actual earnings growth rates, the growth estimates of security analysts were actually worse than the predictions from several naive forecasting models. These findings have been confirmed in several academic studies. Financial forecasting appears to be a science that makes astrology look respectable.
Amid these accusations is a deadly serious message: Security analysts have enormous difficulty in performing their basic function of forecasting company earnings prospects. Investors who put blind faith in such forecasts in making their investment selections are in for some rude disappointments.
WHY THE CRYSTAL BALL IS CLOUDED
It is always somewhat disturbing to learn that highly trained and well-paid professionals may not be terribly skillful at their calling. Unfortunately, this is hardly unusual. Similar types of findings exist for most groups of professionals. There is a classic example in medicine. At a time when tonsillectomies were very fashionable, the American Child Health Association surveyed a group of 1,000 children, eleven years of age, from the public schools of New York City, and found that 611 of these had had their tonsils removed. The remaining 389 were then examined by a group of physicians, who selected 174 of these for tonsillectomies and declared that the rest had no tonsil problem. The remaining 215 were reexamined by another group of doctors, who recommended 99 of these for tonsillectomies. When the 116 “healthy” children were examined a third time, a similar percentage were told their tonsils had to be removed. After three examinations, only 65 children remained who had not been recommended for tonsillectomies. These remaining children were not examined further, because the supply of examining physicians ran out.
Numerous studies have shown similar results. Radiologists have failed to recognize the presence of lung disease in about 30 percent of the X-ray plates they read, despite the clear presence of the disease on the X-ray film. Another experiment proved that professional staffs in psychiatric hospitals could not tell the sane from the insane. The point is that we should not take for granted the reliability and accuracy of any judge, no matter how expert. When one considers the low reliability of so many kinds of judgments, it does not seem too surprising that security analysts, with their particularly difficult forecasting job, should be no exception.
There are, I believe, five factors that help explain why security analysts have such difficulty in predicting the future. These are (1) the influence of random events, (2) the production of dubious reported earnings through “creative” accounting procedures, (3) errors made by the analysts themselves, (4) the loss of the best analysts to the sales desk or to portfolio management, and (5) the conflicts of interest facing security analysts at firms with large investment banking operations. Each factor deserves some discussion.
1. The Influence of Random Events
Many of the most important changes that affect the basic prospects for corporate earnings are essentially random, that is, unpredictable. The utility industry is one of the most stable and dependable groups of companies. But, in fact, many important unpredictable events made earnings even for this industry enormously difficult to forecast. Unexpected unfavorable rulings of state public utility commissions and unpredictable increases in fuel costs often made it impossible for utilities to translate rapid growth in demand into higher profits.
Forecasting problems have been even more difficult in other industries. As we saw in chapter 4, growth forecasts made in early 2000 for a wide variety of high-tech and telecom companies were egregiously wrong. U.S. government budgetary, contract, legal, and regulatory decisions can have enormous implications for the fortunes of individual companies. So can the incapacitation of key members of management, the discovery of a major new product, a major oil spill, terrorist attacks, the entry of new competitors, price wars, and natural disasters such as floods and hurricanes. The biotech industry is notoriously difficult to forecast. Potential blockbuster new drugs often fail Phase III trials because of failure to improve mortality or because of unexpected toxic side effects. The examples of unpredictable events affecting earnings are endless.
2. The Production of Dubious Reported Earnings through “Creative” Accounting Procedures
A firm’s income statement may be likened to a bikini—what it reveals is interesting but what it conceals is vital. Enron, one of the most ingeniously corrupt companies I have come across, led the beauty parade in this regard. Alas, Enron was far from unique. During the great bull market of the late 1990s, companies increasingly used aggressive fictions to report the soaring sales and earnings needed to propel their stock prices upward.
In the hit musical The Producers, Leo Bloom decides one can make more money from a flop than from a hit. He says, “It’s all a matter of creative accounting.” Bloom’s client Max Bialystock sees the potential immediately. Max fleeces buckets of money from rich widows to finance a Broadway musical, Springtime for Hitler. He hopes for a total flop, so that no one will ask questions about where the money went.
Actually, Bloom doesn’t begin to match the tricks that have been used by companies to pump up earnings and to fool investors and security analysts alike. In chapter 3, I described how Barry Minkow’s late 1980s carpet-cleaning empire, ZZZZ Best, was built on a mosaic of phony credit card billings and fictitious contracts. But accounting abuses appear to have become even more frequent during the twenty-first century. Failing dot.coms, high-tech leaders, and even old-economy blue chips all tried to hype earnings and mislead the investment community.
Here’s but a small number of examples of how companies have often stretched accounting rules like taffy to mislead analysts and the public as to the true state of their operations.
- In September 2001, Enron and Qwest needed to show that their revenues and profits were still growing rapidly. They figured out a great way to make their statements look as if business was proceeding well. They swapped fiber-optic network capacity at an exaggerated value of $500 million, and each company recorded the transaction as a sale. This inflated profits and masked a deteriorating position for both companies. Qwest already had a surfeit of capacity and, with an enormous glut of fiber in the market, the valuation put on the trade had no justification.
- Motorola, Lucent, and Nortel all boosted sales and earnings by lending large amounts to their customers. Many of these accounts became uncollectable and had to be written off later.
- Xerox boosted its profits in the short term by allowing its overseas units in Europe and Latin America, as well as in Canada, to book as one-time revenue all the cash to be paid over several years for long-term copier leases.
- Then there is the pension gambit. Many companies estimated that their pension plans were overfunded, and therefore they eliminated the companies’ contribution to the plans, thus boosting profits. When the market suffered a sharp decline in 2007 and 2008, the companies discovered that their plans were actually underfunded and what investors assumed were sustainable profits turned out to be transitory.
A major problem that the analyst has in interpreting current and projecting future earnings is the tendency of companies to report so-called pro forma or adjusted earnings as opposed to actual earnings computed in accordance with generally accepted accounting principles. In pro forma earnings, companies decide to ignore certain costs that are considered unusual; in fact, no rules or guidelines exist. Adjusted earnings are often called “earnings before all the bad stuff,” and give firms license to exclude any expenses they deem to be “special,” “extraordinary,” and “non-recurring.” Depending on what expenses are considered to be ignored and what revenues are recognized, companies can report a substantial overstatement of earnings. Small wonder that security analysts have extraordinary difficulty estimating what future earnings are likely to be.
3. Errors Made by the Analysts Themselves
To be perfectly blunt, many security analysts are not particularly perceptive or critical, and they often make egregious errors. I found this out early in the game as a young Wall Street trainee. I tried to duplicate some analytic work done by Louie, a metals specialist. Louie had figured that for each 10¢ increase in the price of copper, a particular copper producer’s earnings would increase by $1 per share. Because he expected a $3 increase in the price of copper, he reasoned that this particular stock was “an unusually attractive purchase candidate.”
In redoing the calculation, I found that Louie had misplaced a decimal point. A 10¢ increase in the price of copper would increase earnings by 10¢, not by $1. When I pointed this out to Louie (assuming he would put out a correction immediately), he simply shrugged his shoulders and declared, “Well, the recommendation sounds more convincing if we leave the report as is.” Attention to detail was not Louie’s forte.
Louie’s lack of attention to detail revealed his lack of understanding of the industry he was covering. But he was not unique. In an article written for Barron’s, Dr. Lloyd Krieger, a plastic surgeon, examined some reports written by biotech analysts. Krieger paid particular attention to analysts’ coverage of those biotech companies that were creating artificial skin for use in the treatment of chronic wounds and burns—a field in which he had considerable expertise. He found the security analysts’ diagnoses of stocks far wide of the mark. First, he added the assumptions made of the market share predicted for competing companies. The predicted shares of the five biotech companies competing in the market for artificial skin added up to well over 100 percent. Moreover, the analysts’ prediction of the absolute size of the potential market bore little relationship to data on the number of actual burn victims, even though accurate data were easily available. Moreover, in examining the various analyst reports on the companies, Dr. Krieger concluded, “They clearly did not understand the industry.” One is reminded of words attributed to the legendary baseball manager Casey Stengel: “Can’t anybody here play this game?”
Many analysts emulate Louie. Generally too lazy to make their own earnings projections, they prefer to copy the forecasts of other analysts or to swallow the “guidance” released by corporate managements without even chewing. Then it’s very easy to know whom to blame if something goes wrong. And it’s much easier to be wrong when your professional colleagues all agree with you. As Keynes put it, “Worldly wisdom teaches that it is better for reputation to fail conventionally than to succeed unconventionally.”
Security analysts continue to make devastating forecasting errors. Apollo Group, owner of the University of Phoenix, was a Wall Street darling in early 2012. Analysts gushed at the huge earnings potential for this leader in the for-profit college industry and projected large investor returns. Reports of high student loan defaults, low graduation rates, and predatory recruiting practices were ignored. But such problems were confirmed by a widely distributed congressional report. The bad publicity and resulting new government regulations led to a sharp drop in enrollments and an even sharper 80 percent drop in Apollo’s stock price.
The fallibility of security analysts’ forecasts is well illustrated by their failure to evaluate General Electric properly during the boom in industrial stocks in 2017. GE is an iconic U.S. company. It was one of the original members of the Dow Jones Industrial Average and for years in the late twentieth century was considered one of the country’s greatest growth stocks.
In late 2016 most Wall Street analysts rated GE stock as a “strong buy.” The company had shed most of its finance unit. “The problems from the financial crisis that wreaked havoc on the highly levered financial unit are now behind them,” one analyst noted, and “future growth was assured.” Earnings would no longer be paralyzed by poor results from the divested businesses. The firm was now “simpler and nimbler” and flush with cash. Analysts applauded the new focus with 90 percent of GE’s business now concentrated on high-tech industrial products.
The economic environment in early 2017 contributed to the bullish case. The economic expansion was poised to accelerate, and GE was on track to become “the world’s largest digital industrial company.” The stock, down from its historic high in the 50s, was now languishing in the low 30s. The icing on the cake was an attractive dividend yield of over 3 percent. “The stock represents superlative value for conservative investors.”
The future did not turn out as anticipated. The company had become a jack-of-all trades but master of none, with no real showcase business that could claim excellence. Instead of rising, earnings continued to decline. The CEO was replaced and the “secure” dividend was cut in half. To add insult to injury, the company was forced to make an accounting restatement that reduced its historical earnings even further. In June 2018 GE was kicked out of the Dow Jones average, and the stock was selling at $13 per share. In 2021 GE had a reverse stock split giving one new share for each eight shares held. The new GE sold for over $100 per share, but that was still $13 adjusted. So much for analysts’ forecasts.
I do not mean to imply that Wall Street analysts are incompetent and simply parrot back what managements tell them. But I do imply that the average analyst is just that—a well-paid and usually highly intelligent person who has an extraordinarily difficult job and does it in a rather mediocre fashion. Analysts are often misguided, sometimes sloppy, and susceptible to the same pressures as other people. In short, they are very human beings.
4. The Loss of the Best Analysts to the Sales Desk, to Portfolio Management, or to Hedge Funds
My fourth argument against the profession is a paradoxical one: Many of the best security analysts are not paid to analyze securities. They are often high-powered institutional salespeople, or are promoted to the lucrative position of portfolio manager.
Investment firms known for their research prowess often send a security analyst to chaperone the regular salesperson on a call to a financial institution. Institutional investors like to hear about a new investment idea right from the horse’s mouth, so the regular salesperson usually sits back and lets the analyst do the talking. The most articulate analysts find that their time is spent with institutional clients, not with financial reports.
During the 2000s, many analysts were seduced away from research to take highly compensated positions in portfolio management for hedge funds or private equity funds. It’s far more exciting, prestigious, and remunerative to “run money” in the line position of portfolio manager than to advise in the staff position of security analyst. Small wonder that many of the best-respected security analysts do not remain long in their jobs.
5. The Conflicts of Interest between Research and Investment Banking Departments
The analyst’s goal is to ring as many cash registers as possible, and the fullest cash registers for the major brokers are to be found in the investment banking division. It wasn’t always that way. In the 1970s, before the demise of fixed commissions and the introduction of “discount” brokerage firms, the retail brokerage operation paid the tab and analysts were really working for their customers—the retail and institutional investors. But that profit center faded in importance with commissions that were driven to zero, and the only gold mines left were trading profits and the underwriting of new issues for new or existing firms (where fees can run to hundreds of millions of dollars) and advising firms on borrowing facilities, restructuring, acquisitions, etc. And so it came to pass that “ringing the cash registers” meant helping the firm obtain and nurture banking clients. And that’s how the conflicts arose. Analysts’ salaries and bonuses were determined in part by their role in assisting the underwriting department. When such business relationships existed, analysts became nothing more than tools of the investment banking division.
One indication of the tight relationship between security analysts and their investment banking operations has been the traditional paucity of sell recommendations. There has always been some bias in the ratio of buy to sell recommendations, since analysts do not want to offend the companies they cover. But as investment banking revenues became a major source of profits for the major brokerage firms, research analysts were increasingly paid to be bullish rather than accurate. In one celebrated incident, an analyst who had the chutzpah to recommend that Trump’s Taj Mahal bonds be sold because they were unlikely to pay their interest was summarily fired by his firm after threats of legal retaliation from “The Donald” himself. (Later, the bonds did default.) Small wonder that most analysts have purged their prose of negative comments that might give offense to current or prospective investment banking clients. During the Internet bubble, the ratio of buy to sell recommendations climbed to 100 to 1.
To be sure, when an analyst says “buy” he may mean “hold,” and when he says “hold” he probably means this as a euphemism for “dump this piece of crap as soon as possible.” But investors should not need a course in deconstruction semantics to understand the recommendations, and most individual investors sadly took the analysts at their word during the Internet bubble.
There is convincing evidence that analyst recommendations are tainted by the very profitable investment banking relationships of the brokerage firms. Several studies have assessed the accuracy of analysts’ stock selections. Brad Barber of the University of California studied the performance of the “strong buy” recommendations of Wall Street analysts and found it nothing short of “disastrous.” Indeed, the analysts’ strong buy recommendations underperformed the market as a whole by 3 percent per month, while their sell recommendations outperformed the markets by 3.8 percent per month. Even worse, researchers at Dartmouth and Cornell found that stock recommendations of Wall Street firms without investment banking relationships did much better than the recommendations of brokerage firms that were involved in profitable investment banking relationships with the companies they covered. A study from Investors.com found that investors lost over 50 percent when they followed the advice of an analyst employed by a Wall Street firm that managed or co-managed the initial public offering of the recommended stock. Research analysts were basically paid to tout the stocks of the firm’s underwriting clients. And analysts lick the hands that feed them.
The situation today is somewhat improved. Outright “sell” recommendations have become more common, although the bias to “buy” advice remains. But the Sarbanes-Oxley legislation, which followed the scandals associated with the Internet bubble, made the job of the analyst more difficult by limiting the extent to which corporate financial officers could talk to Wall Street analysts. The SEC has promulgated a policy of “fair disclosure,” whereby any relevant company information must be made public immediately and thus disclosed to the whole market. While such a policy can help make the stock market even more efficient, many disgruntled security analysts dubbed the situation as one of “no disclosure.” Security analysts no longer had early access to privileged information. Thus, there is no reason to believe that the recommendations of analysts will improve in the future.
Conflicts of interest and analysts’ lack of independent questioning did not disappear after Sarbanes-Oxley. In 2010, immediately following announcement of the explosion and oil spill from British Petroleum’s Deepwater Horizon drilling platform, BP’s stock fell 10 points, from $60 to $50 per share. Yet the nearly unanimous verdict of the Wall Street analyst community was that the stock price had overreacted and that BP was a “screaming buy.” As one analyst put it, the decline was “disproportionate to the likely costs to the company (estimated to be $450 million), even assuming damages can be claimed.” Of the thirty-four analysts who covered the stock, twenty-seven rated it a “buy.” The other seven had “hold” ratings. There was not a single “sell” recommendation. And even the hyperactive TV host Jim Cramer told his viewers that his charitable trust was purchasing BP shares. The stock eventually dropped into the 20s, a loss of almost $100 billion in market value. (By January 2018, BP estimated that the costs of the spill had ballooned to $65 billion and were continuing to rise.)
The pervasiveness of the error indicates that conflicts of interest have not been eliminated. BP is a major issuer of securities that generate large underwriting fees for Wall Street. Analysts are still influenced by the fear that very negative comments about a company could result in a loss of underwriting business in the future.
Finally, the ability of professional fund managers to make correct decisions in moving money from cash or bonds to equities on the basis of their forecasts of economic conditions has been egregiously poor. Peaks in mutual-fund cash positions have generally coincided with market troughs. Conversely, cash positions were invariably low when the market was at its highs.
DO SECURITY ANALYSTS PICK WINNERS? THE PERFORMANCE OF THE MUTUAL FUNDS
I can almost hear the chorus in the background as I write these words. It goes something like this: The real test of the analyst lies in the performance of the stocks he recommends. Maybe “Sloppy Louie,” the copper analyst, did mess up his earnings forecast with a misplaced decimal point, but if the stocks he recommended made money for his clients, his lack of attention to detail can surely be forgiven. “Analyze investment performance,” the chorus is saying, “not earnings forecasts.”
Fortunately, the records of one group of professionals—the mutual funds—are publicly available. Better still for my argument, the men and women at the funds are some of the best analysts and portfolio managers in the business. As one investment manager recently put it, “It will take many years before the general level of competence rises enough to overshadow the startling advantage of today’s aggressive investment manager.”
Statements like these were just too tempting to the lofty-minded in the academic world. Given the wealth of available data, the time available to conduct such research, and the overwhelming desire to prove academic superiority in such matters, it was only natural that academia would zero in on mutual-fund performance.
Again, the evidence from several studies is remarkably uniform. Investors have done no better with the average mutual fund than they could have done by purchasing and holding an unmanaged broad stock index. In other words, over long periods of time, mutual-fund portfolios have not outperformed the market. Although some funds may have very good records for certain time periods, superior performance is not consistent, and there is no way to predict how funds will perform in any given future period.
The table below shows the returns from the average equity mutual fund over a twenty-year period, to December 31, 2021. As a comparison, the Standard & Poor’s 500 Index is used to represent the broad market. Similar results have been found for different time periods and for pension funds as well as other investors. Simply buying and holding the stocks in a broad market index is a strategy that is very hard for the professional portfolio manager to beat.
MUTUAL FUNDS VS. THE MARKET INDEX
|
20 years to December 31, 2021 |
S&P Composite 1500 |
9.68% |
Average Equity Fund |
8.70% |
Index Advantage (percentage points) |
0.98% |
Sources: SPIVA U.S. Scorecard 2022.
In addition to the scientific evidence that has been accumulated, several less formal tests have verified this finding. For example, in the early 1990s, the Wall Street Journal started a dartboard contest in which each month the selections of four experts were pitted against the selections of four darts. The Journal kindly let me throw the darts for the first contest. By the early 2000s, the experts appeared to be somewhat ahead of the darts. If, however, the performance of the experts was measured from the day their selections and their attendant publicity was announced in the Journal (rather than from the preceding day), the darts were actually slightly ahead. Does this mean that the wrist is mightier than the brain? Perhaps not, but I think Forbes magazine raised a very valid question when one journalist concluded, “It would seem that a combination of luck and sloth beats brains.”
How can this be? Every year one can read the performance rankings of mutual funds. These always show many funds beating the averages—some by significant amounts. The problem is that there is no consistency to performance. Just as past earnings growth cannot predict future earnings, neither can past fund performance predict future results. Fund managements are also subject to random events: They may grow fat, become lazy, or break up. An investment approach that works very well for one period can easily turn sour the next. One is tempted to conclude that a very important factor in determining performance ranking is our old friend Lady Luck.
This conclusion is not a recent one. It has held throughout the past fifty years, a period of great change in the market and in the percentage of the general public holding stocks. Again and again yesterday’s star fund has proven to be today’s disaster. During the late 1960s, the go-go funds with their youthful gunslingers turned in spectacular results, and their fund managers were written up like sports celebrities. But when the next bear market hit from 1969 through 1976, it was fly now, pay later. The top funds of 1968 had a perfectly disastrous subsequent performance.
Similar results continued to hold in subsequent decades. There has been no consistency in superior performance. The top 20 mutual funds of the 1970s had well below average performances in the 1980s with many of the very best funds of the ’70s ranking close to the bottom of the fund ranking tables in the next decade. Similarly, the best funds of the ’80s had terrible results in the ’90s, and the top funds of the ’90s, which had loaded up on hot Internet stocks, had a disastrous record in the first decades of the 2000s after the bubble deflated. Cathie Wood’s ARK Innovation Fund more than doubled its value in 2020 by concentrating on companies involved in disruptive innovation. That spectacular performance was followed in 2021 by a sharp decline. While the S&P 500 posted a positive 27 percent return in 2021, ARK lost 23.5 percent of its value. Wood likes to argue that her investors still come out ahead, given the big gains of 2020. In fact, very little money was invested in the fund prior to its eye-catching performance in 2020. It was only after ARK’s dazzling returns that many new investors came into the fund, and those investors who were chasing the performance of the high 2020 returns actually lost money. Bloomberg estimated as early as March 2022 the average cost of holding the ARK Innovation ETF was over 50 percent greater than its market price.
Investors learned that making 100 percent one year and losing 50 percent the next left them exactly where they started out. To be sure, some funds have recorded above-average returns for two decades in a row. But they are few and far between, and their numbers are no greater than might be expected according to the laws of chance.
Perhaps the laws of chance should be illustrated. Let’s engage in a coin-flipping contest. Those who can consistently flip heads will be declared winners. The contest begins and 1,000 contestants flip coins. Just as would be expected by chance, 500 of them flip heads and these winners are allowed to advance to the second stage of the contest and flip again. As might be expected, 250 flip heads. Operating under the laws of chance, there will be 125 winners in the third round, 63 in the fourth, 32 in the fifth, 16 in the sixth, and 8 in the seventh.
By this time, crowds start to gather to witness the surprising ability of these expert coin-flippers. The winners are overwhelmed with adulation. They are celebrated as geniuses in the art of coin-flipping, their biographies are written, and people urgently seek their advice. After all, there were 1,000 contestants and only 8 could consistently flip heads. The game continues and some contestants eventually flip heads nine and ten times in a row.* The point of this analogy is not to indicate that investment-fund managers can or should make their decisions by flipping coins, but that the laws of chance do operate and that they can explain some amazing success stories.
It is the nature of an average that some investors will beat it. With large numbers of investment managers, chance will—and does—explain some extraordinary performances. The great publicity given occasional success reminds me of the story of the doctor who claimed he had developed a cure for cancer in chickens. He proudly announced that in 33 percent of the cases remarkable improvement was noted. In another one-third of the cases, he admitted, there seemed to be no change in condition. He then rather sheepishly added, “And I’m afraid the third chicken ran away.”
The Wall Street Journal did an interesting story in 2009 showing how fleeting extraordinary investment performance is likely to be. The paper noted that fourteen mutual funds had beaten the S&P for nine consecutive years through 2007. But only one continued that feat in 2008, as is shown in the table below. It is simply impossible to count on any fund or any investment manager to consistently beat the market—even when the past record suggests some unusual investment skill.
IT’S DOWN TO ONE
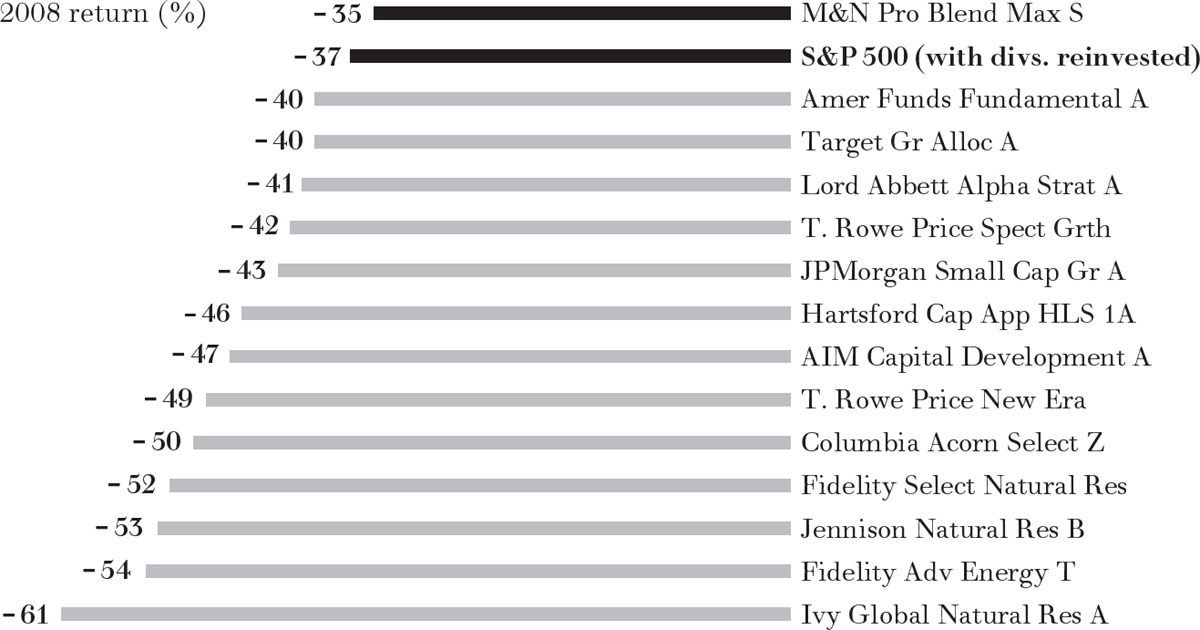
Source: The Wall Street Journal, January 5, 2009.
The evidence in favor of index investing grows stronger over time. Standard & Poor’s publishes reports each year comparing all actively managed funds with various Standard & Poor’s stock indexes. The 2022 report is shown below. When one looks at a twenty-year period, around 90 percent of active managers are outperformed by their benchmark indexes. And each year’s report is much the same. Every time I do a revision of this book, the results are similar. The index performance is not mediocre—it exceeds the results achieved by the typical active manager. And the result holds for big stocks and small, domestic as well as international. And it works for the bond market as well as the stock market. Index investing is smart investing.
STANDARD & POOR’S INDEXES VERSUS ACTIVE FUNDS
Percentage of Active Funds Outperformed by Benchmarks |
|||
|
One Year |
Five Years |
Twenty Years |
All Large-Cap Funds vs. S&P 500 |
85.1 |
67.9 |
94.1 |
All Small-Cap Funds vs. S&P Small Cap 600 |
70.5 |
62.5 |
93.6 |
Global Funds vs. S&P Global 1200 |
84.1 |
69.2 |
85.3 |
Emerging-Market Funds vs. S&P IFCI Composite |
64.6 |
74.7 |
93.4 |
Source: S&P SPIVA Report—2022.
I am not suggesting that it is impossible to beat the market. But it is highly unlikely. An interesting way to demonstrate this result is to examine the records of all the equity mutual funds that were in existence in 1970 (when I first began work on this book) and follow their performance through 2017. This is the experiment done in 2018 and shown in the exhibit on page 181.
In 1970, 358 equity mutual funds existed. (Today there are thousands.) We can measure the long-term records of only 78 of those original funds because 280 of them no longer existed in 2017. Thus, the data in the exhibit suffer from “survivorship bias.” The surviving funds are the ones with the best records. There is a nasty secret in the mutual-fund industry that if you have a poorly performing fund, it does not reflect well on the mutual-fund complex. So the poorly performing funds tend to get merged into funds with better records, thereby killing off their embarrassing records. The surviving funds are the better-performing ones. But even with this survivorship bias, observe how few of the original funds actually had superior records. You can count on the fingers of one hand the number of funds from the original 358 that actually beat the market index by 2 percentage points or more. Only 11 of the funds (3 percent) did better by 1 percent or more.
THE ODDS OF SUCCESS: RETURNS OF SURVIVING FUNDS
Mutual Funds 1970 to 2017—Compared with S&P 500 returns
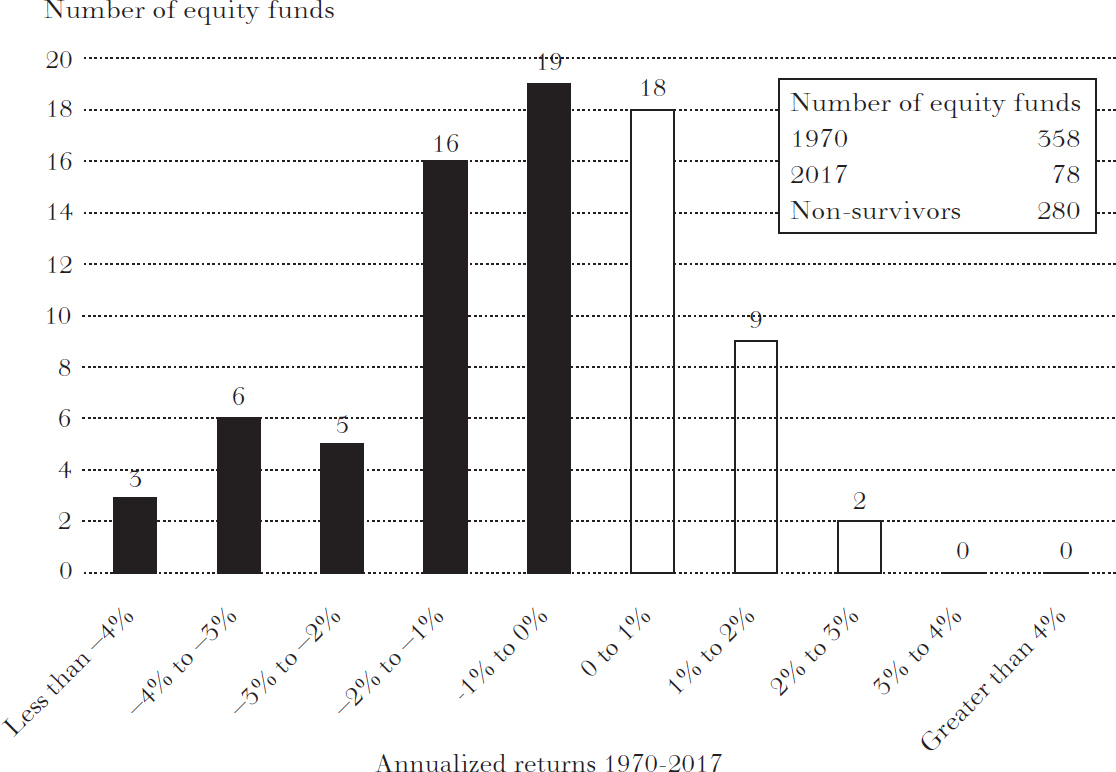
Source: Vanguard and Lipper.
The point is that it is highly unlikely you can beat the market. It is so rare that it’s like looking for a needle in a haystack. A strategy far more likely to be optimal is to buy the haystack itself: that is, buy an index fund—a fund that simply buys and holds all the stocks in a broad stock-market index. Fortunately, more and more investors are doing just that. Now more money invested by individuals and institutions is invested in index funds and indexed ETFs than in actively managed funds. And that percentage continues to grow each year.
Although the preceding discussion has focused on mutual and exchanged-traded funds, it should not be assumed that these funds are the worst of the whole lot of investment managers. In fact, the mutual funds have had a somewhat better performance record than many other professional investors. The records of life insurance companies, property and casualty insurance companies, pension funds, foundations, state and local trust funds, personal trusts administered by banks, and individual discretionary accounts handled by investment advisers have all been studied. No sizable differences in the investment performance of common-stock portfolios exist among these professional investors or between these groups and the market as a whole. Exceptions are very rare. The investment performance of professionally managed portfolios as a group has been worse than that of a broad-based index.
THE SEMI-STRONG AND STRONG FORMS OF THE EFFICIENT-MARKET HYPOTHESIS (EMH)
The academic community has rendered its judgment. Fundamental analysis is no better than technical analysis in enabling investors to capture above-average returns. Nevertheless, given its propensity for splitting hairs, the academic community soon fell to quarreling over the precise definition of fundamental information. Some said it was what is known now; others said it extended to the hereafter. It was at this point that what began as the strong form of the efficient-market hypothesis split into two. The “semi-strong” form says that no public information will help the analyst select undervalued securities. The argument here is that the structure of market prices already takes into account any public information that may be contained in balance sheets, income statements, dividends, and so forth; professional analyses of these data will be useless. The “strong” form says that absolutely nothing that is known or even knowable about a company will benefit the fundamental analyst. According to the strong form of the theory, not even “inside” information can help the investors.
The strong form of the EMH is obviously an overstatement. It does not admit the possibility of gaining from inside information. Nathan Rothschild made millions in the market when his carrier pigeons brought him the first news of Wellington’s victory at Waterloo before other traders were aware of the victory. But today, the information superhighway carries news far more swiftly than carrier pigeons. And Regulation FD (Fair Disclosure) requires companies to make prompt public announcements of any material news items that may affect the price of their stock. Moreover, insiders who do profit from trading on the basis of nonpublic information are breaking the law. The Nobel laureate Paul Samuelson summed up the situation as follows:
If intelligent people are constantly shopping around for good value, selling those stocks they think will turn out to be overvalued and buying those they expect are now undervalued, the result of this action by intelligent investors will be to have existing stock prices already have discounted in them an allowance for their future prospects. Hence, to the passive investor, who does not himself search for under- and overvalued situations, there will be presented a pattern of stock prices that makes one stock about as good or bad a buy as another. To that passive investor, chance alone would be as good a method of selection as anything else.
This is a statement of the EMH—the efficient-market hypothesis. The “narrow” (weak) form of the EMH says that technical analysis—looking at past stock prices—cannot help investors. Prices move from period to period very much like a random walk. The “broad” (semi-strong and strong) forms state that fundamental analysis is not helpful either. All that is known concerning the expected growth of the company’s earnings and dividends, all of the possible favorable and unfavorable developments affecting the company that might be studied by the fundamental analyst, is already reflected in the price of the company’s stock. Thus, purchasing a fund holding all the stocks in a broad-based index will produce a portfolio that can be expected to do as well as any managed by professional security analysts.
The efficient-market hypothesis does not imply, as some critics have proclaimed, that stock prices are always correct. In fact, stock prices are always wrong. What EMH implies is that no one knows for sure if stock prices are too high or too low. Nor does EMH state that stock prices move aimlessly and erratically and are insensitive to changes in fundamental information. On the contrary, the reason prices move randomly is just the opposite. The market is so efficient—prices move so quickly when information arises—that no individual investor can buy or sell fast enough to benefit. And real news develops randomly, that is, unpredictably. It cannot be predicted by studying either past technical or fundamental information.
Even the legendary Benjamin Graham, heralded as the father of fundamental security analysis, reluctantly came to the conclusion that fundamental security analysis could no longer be counted on to produce superior investment returns. Shortly before he died in 1976, he was quoted in an interview in the Financial Analysts Journal as saying, “I am no longer an advocate of elaborate techniques of security analysis in order to find superior value opportunities. This was a rewarding activity, say, 40 years ago, when Graham and Dodd was first published; but the situation has changed. . . . [Today] I doubt whether such extensive efforts will generate sufficiently superior selections to justify their cost. . . . I’m on the side of the ‘efficient market’ school of thought.” And Peter Lynch, just after he retired from managing the Magellan Fund, as well as the legendary Warren Buffett, admitted that most investors would be better off in an index fund rather than investing in an actively managed equity mutual fund. Buffett has stipulated in his will that cash from his estate be invested solely in index funds.
*If we had let the losers continue to play (as mutual-fund managers do, even after a bad year), we would have found several more contestants who flipped eight or nine heads out of ten and were therefore regarded as expert coin-flippers.