
TECHNICAL ANALYSIS AND THE RANDOM-WALK THEORY
Things are seldom what they seem. Skim milk masquerades as cream.
— Gilbert and Sullivan, H.M.S. Pinafore
NOT EARNINGS, NOR dividends, nor risk, nor gloom of high interest rates stay the technicians from their assigned task: studying the price movements of stocks. Such single-minded devotion to numbers has yielded the most colorful theories and folk language of Wall Street: “Hold the winners, sell the losers,” “Switch into the strong stocks,” “Sell this issue, it’s acting poorly,” “Don’t fight the tape.” All are popular prescriptions of technical analysts. They build their strategies upon dreams of castles in the air and expect their tools to tell them which castle is being built and how to get in on the ground floor. The question is: Do they work?
HOLES IN THEIR SHOES AND AMBIGUITY IN THEIR FORECASTS
University professors are sometimes asked by their students, “If you’re so smart, why aren’t you rich?” The question usually rankles professors, who think of themselves as passing up worldly riches to engage in such an obviously socially useful occupation as teaching. The same question is more appropriately addressed to technicians. Since the whole point of technical analysis is to make money, one would expect that those who preach it should practice it successfully.
On close examination, technicians are often seen with holes in their shoes and frayed shirt collars. I personally have never known a successful technician, but I have seen the wrecks of several unsuccessful ones. Curiously, however, the broke technician is never apologetic. If you commit the social error of asking him why he is broke, he will tell you quite ingenuously that he made the all-too-human error of not believing his own charts. To my great embarrassment, I once choked conspicuously at the dinner table when a chartist made such a comment. I have since made it a rule never to eat with a chartist. It’s bad for digestion.
Although technicians might not get rich following their own advice, their store of words is precious indeed. Consider this advice offered by one technical service:
The market’s rise after a period of reaccumulation is a bullish sign. Nevertheless, fulcrum characteristics are not yet clearly present and a resistance area exists 40 points higher in the Dow, so it is clearly premature to say the next leg of the bull market is up. If, in the coming weeks, a test of the lows holds and the market breaks out of its flag, a further rise would be indicated. Should the lows be violated, a continuation of the intermediate term downtrend is called for. In view of the current situation, it is a distinct possibility that traders will sit in the wings awaiting a clearer delineation of the trend and the market will move in a narrow trading range.
If you ask me what this means, I cannot tell you, but I think the technician probably had the following in mind: “If the market does not go up or go down, it will remain unchanged.” Even the weather forecaster can do better than that.
Obviously, I’m biased. This is not only a personal bias but a professional one as well. Technical analysis is anathema to much of the academic world. We love to pick on it. We have two main reasons: (1) after paying transactions costs and taxes, the method does not do better than a buy-and-hold strategy; and (2) it’s easy to pick on. And while it may seem a bit unfair, just remember that it’s your money we’re trying to save.
Although the computer perhaps enhanced the standing of the technician for a time, and while charting services are widely available on the Internet, technology has ultimately proved to be the technician’s undoing. Just as fast as he (or she) creates charts to show where the market is going, the academic gets busy constructing charts showing where the technician has been. Because it’s so easy to test all the technical trading rules on the computer, it has become a favorite pastime for academics to see whether they really work.
IS THERE MOMENTUM IN THE STOCK MARKET?
The technician believes that knowledge of a stock’s past behavior can help predict its probable future behavior. In other words, the sequence of price changes before any given day is important in predicting the price change for that day. This might be called “the wallpaper principle.” The technical analyst tries to predict future stock prices just as we might predict that the pattern of wallpaper behind the mirror is the same as the pattern above the mirror. The basic premise is that there are repeatable patterns in space and time.
Chartists believe momentum exists in the market. Supposedly, stocks that have been rising will continue to do so, and those that begin falling will go on sinking. Investors should therefore buy stocks that start rising and continue to hold their strong stocks. Should the stock begin to fall, investors are advised to sell.
These technical rules have been tested exhaustively by using stock-price data as far back as the beginning of the twentieth century. The results reveal that past movements in stock prices cannot be used reliably to foretell future movements. The stock market has little, if any, memory. While the market does exhibit momentum, it does not occur dependably, and there are frequent momentum crashes. There is not enough persistence in stock prices to make trend-following strategies consistently profitable. Although momentum exists in the stock market, described more fully in chapter 11, any investor who pays transactions costs and taxes is unlikely to employ a trading strategy to benefit from it.
Economists have also examined the technician’s thesis that there are often sequences of price changes in the same direction over several days (or several weeks or months). Stocks are likened to fullbacks who, once having gained some momentum, can be expected to carry on for a long gain. It turns out that this is simply not the case. Sometimes one gets positive price changes (rising prices) for several days in a row; but sometimes when you are flipping a fair coin you also get a long string of “heads” in a row, and you get sequences of positive (or negative) price changes no more frequently than you can expect random sequences of heads or tails in a row. What are often called “persistent patterns” in the stock market occur no more frequently than the runs of luck in the fortunes of any gambler. This is what economists mean when they say that stock prices behave very much like a random walk.
JUST WHAT EXACTLY IS A RANDOM WALK?
To many people this appears to be errant nonsense. Even the most casual reader of the financial pages can easily spot patterns in the market. For example, look at the stock chart on page 145.
The chart seems to display obvious patterns. After an initial rise the stock turned down, and then headed persistently downhill. Later, the decline was arrested and the stock had another sustained upward move. One cannot look at a stock chart like this without noticing the self-evidence of these statements. How can the economist be so myopic that he cannot see what is so plainly visible to the naked eye?
The persistence of this belief in repetitive stock-market patterns is due to statistical illusion. To illustrate, let me describe an experiment in which I asked my students to participate. The students were asked to construct a stock chart showing the movements of a hypothetical stock initially selling at $50. For each successive trading day, the closing stock price would be determined by the flip of a coin. If the toss was a head, the students assumed that the stock closed ½ point higher than the preceding close. If the flip was a tail, the price was assumed to be down by ½. The chart below is the hypothetical stock chart derived from one of these experiments.
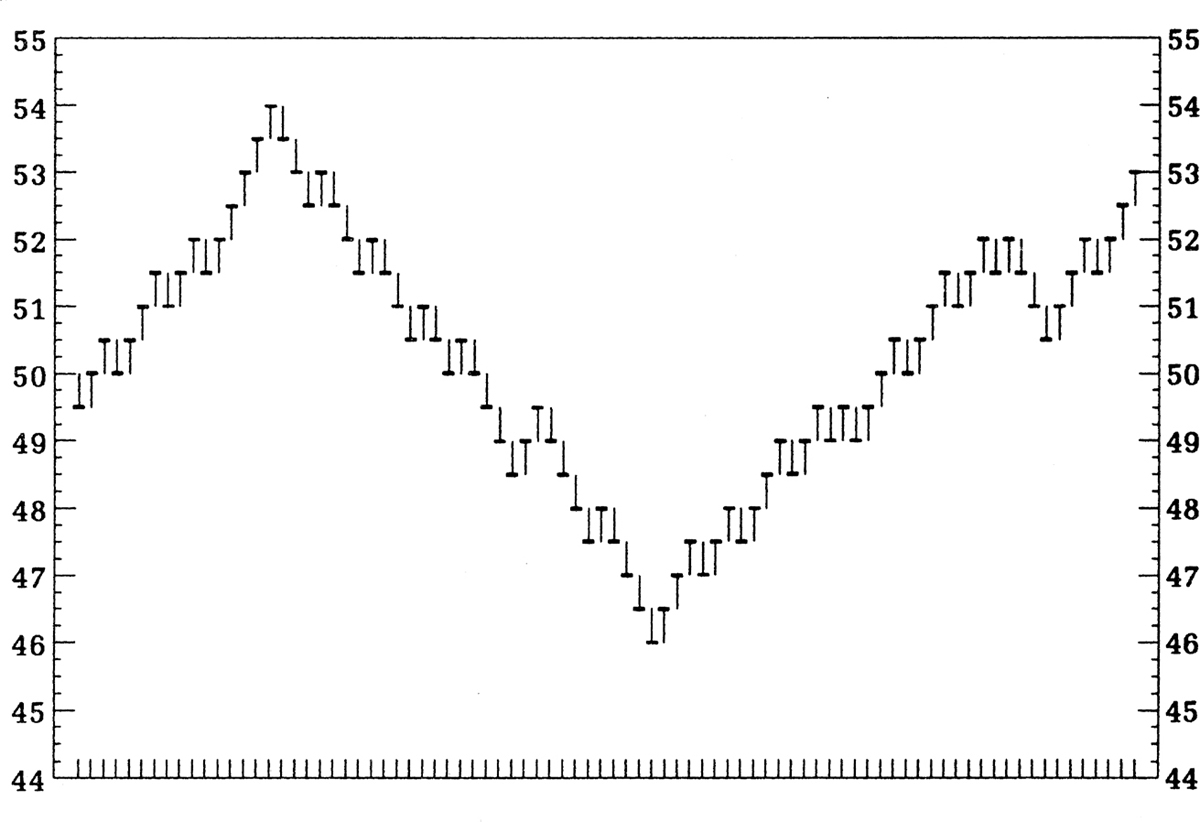
The chart derived from random coin tossings looks remarkably like a normal stock price chart and even appears to display cycles. Of course, the pronounced “cycles” that we seem to observe in coin tossings do not occur at regular intervals as true cycles do, but neither do the ups and downs in the stock market.
It is this lack of regularity that is crucial. The “cycles” in the stock charts are no more true cycles than the runs of luck or misfortune of the ordinary gambler. And the fact that stocks seem to be in an uptrend, which looks just like the upward move in some earlier period, provides no useful information on the dependability or duration of the current uptrend. Yes, history does tend to repeat itself in the stock market, but in an infinitely surprising variety of ways that confound any attempts to profit from a knowledge of past price patterns.
In other simulated charts derived from student coin-tossings, there were head-and-shoulders formations, triple tops and bottoms, and other more esoteric patterns. One chart showed an upward breakout from an inverted head and shoulders (a very bullish formation). I showed it to a chartist friend of mine who practically jumped out of his skin. “What is this company?” he exclaimed. “We’ve got to buy immediately. This pattern’s a classic. There’s no question the stock will be up 15 points next week.” He did not respond kindly when I told him the chart had been produced by flipping a coin. Chartists have no sense of humor. I got my comeuppance when BusinessWeek hired a technician adept at hatchet work to review the first edition of this book.
My students used a completely random process to produce their stock charts. With each toss, as long as the coins used were fair, there was a 50 percent chance of heads, implying an upward move in the price of the stock, and a 50 percent chance of tails and a downward move. Even if they flipped ten heads in a row, the chance of getting a head on the next toss was still 50 percent. Mathematicians call a sequence of numbers produced by a random process (such as those on our simulated stock chart) a random walk. The next move on the chart is completely unpredictable on the basis of what has happened before.
The stock market does not conform perfectly to the mathematician’s ideal of the complete independence of present price movements from those in the past. There is some momentum in stock prices. When good news arises, investors often only partially adjust their estimates of the appropriate price of the stock. Slow adjustment and crowd psychology can make stock prices rise steadily for a period, imparting a degree of momentum. The failure of stock prices to measure up perfectly to the definition of a random walk led the financial economists Andrew Lo and A. Craig MacKinlay to publish a book entitled A Non-Random Walk Down Wall Street. In addition to some evidence of short-term momentum, there has been a long-run uptrend in most averages of stock prices in line with the long-run growth of earnings and dividends.
But don’t count on momentum to give you some surefire strategy to allow you to beat the market. For one thing, stock prices don’t always underreact to news—sometimes they overreact and price reversals can occur with terrifying suddenness. Investment funds managed in accordance with momentum strategies often have subpar results. Even during periods when momentum is present (and the market fails to behave like a random walk), the systematic relationships that exist are often so small that they are not useful to investors. The transactions charges and taxes involved in trying to take advantage of momentum are far greater than any profits that might be obtained. Thus, an accurate statement of the “weak” form of the random-walk hypothesis goes as follows:
The history of stock price movements contains no useful information that will enable an investor consistently to outperform a buy-and-hold strategy in managing a portfolio.
If the weak form of the random-walk hypothesis is valid, then, as my colleague Richard Quandt says, “Technical analysis is akin to astrology and every bit as scientific.”
I am not saying that technical strategies never make money. They very often do make profits. The point is rather that a simple buy-and-hold strategy (that is, buying a stock or group of stocks and holding on for a long period of time) typically makes as much or more money.
When scientists want to test the efficacy of some new drug, they usually run an experiment in which two groups of patients are administered pills—one containing the drug in question, the other a worthless placebo (a sugar pill). The results of the administration to the two groups are compared, and the drug is deemed effective only if the group receiving the drug did better than the group getting the placebo. Obviously, if both groups got better in the same period of time, the drug should not be given the credit, even if the patients did recover.
In the stock-market experiments, the placebo with which the technical strategies are compared is the buy-and-hold strategy. Technical schemes often do make profits, but so does a buy-and-hold strategy. Indeed, a simple buy-and-hold strategy using a portfolio consisting of all the stocks in a broad stock-market index has provided investors with an average annual rate of return of about 10 percent over the past one hundred years. Only if technical schemes produce better returns than the market can they be judged effective. To date, none has consistently passed the test.
SOME MORE ELABORATE TECHNICAL SYSTEMS
Devotees of technical analysis may argue that I have been unfair. The simple tests I have just described do not do justice to the “richness” of technical analysis. Unfortunately for the technician, even more elaborate trading rules have been subjected to scientific testing. Let’s examine a few popular ones in detail.
Under the popular “filter” system, a stock that has reached a low and has moved up, say 5 percent (or any other percent you wish to name), is said to be in an uptrend. A stock that has moved down 5 percent from a peak is in a downtrend. You’re supposed to buy any stock that has moved up 5 percent from its low and hold it until the price moves down 5 percent from a subsequent high, at which time you sell and even sell short. The short position is maintained until the price rises at least 5 percent from a subsequent low.
This scheme is very popular with brokers. Indeed, the filter method lies behind the popular “stop-loss” order favored by brokers, where the client is advised to sell his stock if it falls 5 percent below his purchase price to “limit his potential losses.”
Exhaustive testing of various filter rules has been undertaken. The percentage drop or rise that filters out buy and sell candidates has been allowed to vary from 1 percent to 50 percent. The tests covered different time periods and involved individual stocks as well as stock indexes. The results are remarkably consistent. When the higher transactions charges incurred under the filter rules are taken into consideration, these techniques cannot consistently beat a policy of simply buying the individual stock (or the stock index) and holding it over the period during which the test is performed. The individual investor would do well to avoid using any filter rule and, I might add, any broker who recommends it.
The Dow theory is a great tug-of-war between resistance and support. When the market tops out and moves down, that previous peak defines a resistance area, because people who missed selling at the top will be anxious to do so if given another opportunity. If the market then rises again and nears the previous peak, it is said to be “testing” the resistance area. Now comes the moment of truth. If the market breaks through the resistance area, it is likely to keep going up for a while and the previous resistance area becomes a support area. If, on the other hand, the market “fails to penetrate the resistance area” and instead falls through the preceding low where there was previous support, a bear-market signal is given and the investor is advised to sell.
The basic Dow principle implies a strategy of buying when the market goes higher than the last peak and selling when it sinks through the preceding valley. There are various wrinkles to the theory, but the basic idea is part of the gospel of charting.
Unhappily, the signals generated by the Dow mechanism have no significance for predicting future price movements. The market’s performance after sell signals is no different from its performance after buy signals. Relative to simply buying and holding the representative list of stocks in the market averages, the Dow follower actually comes out a little behind, because the strategy entails a number of extra transactions costs.
In the relative-strength system, an investor buys and holds those stocks that are acting well, that is, outperforming the general market indexes. Conversely, the stocks that are acting poorly relative to the market should be avoided or, perhaps, even sold short. While there do seem to be some time periods when a relative-strength strategy would have outperformed a buy-and-hold strategy, there is no evidence that it can do so consistently. As indicated, there is some evidence of momentum in the stock market. Nevertheless, a computer test of relative-strength rules over a twenty-five-year period suggests that such rules, after accounting for costs and taxes, are not useful for investors.
Price-volume systems suggest that when a stock (or the general market) rises on large or increasing volume, there is an unsatisfied excess of buying interest and the stock will continue its rise. Conversely, when a stock drops on large volume, selling pressure is indicated and a sell signal is given.
Again, the investor following such a system is likely to be disappointed in the results. The buy and sell signals generated by the strategy contain no information useful for predicting future price movements. As with all technical strategies, however, the investor is obliged to do a great deal of in-and-out trading, and thus his transactions costs and taxes are far in excess of those necessitated in a buy-and-hold strategy.
Perhaps some of the more complicated chart patterns, such as those described in the preceding chapter, are able to reveal the future course of stock prices. For example, is the downward penetration of a head-and-shoulders formation a reliable bearish omen? In one study, the computer was programmed to draw charts for 548 stocks over a five-year period and identify any one of thirty-two of the most popularly followed chart patterns. The computer was on the lookout for heads and shoulders, triple tops and bottoms, channels, wedges, and so forth.
When the machine found that one of the bearish chart patterns such as a head and shoulders was followed by a downward move through the neckline toward décolletage (a most bearish omen), it recorded a sell signal. Triple bottoms followed by an upside breakout generated a buy signal. Again, there seemed to be no relationship between the technical signal and subsequent performance. If you bought those stocks with buy signals, and sold on sell signals, your performance would have been no better than that achieved with a buy-and-hold strategy. Even with zero brokerage commissions there are transaction costs from trading, and profits if any incur regular income taxes. With buy and hold, taxes are deferred.
Human nature likes order; people find it hard to accept the notion of randomness. No matter what the laws of chance might tell us, we search for patterns among random events wherever they might occur—not only in the stock market but even in interpreting sporting phenomena.
In describing an outstanding performance by a basketball player, reporters and spectators commonly use expressions such as “Zion Williamson has the hot hand” or “LaMelo Ball is a streak shooter.” Those who play, coach, or follow basketball are almost universally convinced that if a player has successfully made his last shot, or last few shots, he is more likely to make his next shot. A study by a group of psychologists, however, suggests that the “hot hand” phenomenon is a myth.
The psychologists did a detailed study of every shot taken by the Philadelphia 76ers over a full season and a half. They found no positive correlation between the outcomes of successive shots. Indeed, they found that a hit by a player followed by a miss was actually a bit likelier than the case of making two baskets in a row. Moreover, the researchers looked at sequences of more than two shots. Again, they found that the number of long streaks (that is, hitting of several baskets in a row) was no greater than could have been expected in a random set of data (such as flipping coins in which every event was independent of its predecessor). Although the event of making one’s last two or three shots influenced the player’s perception of future success, the hard evidence was that there was no effect. The researchers then confirmed their study by examining the free-throw records of the Boston Celtics and by conducting controlled shooting experiments with the men and women of the Cornell University varsity basketball teams.
These findings do not imply that basketball is a game of chance rather than skill. Obviously there are some players who are more adept at making baskets and free throws than others. The point is, however, that the probability of making a shot is independent of the outcome of previous shots. The psychologists conjecture that the persistent belief in the hot hand could be due to memory bias. If long sequences of hits or misses are more memorable than alternating sequences, observers are likely to overestimate the correlation between successive shots. When events sometimes do come in clusters and streaks, people refuse to believe that they are random, even though such clusters and streaks do occur frequently in random data such as are derived from the tossing of a coin.
A GAGGLE OF OTHER TECHNICAL THEORIES TO HELP YOU LOSE MONEY
Once the academic world polished off most of the standard technical trading rules, it turned its august attention toward some of the more fanciful schemes. The world of financial analysis would be much quieter and duller without the chartists, as the following techniques amply demonstrate.
Not content with price movements, some technical analysts have broadened their investigations to include other movements as well. One of the most charming of these schemes has been called by the author Ira Cobleigh the “bull markets and bare knees” theory. Check the hemlines of women’s dresses in any given year, and you’ll have an idea of the direction of stock prices. The following chart suggests a loose tendency for bull markets to be associated with bare knees and depressed markets to be associated with bear markets for girl watchers.
For example, in the late nineteenth century and early part of the twentieth, the stock market was rather dull, and so were hemlines. But then came rising hemlines and the great bull market of the 1920s, to be followed by long skirts and the crash of the 1930s. (Actually, the chart cheats a bit: hemlines fell in 1927, before the most dynamic phase of the bull market.)
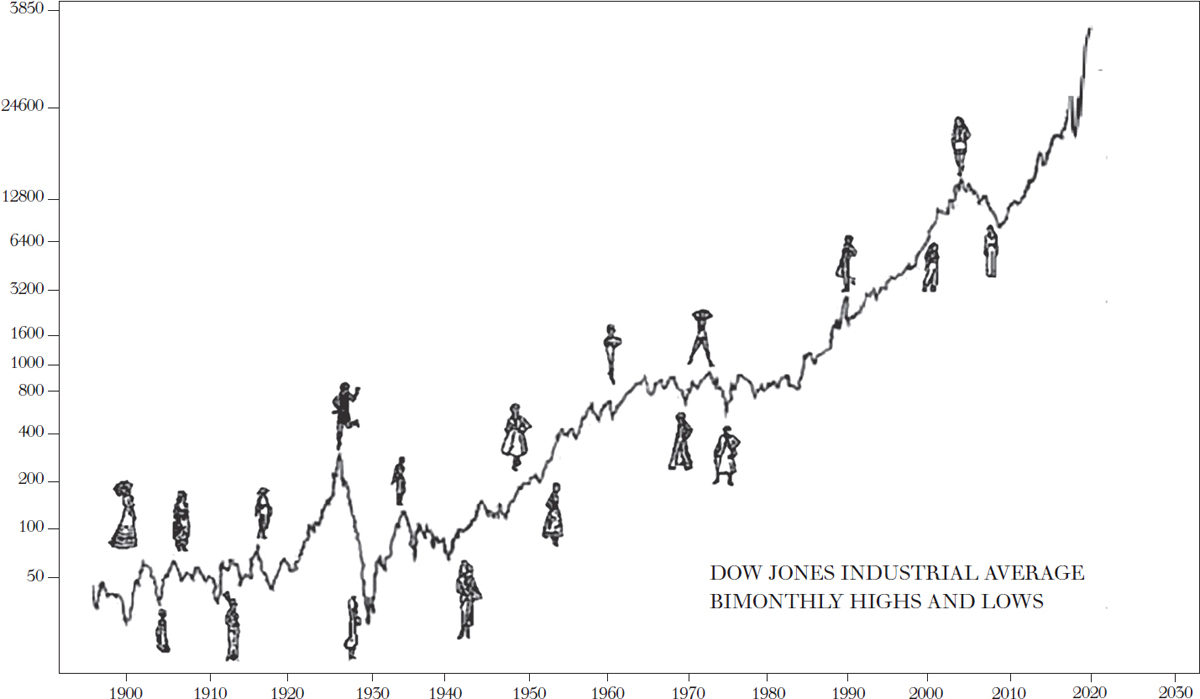
Things did not work out as well in the post–World War II period. The market declined sharply during the summer of 1946, well in advance of the introduction of the “New Look” featuring longer skirts in 1947. Similarly, the sharp stock-market decline that began at the end of 1968 preceded the introduction of the midiskirt, which was high fashion in 1969 and especially in 1970.
How did the theory work out during the crash of 1987? You might think the hemline indicator failed. After all, in the spring of 1987, when designers began shipping their fall lines, very short skirts were decreed as the fashion for the time. But along about the beginning of October, when the first chill winds began blowing across the country, a strange thing happened: Most women decided that miniskirts were not for them. As women went back to long skirts, designers quickly followed suit. The rest is stock-market history. And how about the severe bear markets of the first decade of the 2000s? Unfortunately, you guessed it, pants became the fashion. Women business leaders and politicians always appeared in pants suits. Now we know the real culprit for the punishing bear markets of the period. Of course, the real reason for the decline in 2007–2008 was the onset of the financial crisis described in chapter 4. The sharp decline in 2020 was caused by the COVID-19 pandemic. Both events were unanticipated.
Even though there does seem to be some evidence in favor of the theory, don’t be too optimistic about expecting the hemline indicator to give you a leg up on market timing. No longer are women imprisoned by the tyranny of hemlines. As Vogue put it, you can now dress like a man or woman, and all hemline lengths are now okay.
Why did the market go up in 2021? That’s easy to answer for a technical analyst who uses the Super Bowl indicator. The Super Bowl indicator forecasts how the stock market will perform on the basis of which team wins the Super Bowl. A victory by member of the National Football League such as the Tampa Bay Buccaneers predicts a bull market in stocks, whereas a victory by a member of the American Football League is bad news for stock market investors. Although the indicator sometimes fails, it has been correct far more often than it has been wrong. Naturally, it makes no sense. The results of the Super Bowl indicator simply illustrate nothing more than the fact that it’s sometimes possible to correlate two completely unrelated events. Indeed, Mark Hulbert reports that the stock-market researcher David Leinweber found that the indicator most closely correlated with the S&P 500 Index is the volume of butter production in Bangladesh.
This interesting strategy capitalized on a general contrarian conviction that out-of-favor stocks eventually tend to reverse direction. The strategy entailed buying each year the ten stocks in the Dow Jones 30-Stock Industrial Average that had the highest dividend yields. The idea was that these ten stocks were the most out of favor, so they typically had low price-earnings multiples and low price-to-book-value ratios as well. The theory is attributed to a money manager named Michael O’Higgins. James O’Shaughnessy tested the theory as far back as the 1920s; he found that the Dogs of the Dow had beaten the overall index by over 2 percentage points per year with no additional risk.
Members of the canine contingent of Wall Street analysts raised their ears and marketed billions of dollars of mutual funds on the basis of the principle. And then, just as might be expected, success bit the dogs. The Dogs of the Dow consistently underperformed the overall market. As the Dogs star O’Higgins opined, “the strategy became too popular” and ultimately self-destructed. The Dogs of the Dow no longer hunt.
A number of researchers have found that January has been a very unusual month for stock-market returns. Stock-market returns have tended to be especially high during the first two weeks of January, particularly for smaller firms. Even after one adjusts for risk, small firms appear to offer investors abnormally generous returns—with the excess returns produced largely during the first few days of the year. Such an effect has also been documented for several foreign stock markets. This led to the publication of one book with the provocative title The Incredible January Effect.
Unfortunately, however, the transactions costs of trading in the stocks of small companies are substantially higher than those for larger companies (because of higher bid-ask spreads and lower liquidity), and there appears to be no way any ordinary investor could exploit this anomaly. Moreover, the effect is not dependable in each year. In other words, the January “loose change” costs too much to pick up, and in some years it turns out to be a mirage.
To continue this review of technical schemes would soon generate rapidly diminishing returns. Probably few people seriously believe that the sunspot theory of stock-market movements can make money for them. But do you believe that by following the ratio of advancing to declining stocks on the New York Stock Exchange you can find a reliable leading indicator of general stock-market peaks? A careful computer study says no. Do you think that a rise in short interest (the number of shares of a stock sold short) is a bullish signal (because eventually the stock will be repurchased by the short seller to cover his or her position)? Exhaustive testing indicates no relationship either for the stock market as a whole or for individual issues. Do you think that a moving-average system as espoused by some of the financial television networks (for example, buy a stock if its price or its fifty-day average price goes higher than its average price over the past 200 days and sell it if it goes below the average) can lead you to extraordinary stock-market profits? Not if you have to pay transactions charges—to buy and sell! Do you think you should “Sell in May and Go Away” until October? In fact, the market rises between May and October more often than not.
Technicians may not make accurate predictions, but the early ones were certainly colorful. One of the most popular was Elaine Garzarelli, then an executive vice president of the investment firm of Lehman Brothers. Garzarelli was not a one-indicator woman. She plunged into the ocean of financial data and used thirteen different indicators to predict the course of the market. Garzarelli always liked to study vital details. As a child, she would get animal organs from the local butcher and dissect them.
Garzarelli was the Roger Babson of the 1987 crash. On October 13, in a forecast almost frighteningly prescient, she told USA Today that a drop of more than 500 points (a 20 percent decline) in the Dow was coming. Within a week, her predictions were realized.
But the crash was Garzarelli’s last hurrah. Just as the media were coronating her as the “Guru of Black Monday” and adulatory articles appeared in magazines ranging from Cosmopolitan to Fortune, she drowned in her prescience—or her notoriety. After the crash, she said she wouldn’t touch the market and predicted that the Dow would fall another 200 to 400 points. Thus, Garzarelli missed the bounce-back in the market. Moreover, those who put money in her hands were sadly disappointed. In explaining her lack of consistency, she gave the time-honored explanation of technicians: “I failed to believe my own charts.”
Perhaps the most colorful investment gurus of the mid-1990s were the homespun, grandmotherly (median age seventy) Beardstown Ladies. Called by publicists “the greatest investment minds of our generation,” these celebrity grannies cooked up profits and hype, selling more than a million books and appearing frequently on national television shows and in weekly magazines. They mixed explanations of their investment success (“heartland” virtues of hard work and churchgoing) with yummy cooking recipes (such as stock-market muffins—guaranteed to rise). In their best-selling 1995 book, The Beardstown Ladies’ Common-Sense Investment Guide, they claimed that their investment returns were 23.9 percent per year over the preceding decade, far eclipsing the 14.9 annual percent return of the S&P 500 Index. What a great story: Little old midwestern ladies using common sense could beat the pants off the overpaid investment pros of Wall Street and could even put index funds to shame.
Unfortunately, the ladies were discovered to be cooking the books as well. Apparently, members of the Beardstown group were counting their investment club dues as part of their stock-market profits. The accounting firm Price Waterhouse was called in, and it calculated the ladies’ true investment return over the decade to be 9.1 percent per year—almost 6 points below the overall market. So much for getting rich by worshiping investment idols.
The moral to the story is obvious. With large numbers of technicians predicting the market, there will always be some who have called the last turn or even the last few turns, but none will be consistently accurate. To paraphrase the biblical warning, “He who looks back at the predictions of market gurus dies of remorse.”
As you might imagine, the random-walk theory’s dismissal of charting is not altogether popular among technicians. Academic proponents of the theory are greeted in some Wall Street quarters with as much enthusiasm as Andrew Cuomo addressing the #MeToo movement. Technical analysts consider the theory “just plain academic drivel.” Let us pause, then, and appraise the counterattack by beleaguered technicians.
Perhaps the most common complaint about the weakness of the random-walk theory is based on a distrust of mathematics and a misconception of what the theory means. The market isn’t random, the complaint goes, and “no mathematician is going to convince anyone that it is. In the long run future earnings must influence present value, and in the short run the dominant factor is the temper of the crowd.”
Of course, earnings and dividends influence market prices, and so does the temper of the crowd. We saw ample evidence of this in earlier chapters of the book. But, even if markets were dominated during certain periods by irrational crowd behavior, the stock market might well still be approximated by a random walk. The original illustrative analogy of a random walk concerned a drunken man staggering around an empty field. He is not rational, but he’s not predictable either.
Moreover, new fundamental information about a company (a big mineral strike, the death of the CEO, etc.) is also unpredictable. Indeed, successive appearances of news items must be random. If an item of news were not random, that is, if it were dependent on an earlier item of news, then it wouldn’t be news at all. The random-walk theory says only that stock prices cannot be predicted on the basis of past stock prices.
The technical analyst will also cite chapter and verse that the academic world has certainly not tested every technical scheme that has been devised. No one can prove conclusively that technical methods can never work. All that can be said is that the small amount of information contained in stock-market pricing patterns has not been shown to be sufficient to overcome the transactions costs and taxes involved in acting on that information.
Each year a number of eager people visit the gambling parlors of Las Vegas and Atlantic City and examine the last several hundred numbers of the roulette wheel in search of some repeating pattern. Usually they find one. Ultimately they lose everything because they do not retest the pattern.* The same thing is true for technicians.
If you examine past stock prices in any given period, you can almost always find some kind of system that would have worked in a given period. If enough different criteria for selecting stocks are tried, one will eventually be found that works. The real problem is, of course, whether the scheme works in a different time period. What most advocates of technical analysis usually fail to do is to test their schemes with market data derived from periods other than those during which the scheme was developed.
Even if the technician follows my advice, tests his scheme in many different time periods, and finds it a reliable predictor of stock prices, I still believe that technical analysis must ultimately be worthless. For the sake of argument, suppose the technician had found a reliable year-end rally, that is, every year stock prices rose between Christmas and New Year’s Day. The problem is that once such a regularity is known to market participants, people will act in a way that prevents it from happening in the future.
Any successful technical scheme must ultimately be self-defeating. The moment I realize that prices will be higher after New Year’s Day than they are before Christmas, I will start buying before Christmas ever comes around. If people know a stock will go up tomorrow, you can be sure it will go up today. Any regularity in the stock market that can be discovered and acted upon profitably is bound to destroy itself. This is the fundamental reason why I am convinced that no one will be successful in using technical methods to get above-average returns in the stock market.
The past history of stock prices cannot be used to predict the future in any meaningful way. Technical strategies are usually amusing, often comforting, but of no real value. This is the weak form of the efficient market hypothesis. Technical theories enrich only the people preparing and marketing the technical service or the brokers who hire technicians hoping that their analyses may encourage investors to do more business with their firms.
Using technical analysis for market timing is especially dangerous. Because there is a long-term uptrend in the stock market, it can be very risky to be in cash. An investor who frequently carries a large cash position to avoid periods of market decline is very likely to be out of the market during some periods where it rallies smartly. Professor H. Nejat Seyhun of the University of Michigan found that 95 percent of the significant market gains over a thirty-year period came on 90 of the roughly 7,500 trading days. If you happened to miss those 90 days, just over 1 percent of the total, the generous long-run stock-market returns of the period would have been wiped out. Studying a longer period, Laszlo Birinyi, in his book Master Trader, has calculated that a buy-and-hold investor would have seen one dollar invested in the Dow Jones Industrial Average in 1900 grow to $290 by the start of 2013. Had that investor missed the best five days each year, however, that dollar investment would have been worth less than a penny in 2013. The point is that market timers risk missing the infrequent large sprints that are the big contributors to performance.
The implications are simple. If past prices contain little or no useful information for predicting future prices, there is no point in following technical trading rules. A simple policy of buying and holding will be at least as good as any technical procedure. Moreover, buying and selling, to the extent that it is profitable, tends to generate taxable capital gains. By following any technical strategy, you are likely to realize short-term capital gains and pay larger taxes (as well as paying them sooner) than you would under a buy-and-hold strategy. Simply buying and holding a diversified portfolio will enable you to save on investment expense, transaction costs, and taxes.
*Edward O. Thorp actually did find a method to win at blackjack. Thorp wrote it all up in Beat the Dealer. Since then, casinos switched to the use of several decks of cards or automatic shuffling machines to make it more difficult for card counters and, as a last resort, they banished the counters from the gaming tables.