
TECHNICAL AND FUNDAMENTAL ANALYSIS
A picture is worth ten thousand words.
— Old Chinese proverb
The greatest of all gifts is the power to estimate things at their true worth.
—La Rochefoucauld, Réflexions; ou sentences et maximes morales
ON A TYPICAL trading day, shares with a total market value of hundreds of billions are traded on the New York Stock Exchange, the NASDAQ market, and various electronic crossing networks across the country. Including markets for futures, options, and swaps, trillions of dollars of transactions take place each day. Professional investment analysts and counselors are involved in what has been called the biggest game in town.
If the stakes are high, so are the rewards. When Wall Street is having a good year, new trainees from the Harvard Business School routinely draw salaries of $200,000 per year. At the top of the salary scale are the high-profile money managers themselves—the men and women who run the large mutual and pension funds and who manage the trillions of dollars of hedge-fund and private equity assets. “Adam Smith,” after writing The Money Game, boasted that he would make a quarter of a million dollars from his best-selling book. His Wall Street friends retorted, “You’re only going to make as much as a second-rate institutional salesman.” Although not the oldest, the profession of high finance is certainly one of the most generously compensated.
Part Two of this book concentrates on the methods used by professional portfolio managers. It shows how academics have analyzed their investment results and have concluded that they are not worth the money you pay for them. It then introduces the efficient-market hypothesis (EMH) and its practical implication: Stock investors can do no better than simply buying and holding an index fund that owns a portfolio consisting of all the stocks in the market.
TECHNICAL VERSUS FUNDAMENTAL ANALYSIS
The attempt to predict the future course of stock prices and thus the appropriate time to buy or sell a stock ranks as one of investors’ most persistent endeavors. This search for the golden egg has spawned a variety of methods, ranging from the scientific to the occult. There are people today who forecast future stock prices by measuring sunspots, looking at the phases of the moon, or measuring the vibrations along the San Andreas Fault. Most, however, opt for one of two methods: technical or fundamental analysis.
The alternative techniques used by the investment pros are related to the two theories of the stock market I covered in Part One. Technical analysis is the method of predicting the appropriate time to buy or sell a stock used by those believing in the castle-in-the-air view of stock pricing. Fundamental analysis is the technique of applying the tenets of the firm-foundation theory to the selection of individual stocks.
Technical analysis is essentially the making and interpreting of stock charts. Thus, its practitioners, a small but abnormally dedicated cult, are called chartists or technicians. They study the past movements of common-stock prices and the volume of trading to predict the direction of future changes. Many chartists believe that the market is only 10 percent logical and 90 percent psychological. They generally subscribe to the castle-in-the-air school and view the investment game as one of anticipating how the other players will behave. Charts, of course, tell only what the other players have been doing in the past. The chartist’s hope, however, is that a study of what the other players are doing will shed light on what the crowd is likely to do in the future.
Fundamental analysts take the opposite tack, believing that the market is 90 percent logical and only 10 percent psychological. Caring little about the particular pattern of past price movements, fundamentalists seek to determine a stock’s proper value. Value in this case is related to a company’s assets, its expected growth rate of earnings and dividends, interest rates, and risk. By studying these factors, the fundamentalist arrives at an estimate of a security’s intrinsic value or firm foundation of value. If this is above the market price, then the investor is advised to buy. Fundamentalists believe that eventually the market will reflect the security’s real worth. Perhaps 90 percent of the Wall Street security analysts consider themselves fundamentalists. Many would argue that chartists are lacking in dignity and professionalism.
The first principle of technical analysis is that all information about earnings, dividends, and the future performance of a company is automatically reflected in the company’s past market prices. A chart showing these prices and the volume of trading already comprises all the fundamental information, good or bad, that the security analyst can hope to know. The second principle is that prices tend to move in trends: A stock that is rising tends to keep on rising, whereas a stock at rest tends to remain at rest.
A true chartist doesn’t even care to know what business or industry a company is in, as long as he or she can study its stock chart. A chart shaped in the form of an “inverted bowl” or “pennant” means the same for Microsoft as it does for Coca-Cola. Fundamental information on earnings and dividends is considered at best to be useless—and at worst a positive distraction. It is either of inconsequential importance for the pricing of the stock or, if it is important, it has already been reflected in the market days, weeks, or even months in advance. Many chartists will not even read the newspaper or check the financial web services.
One of the original chartists, John Magee, operated from a small office in Springfield, Massachusetts, where even the windows were boarded up to prevent any outside influences from distracting his analysis. Magee was once quoted as saying, “When I come into this office I leave the rest of the world outside to concentrate entirely on my charts. This room is exactly the same in a blizzard as on a moonlit June evening. In here I can’t possibly do myself and my clients the disservice of saying ‘buy’ simply because the sun is out or ‘sell’ because it is raining.”
The figures that follow show how easy it is to construct a chart. Simply draw a vertical line whose bottom is the stock’s low for the day and whose top is the high. This line is crossed to indicate the closing price for the day. The process can be repeated for each trading day and can be used for individual stocks or for a stock index.
Often the chartist will indicate the volume of shares of stock traded during the day by another vertical line at the bottom of the chart. Gradually, the highs and lows on the chart of the stock in question jiggle up and down sufficiently to produce patterns. To the chartist, these patterns have the same significance as X-ray plates to a surgeon.
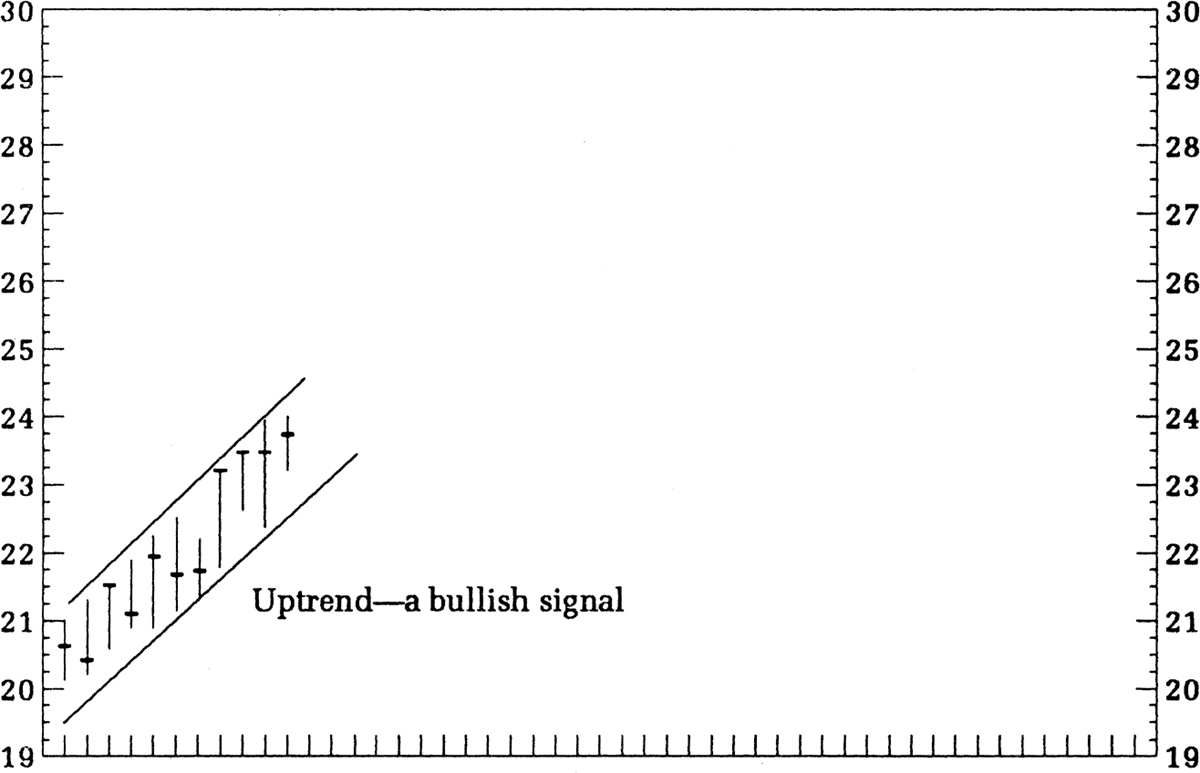
One of the first things the chartist looks for is a trend. The preceding figure shows one in the making. It is the record of price changes for a stock over a number of days—and the prices are obviously on the way up. The chartist draws two lines connecting the tops and bottoms, creating a “channel” to delineate the uptrend. Because the presumption is that momentum in the market will tend to perpetuate itself, the stock can be expected to continue to rise. As Magee wrote in the bible of charting, Technical Analysis of Stock Trends, “Prices move in trends, and trends tend to continue until something happens to change the supply-demand balance.”
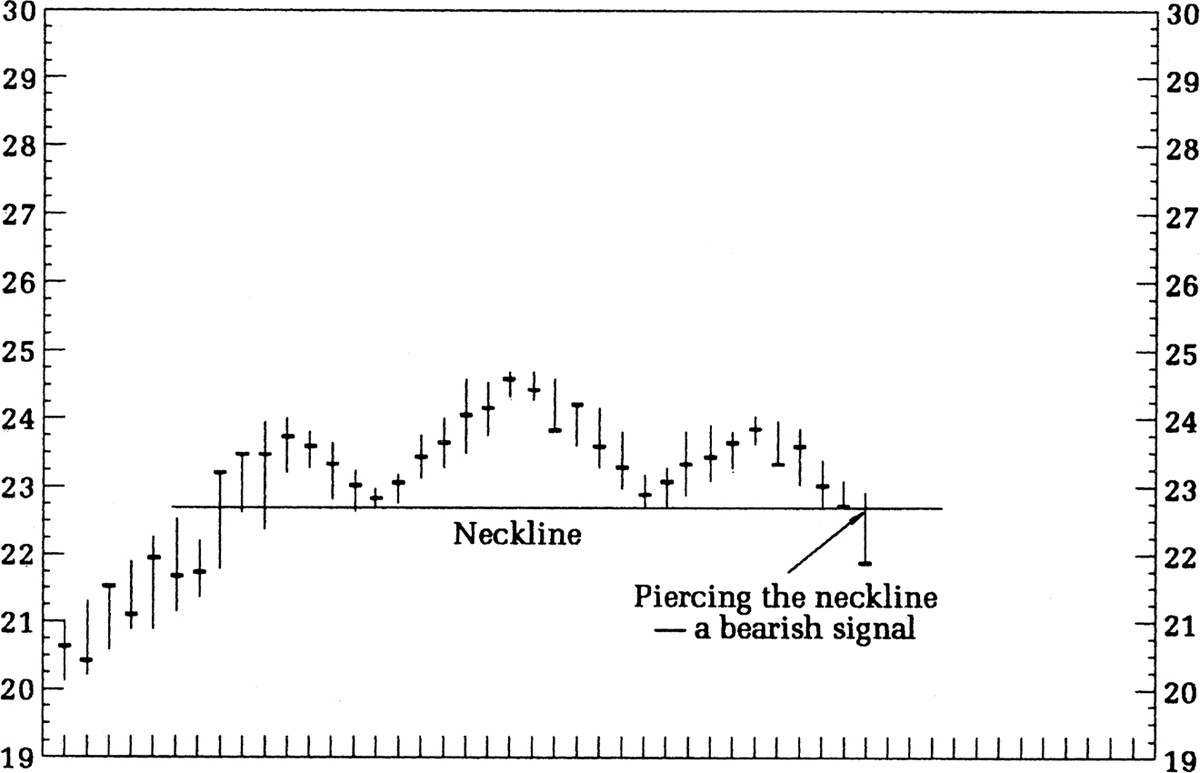
Suppose, however, that at about 24, the stock finally runs into trouble and is unable to gain any further ground. This is called a resistance level. The stock may wiggle around a bit and then turn downward. One pattern, which chartists claim reveals a clear signal that the market has topped out, is a head-and-shoulders formation (shown in the figure below).
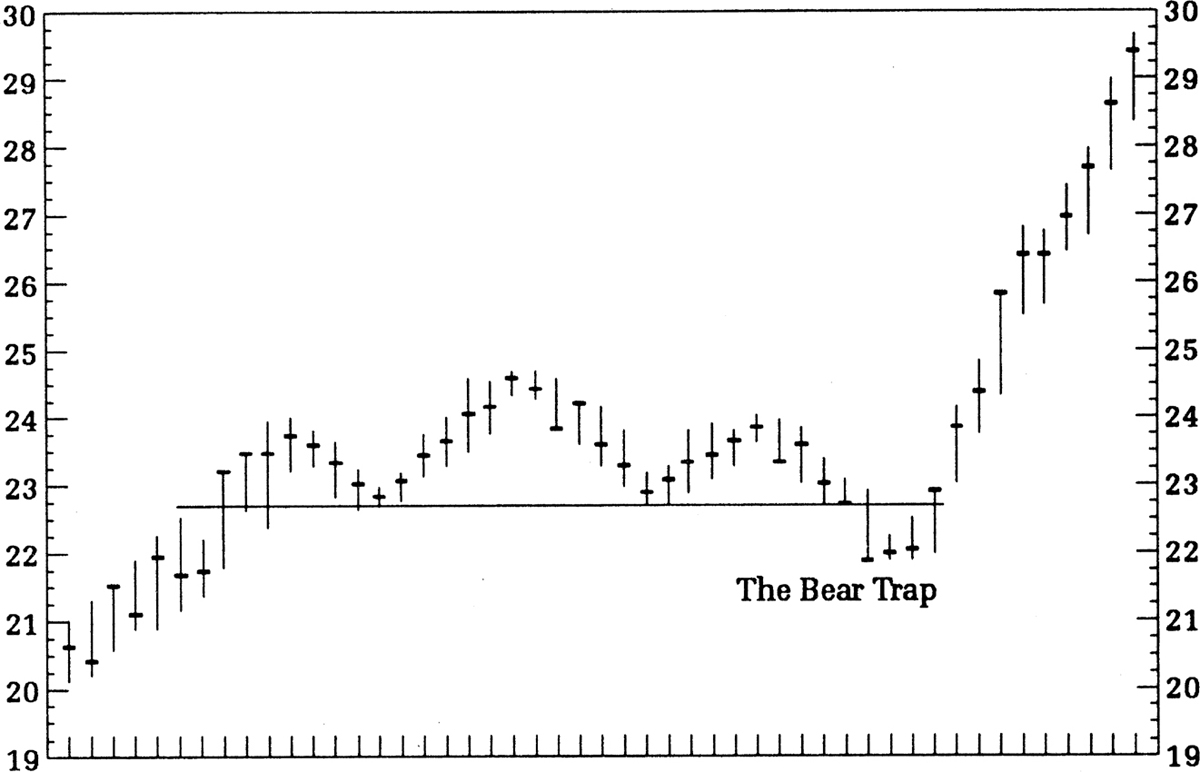
The stock first rises and then falls slightly, forming a rounded shoulder. It rises again, going slightly higher, before once more receding, forming a head. Finally the right shoulder is formed, and chartists wait with bated breath for the sell signal, which sounds loud and clear when the stock “pierces the neckline.” With the glee of Count Dracula surveying one of his victims, the chartists are off and selling, anticipating that a prolonged downtrend will follow as it allegedly has in the past. Of course, sometimes the market surprises the chartist. For example, the stock may make an end run up to 30 right after giving a bear signal, as shown in the following chart. This is called a bear trap or, to the chartist, the exception that tests the rule.
It follows from the technique that the chartist is a trader, not a long-term investor. The chartist buys when the auguries look favorable and sells on bad omens. He flirts with stocks just as some flirt with the opposite sex, and his scores are successful in-and-out trades, not rewarding long-term commitments. Indeed, the psychiatrist Don D. Jackson, author with Albert Haas Jr. of Bulls, Bears and Dr. Freud, suggested that such an individual may be playing a game with overt sexual overtones.
When the chartist chooses a stock, there is typically a period of observation and flirtation before he commits himself, because for the chartist—as in romance and sexual conquest—timing is essential. There is mounting excitement as the stock penetrates the base formation and rises higher. Finally, if the affair has gone well, there is the moment of fulfillment—profit-taking, and the release and afterglow that follow. The chartist’s vocabulary features such terms as “double bottoms,” “breakthrough,” “violating the lows,” “firmed up,” “big play,” “ascending peaks,” and “buying climax.” And all this takes place under the pennant of that great symbol of sexuality: the bull.
THE RATIONALE FOR THE CHARTING METHOD
Why is charting supposed to work? Many chartists freely admit that they don’t know why charting should work—history just has a habit of repeating itself.
To me, the following three explanations of technical analysis appear to be the most plausible. First, it has been argued that the crowd instinct of mass psychology makes trends perpetuate themselves. When investors see the price of a speculative favorite going higher and higher, they want to jump on the bandwagon and join the rise. Indeed, the price rise itself helps fuel the enthusiasm in a self-fulfilling prophecy. Each rise in price just whets the appetite and makes investors expect a further rise.
Second, there may be unequal access to fundamental information about a company. When some favorable piece of news occurs, such as the discovery of a rich mineral deposit, it is alleged that the insiders are the first to know, and they act, buying the stock and causing its price to rise. The insiders then tell their friends, who act next. Then the professionals find out the news, and the big institutions put blocks of the shares in their portfolios. Finally, the poor slobs like you and me get the information and buy, pushing the price still higher. This process is supposed to result in a rather gradual increase in the price of the stock when the news is good and a decrease when the news is bad.
Third, investors often underreact initially to new information. There is some evidence that when earnings are announced that beat (trail) Wall Street estimates (positive or negative “earnings surprises”), the stock price reacts positively (negatively), but the initial adjustment is incomplete. Thus, the stock market will often adjust to earnings information only gradually, resulting in a sustained period of price momentum.
Chartists also believe that people have a nasty habit of remembering what they paid for a stock, or the price they wish they had paid. For example, suppose a stock sold for about $50 a share for a long period of time, during which a number of investors bought in. Suppose then that the price drops to $40.
The chartists claim that the public will be anxious to sell out the shares when they rise back to the price at which they were bought, and thus break even on the trade. Consequently, the price of $50 at which the stock sold initially becomes a “resistance area.” Each time the resistance area is reached and the stock turns down, the resistance level becomes harder to cross, because more investors get the idea that the market or the individual stock in question cannot go any higher.
A similar argument lies behind the notion of “support levels.” Chartists say that many investors who failed to buy when the market fluctuated around a relatively low price level will feel they have missed the boat when prices rise. Presumably such investors will jump at the chance to buy when prices drop back to the original low level. In chart theory, a support area that holds on successive declines becomes stronger and stronger. So if a stock declines to a support area and then begins to rise, the traders will jump in, believing that the stock is just “coming off the pad.” Another bullish signal is flashed when a stock finally breaks through a resistance area. In the lexicon of the chartists, the former resistance area becomes a support area, and the stock should have no trouble gaining further ground.
WHY MIGHT CHARTING FAIL TO WORK?
There are many logical arguments against charting. First, the chartist buys only after price trends have been established, and sells only after they have been broken. Because sharp reversals in the market may occur quite suddenly, the chartist often misses the boat. By the time an uptrend is signaled, it may already have taken place. Second, such techniques must ultimately be self-defeating. As more and more people use it, the value of any technique depreciates. No buy or sell signal can be worthwhile if everyone tries to act on it simultaneously. Moreover, traders tend to anticipate technical signals. The earlier they anticipate, the less certain they are that the signal will occur and that the trade will be profitable.
Perhaps the most telling argument against technical methods comes from the logical implications of profit-maximizing behavior. Suppose that Universal Polymers is selling at around 20 when Sam, the chief research chemist, discovers a new production technique that promises to double the company’s earnings. Sam is convinced that the price of Universal will hit 40 when the news of his discovery comes out. Because any purchases below 40 will provide a swift profit, Sam and his friends may well keep buying until the price hits 40, a process that could take no longer than a few minutes. The market may well be a most efficient mechanism. If some people know that the price will go to 40 tomorrow, it will go to 40 today.
In the days before the computer, the laborious task of charting a course through the market was done by hand. Chartists were often viewed as peculiar people with green eyeshades who were tucked away in a small closet at the back of the office. Now chartists have computer services hooked into a variety of data networks and replete with a large display terminal that, at the tap of a finger, can produce every conceivable chart. The chartist (now called a technician) can, with the glee of a child playing with a new electric train, produce a complete chart of a stock’s past performance, including measures of volume, the 200-day moving average (an average of prices over the previous 200 days recalculated each day), the strength of the stock relative to the market and its industry, and literally hundreds of other averages, ratios, oscillators, and indicators. Moreover, individuals can access a variety of charts for different time periods through Internet sites.
THE TECHNIQUE OF FUNDAMENTAL ANALYSIS
Fred Schwed Jr., in his charming and witty exposé of the financial community in the 1930s, Where Are the Customers’ Yachts?, tells of a Texas broker who sold some stock to a customer at $760 a share at the moment when it could have been purchased at $730. When the outraged customer found out what had happened, he complained bitterly to the broker. The Texan cut him short. “Suh,” he boomed, “you-all don’t appreciate the policy of this firm. This heah firm selects investments foh its clients not on the basis of Price, but of Value.”
In a sense, this story illustrates the difference between the technician and the fundamentalist. The technician is interested only in the record of the stock’s price, whereas the fundamentalist’s primary concern is with what a stock is really worth. The fundamentalist strives to be relatively immune to the optimism and pessimism of the crowd and makes a sharp distinction between a stock’s current price and its true value.
In estimating the firm-foundation value of a stock, the fundamentalist’s most important job is to estimate the firm’s future stream of earnings and dividends. The worth of a share is taken to be the present or discounted value of all the cash flows the investor is expected to receive. The analyst must estimate the firm’s sales level, operating costs, tax rates, depreciation, and the sources and costs of its capital requirements.
Basically, the security analyst must be a prophet without the benefit of divine inspiration. As a poor substitute, the analyst turns to a study of the past record of the company, a review of the company’s income statements, balance sheets, and investment plans, and a firsthand visit to and appraisal of the company’s management team. The analyst must then separate the important facts from the unimportant ones. As Benjamin Graham put it in The Intelligent Investor, “Sometimes he reminds us a bit of the erudite major general in ‘The Pirates of Penzance,’ with his ‘many cheerful facts about the square of the hypotenuse.’ ”
Because the general prospects of a company are strongly influenced by the economic position of its industry, the starting point for the security analyst is a study of industry prospects. Indeed, security analysts usually specialize in particular industry groups. The fundamentalist hopes that a thorough study of industry conditions will produce valuable insights into factors that are not yet reflected in market prices.
The fundamentalist uses four basic determinants to help estimate the proper value for any stock.
Determinant 1: The expected growth rate. Most people don’t recognize the implications of compound growth for financial decisions. Albert Einstein once described compound interest as the “greatest mathematical discovery of all time.” It is often said that the Native American who sold Manhattan Island in 1626 for $24 was rooked by the white man. In fact, he may have been an extremely sharp salesman. Had he put his $24 away at 6 percent interest, compounded semiannually, it would now be worth more than $100 billion, and with it his descendants could buy back much of the now improved land. Such is the magic of compound growth!
Compounding is the process that makes 10 plus 10 equal 21 rather than 20. Suppose you invest $100 this year and next year in an investment that produces a 10 percent annual return. How much have you made by the end of year two? If you answered 21 percent, then you deserve a gold star and a trip to the head of the class.
The algebra is simple. Your $100 grows to $110 at the end of year one. Next year, you also earn 10 percent on the $110 you start with, so you have $121 at the end of year two. Thus, the total return over the two-year period is 21 percent. The reason it works is that the interest you earn from your original investment also earns interest. Carrying it out in year three, you have $133.10. Compounding is powerful indeed.
A useful rule, called “the rule of 72,” provides a shortcut way to determine how long it takes for money to double. Take the interest rate you earn and divide it into the number 72, and you get the number of years it will take to double your money. For example, if the interest rate is 15 percent, it takes a bit less than five years for your money to double (72 divided by 15 = 4.8 years). The implications of various growth rates for the size of future dividends are shown in the table below.
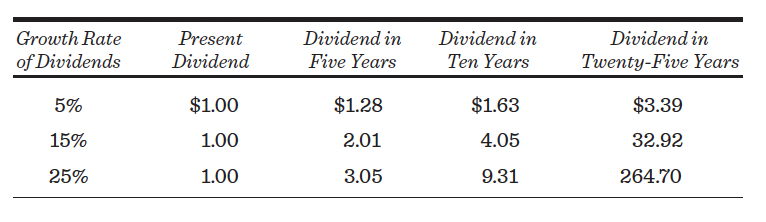
The catch (and doesn’t there always have to be at least one, if not twenty-two?) is that dividend growth does not go on forever, for the simple reason that corporations have life cycles similar to most living things. Consider the leading corporations in the United States one hundred fifty years ago. Such names as Eastern Buggy Whip Company, La Crosse and Minnesota Steam Packet Company, Savannah and St. Paul Steamboat Line, and Hazard Powder Company would have ranked high in a Fortune top 500 list of that era. All are now deceased.
And even if the natural life cycle doesn’t get a company, there’s always the fact that it gets harder and harder to grow at the same percentage rate. A company earning $1 million need increase its earnings by only $100,000 to achieve a 10 percent growth rate, whereas a company starting from a base of $100 million in earnings needs $10 million in additional earnings to produce the same record.
The nonsense of relying on very high long-term growth rates is nicely illustrated by working with population projections for the United States. If the populations of the nation and of California continue to grow at their recent rates, 120 percent of the United States population will live in California by the year 2045!
Hazardous as projections may be, share prices must reflect differences in growth prospects if any sense is to be made of market valuations. Also, the probable length of the growth phase is very important. If one company expects to enjoy a rapid 20 percent growth rate for ten years, and another growth company expects to sustain the same rate for only five years, the former company is, other things equal, more valuable to the investor than the latter. The point is that growth rates are general rather than gospel truths. And this brings us to the first fundamental rule for evaluating securities:
Rule 1: A rational investor should be willing to pay a higher price for a share the larger the growth rate of dividends and earnings.
To this is added an important corollary:
Corollary to Rule 1: A rational investor should be willing to pay a higher price for a share the longer an extraordinary growth rate is expected to last.
Does this rule seem to conform to actual practices? Let’s first reformulate the question in terms of price-earnings (P/E) multiples rather than market prices. This provides a good yardstick for comparing stocks—which have different prices and earnings—against one another. A stock selling at $100 with earnings of $10 per share would have the same P/E multiple (10) as a stock selling at $40 with earnings of $4 per share. It is the P/E, not the price, that tells you how a stock is valued in the market.
Our reformulated question now reads: Are actual price-earnings multiples higher for stocks for which a high growth rate is anticipated? It was easy to collect data on prices and earnings required to calculate P/E multiples. Expected long-term growth rates were obtained from Yahoo Finance. The chart on page 130 involving a few representative securities confirms Rule 1. High P/E ratios are associated with high expected growth rates.
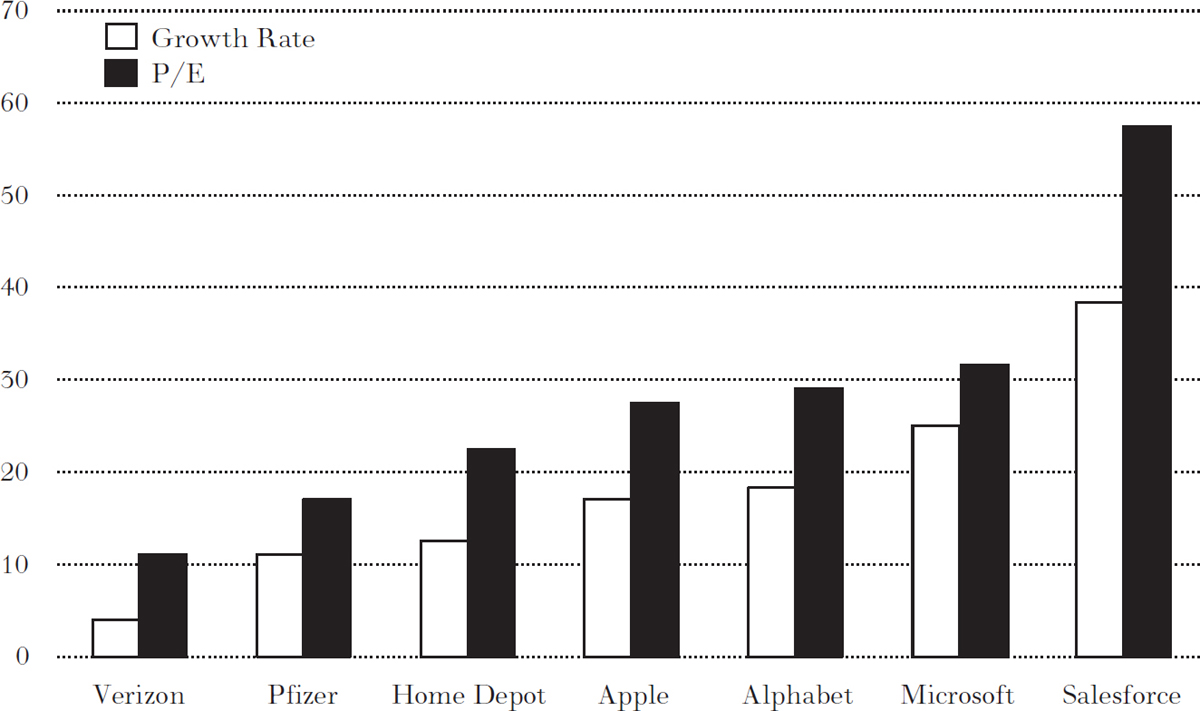
In addition to demonstrating how the market values different growth rates, the chart can also be used as a practical investment guide. Suppose you were considering the purchase of a stock with an anticipated 11 percent growth rate and you knew that, on average, stocks with 11 percent growth sold, like Pfizer, at 17 times earnings. If the stock you were considering sold at a price-earnings multiple of 25, you might reject the idea of buying the stock in favor of one more reasonably priced in terms of current market norms.
Determinant 2: The expected dividend payout. The amount of dividends you receive—as contrasted to their growth rate—is readily understandable as being an important factor in determining a stock’s price. The higher the dividend payout, other things equal, the greater the value of the stock. The catch here is the phrase “other things equal.” Stocks that pay out a high percentage of earnings in dividends may be poor investments if their growth prospects are unfavorable. Conversely, many of the most dynamic growth companies often pay no dividends. Some companies tend to buy back their shares rather than increasing their dividends. For two companies whose expected growth rates are the same, you are better off with the one that returns more cash to the shareholders.
Rule 2: A rational investor should pay a higher price for a share, other things equal, the larger the proportion of a company’s earnings paid out in cash dividends or used to buy back stock.
Determinant 3: The degree of risk. Risk plays an important role in the stock market and that’s what makes the market so fascinating. Risk also affects the valuation of a stock. Some people think risk is the only aspect of a stock to be examined.
The more respectable a stock is—that is, the less risk it has—the higher its quality. Stocks of the so-called blue-chip companies, for example, are said to deserve a quality premium. (Why high-quality stocks are given an appellation derived from the poker tables is a fact known only to Wall Street.) Most investors prefer less risky stocks, and they can command higher price-earnings multiples than their risky, low-quality counterparts.
Although there is general agreement that the compensation for higher risk must be greater future rewards (and thus lower current prices), measuring risk is well-nigh impossible. This has not daunted the economist, however. A great deal of attention has been devoted to risk measurement.
According to one well-known theory, the bigger the swings—relative to the market as a whole—in an individual company’s stock prices (or in its yearly returns, including dividends), the greater the risk. For example, a nonswinger such as Johnson & Johnson gets the Good Housekeeping seal of approval for “widows and orphans.” That’s because its earnings are relatively stable during recessions, and its dividend is secure. Therefore, when the market goes down 20 percent, J&J usually trails with perhaps only a 10 percent decline. This stock qualifies as one with less than average risk. Salesforce.com, on the other hand, has a very volatile past record, and it characteristically falls by 30 percent or more when the market declines by 20 percent. The investor gambles in owning stock in such a company, particularly if he may be forced to sell out during unfavorable market conditions.
When business is good and the market mounts a sustained upward drive, however, Salesforce.com can be expected to outdistance J&J. But if you are like most investors, you value stable returns over speculative hopes, freedom from worry about your portfolio over sleepless nights, and limited loss exposure over the possibility of a downhill roller-coaster ride. This leads to a third basic rule of security valuation:
Rule 3: A rational (and risk-averse) investor should pay a higher price for a share, other things equal, the less risky the company’s stock.
I should warn the reader that a “relative volatility” measure may not fully capture the relevant risk of a company. Chapter 9 will present a thorough discussion of this important risk element.
Determinant 4: The level of market interest rates. The stock market does not exist as a world unto itself. Investors should consider how much profit they can obtain elsewhere. Interest rates, if they are high enough, can offer a stable, profitable alternative to the stock market. Consider periods such as the early 1980s when yields on prime-quality corporate bonds soared to close to 15 percent. The expected returns from stock prices had trouble matching these bond rates; money flowed into bonds while stock prices fell sharply. Finally, stock prices reached such a low level that a sufficient number of investors were attracted to stem the decline. Again in 1987, interest rates rose substantially, preceding the great stock-market crash of October 19. To put it another way, to attract investors from high-yielding bonds, stocks must offer bargain-basement prices.*
On the other hand, when interest rates are very low, as they were in the early 2020s, fixed-interest securities provide little competition for stocks and stock prices tend to be relatively high. This justifies the last basic rule of fundamental analysis:
Rule 4: A rational investor should pay a higher price for a share, other things equal, the lower the interest rates.
The four valuation rules imply that a security’s firm-foundation value (and its price-earnings multiple) will be higher the larger the company’s growth rate and the longer its duration; the larger the dividend payout for the firm; the less risky the company’s stock; and the lower the general level of interest rates.
In principle, such rules are very useful in suggesting a rational basis for stock prices and in giving investors some standard of value. But before we even think of using these rules, we must bear in mind three important caveats.
Caveat 1: Expectations about the future cannot be proven in the present. Predicting future earnings and dividends is a most hazardous occupation. It is extremely difficult to be objective; wild optimism and extreme pessimism constantly battle for top place. In 2008, the economy was suffering from severe recession and a worldwide credit crisis. The best that investors could do that year was to project modest growth rates for most corporations. During the Internet bubble in the late 1990s and early 2000, investors convinced themselves that a new era of high growth and unlimited prosperity was a foregone conclusion.
The point to remember is that no matter what formula you use for predicting the future, it always rests in part on the indeterminate premise. As Samuel Goldwyn used to say, “Forecasts are difficult to make—particularly those about the future.”
Caveat 2: Precise figures cannot be calculated from undetermined data. It stands to reason that you can’t obtain precise figures by using indefinite factors. Yet to achieve desired ends, investors and security analysts do this all the time.
Take a company that you’ve heard lots of good things about. You study the company’s prospects, and you conclude that it can maintain a high growth rate for a long period. How long? Well, why not ten years?
You then calculate what the stock should be “worth” on the basis of the current dividend payout, the expected future growth rate, and the general level of interest rates, perhaps making an allowance for the riskiness of the shares. It turns out to your chagrin that the price the stock is worth is just slightly less than its present market price.
You now have two alternatives. You could regard the stock as overpriced and refuse to buy it, or you could say, “Perhaps this stock could maintain a high growth rate for eleven years rather than ten. After all, the ten was only a guess in the first place, so why not eleven years?” And so you go back to your computer, and lo and behold you now come up with a worth for the shares that is larger than the current market price.
The reason the game worked is that the longer one projects extraordinary growth, the greater is the stream of future dividends. Thus, the present value of a share is at the discretion of the calculator. If eleven years was not enough, twelve or thirteen might well have sufficed. There is always some combination of growth rate and growth period that will produce any specific price. It is intrinsically impossible to calculate the intrinsic value of a share. There is, I believe, a fundamental indeterminateness about the value of common shares even in principle. God Almighty does not know the proper price-earnings multiple for a common stock.
Caveat 3: What’s growth for the goose is not always growth for the gander. The difficulty comes with the value the market puts on specific fundamentals. It is always true that the market values growth, and that higher growth rates induce larger multiples. But the crucial question is: How much more should you pay for higher growth?
There is no consistent answer. In some periods, as in the early 1960s and 1970s, when growth was thought to be especially desirable, the market was willing to pay an enormous price for stocks exhibiting high growth rates. At other times, such as the late 1980s and early 1990s, high-growth stocks commanded only a modest premium over the multiples of common stocks in general. By early 2000, the growth stocks making up the NASDAQ 100 Index sold at triple-digit price-earnings multiples. Growth can be as fashionable as tulip bulbs, as investors in growth stocks learned painfully.
From a practical standpoint, the rapid changes in market valuations that have occurred suggest that it would be very dangerous to use any one year’s valuation relationships as an indication of market norms. However, by comparing how growth stocks are currently valued with historical precedent, investors should at least be able to isolate those periods when a touch of the tulip bug has smitten investors.
WHY MIGHT FUNDAMENTAL ANALYSIS FAIL TO WORK?
Despite its plausibility and scientific appearance, there are three potential flaws in this type of analysis. First, the information and analysis may be incorrect. Second, the security analyst’s estimate of “value” may be faulty. Third, the stock price may not converge to its value estimate.
The security analyst studying each company and consulting with industry specialists will receive a great deal of fundamental information. Some critics have suggested that, taken as a whole, this information will be worthless. What investors make on the valid news (assuming it is not yet recognized by the market) they lose on the bad information. Moreover, the analyst wastes considerable effort collecting the information, and investors pay transactions fees acting on it. Security analysts may also be unable to translate correct facts into accurate estimates of future earnings. A faulty analysis of valid information could throw estimates of the rate of growth of earnings and dividends far wide of the mark.
The second problem is that even if the information is correct and its implications for future growth are properly assessed, the analyst might make a faulty value estimate. It is virtually impossible to translate specific estimates of growth into a single estimate of intrinsic value. Indeed, attempts to obtain a measure of fundamental value may be an unrewarding search for a will-o’-the-wisp. All the information available to the security analyst may already be reflected. Any difference between a security’s price and its “value” may result from an incorrect estimate of value.
The final problem is that, even with correct information and value estimates, the stock you buy might still go down. For example, suppose that Biodegradable Bottling Company is selling at 30 times earnings, and the analyst estimates that it can sustain a long-term growth rate of 25 percent. If, on average, stocks with 25 percent anticipated growth rates are selling at 40 times earnings, the fundamentalist might conclude that Biodegradable was a “cheap” stock and recommend purchase.
But suppose, a few months later, stocks with 25 percent growth rates are selling in the market at only 20 times earnings. Even if the analyst was correct in his growth-rate estimate, his customers might not gain, because the market revalued its estimates of what growth stocks were worth. The market might correct its “mistake” by revaluing all stocks downward, rather than raising the price for Biodegradable Bottling.
Such changes in valuation are not extraordinary—these are the routine fluctuations in market sentiment that were experienced in the past. Not only can the average multiple change rapidly for stocks in general, but so can the premium assigned to growth. Clearly, then, one should not take the success of fundamental analysis for granted.
USING FUNDAMENTAL AND TECHNICAL ANALYSIS TOGETHER
Many analysts use a combination of techniques to judge whether individual stocks are attractive for purchase. One of the most sensible procedures can easily be summarized by the following three rules. The persistent, patient reader will recognize that the rules are based on principles of stock pricing I have developed above.
Rule 1: Buy only companies that are expected to have above-average earnings growth for five or more years. An extraordinary long-run earnings growth rate is the single most important element contributing to the success of most stock investments. Amazon, Netflix, and practically all the other really outstanding common stocks of the past were growth stocks. Difficult as the job may be, picking stocks whose earnings grow is the name of the game. Consistent growth not only increases the earnings and dividends of the company but may also increase the stock’s multiple. Thus, the purchaser of a stock whose earnings begin to grow rapidly may realize a potential double benefit—both the earnings and the multiple may increase.
Rule 2: Never pay more for a stock than its firm foundation of value. While I have argued, and I hope persuasively, that you can never judge the exact intrinsic value of a stock, many analysts feel that you can roughly gauge when a stock seems to be reasonably priced. Generally, the earnings multiple for the market as a whole is a helpful benchmark. Growth stocks selling at multiples in line with or not very much above this multiple often represent good value.
There are important advantages to buying growth stocks at very reasonable earnings multiples. If your growth estimate turns out to be correct, you may get the double bonus I mentioned in connection with Rule 1: The price will tend to go up simply because the earnings went up, but also the multiple is likely to expand. Hence, the double bonus. Suppose, for example, you buy a stock earning $1 per share and selling at $7.50. If the earnings grow to $2 per share and if the price-earnings multiple increases from 7½ to 15 (in recognition that the company now can be considered a growth stock), you don’t just double your money—you quadruple it. That’s because your $7.50 stock will be worth $30 (15, the multiple, times $2, the earnings).
Now consider the other side of the coin. There are special risks in buying “growth stocks” that the market has already recognized and has bid up the price-earnings multiple to a hefty premium over that accorded more run-of-the-mill stocks. The problem is that the very high multiples may already fully reflect the growth that is anticipated, and if the growth does not materialize and earnings in fact go down (or grow more slowly), you will take an unpleasant bath. The double benefits that are possible if the earnings of low-multiple stocks grow can become double damages if the earnings of high-multiple stocks decline.
What is proposed is a strategy of buying unrecognized growth stocks whose earnings multiples are not at a premium over the market. Even if the growth doesn’t materialize and earnings decline, the damage is likely to be only single if the multiple is low to begin with, whereas the benefits may double if the growth materializes. This is an extra way to put the odds in your favor.
Peter Lynch, the very successful but now retired manager of the Magellan Fund, used this technique to great advantage during the fund’s early years. Lynch calculated each potential stock’s P/E-to-growth ratio (or PEG ratio) and would buy for his portfolio only those stocks with high growth relative to their P/Es. This was not simply a low P/E strategy, because a stock with a 50 percent growth rate and a P/E of 25 (PEG ratio of ½) was deemed far better than a stock with 20 percent growth and a P/E of 20 (PEG ratio of 1). If one is correct in one’s growth projections, and for a while Lynch was, this strategy can produce excellent returns.
We can summarize the discussion thus far by restating the first two rules: Look for growth situations with low price-earnings multiples. If the growth takes place, there’s often a double bonus—both the earnings and the multiple rise, producing large gains. Beware of very high multiple stocks in which future growth is already discounted. If growth doesn’t materialize, losses are doubly heavy—both the earnings and the multiples drop.
Rule 3: Look for stocks whose stories of anticipated growth are of the kind on which investors can build castles in the air. I have stressed the importance of psychological elements in stock-price determination. Individual and institutional investors are not computers that calculate warranted price-earnings multiples and print out buy and sell decisions. They are emotional human beings—driven by greed, gambling instincts, hope, and fear in their stock-market decisions. This is why successful investing demands both intellectual and psychological acuteness.
Stocks that produce “good feelings” in the minds of investors can sell at premium multiples for long periods, even if the growth rate is only average. Those not so blessed may sell at low multiples for long periods, even if their growth rate is above average. To be sure, if a growth rate appears to be established, the stock is almost certain to attract some type of following. The market is not irrational. But stocks are like people—what stimulates one may leave another cold, and the multiple improvement may be smaller and slower to be realized if the story never catches on.
So Rule 3 says to ask yourself whether the story about your stock is one that is likely to catch the fancy of the crowd. Is it a story from which contagious dreams can be generated? Is it a story on which investors can build castles in the air—but castles in the air that really rest on a firm foundation?
You don’t have to be a technician to follow Rule 3. You might simply use your intuition or speculative sense to judge whether the “story” on your stock is likely to catch the fancy of the crowd—particularly the notice of institutional investors or individual traders following Internet memes. Technical analysts, however, would look for some tangible evidence before they could be convinced that the investment idea was, in fact, catching on. This tangible evidence is, of course, the beginning of an uptrend or a technical signal that predicts an uptrend.
Although the rules I have outlined seem sensible, the important question is whether they really work. After all, lots of other people are playing the game, and it is by no means obvious that anyone can win consistently.
In the next two chapters, I shall look at the actual record. Chapter 6 will consider the question: Does technical analysis work? Chapter 7 looks at the performance record of fundamentalists. Together they should help us evaluate how much confidence we should have in the advice of professional investment people.
*The point can be made another way by noting that because higher interest rates enable us to earn more now, any deferred income should be “discounted” more heavily. Thus, the present value of any flow of future dividend returns will be lower when current interest rates are relatively high. The relationship between interest rates and stock prices is somewhat more complicated, however, than this discussion may suggest. Suppose investors expect that the rate of inflation will increase from 5 percent to 10 percent. Such an expectation is likely to drive interest rates up by about 5 percentage points to compensate investors for holding fixed-dollar-obligation bonds whose purchasing power will be adversely affected by greater inflation. Other things being the same, this should make stock prices fall. But with higher expected inflation, investors may reasonably project that corporate earnings and dividends will also increase at a faster rate, causing stock prices to rise. A fuller discussion of inflation, interest rates, and stock prices is contained in chapter 13.