Chapter 11
Stock Market
What Are Markets?
-
The stock market. Here, companies sell shares or ownership stakes in their business to the public. Investors buy these shares, and in return acquire a share of ownership in the company, becoming part owners. The money companies raise through the stock market can be used to invest in new projects, research, and development or to pay off debts.
-
The corporate bond market. This market is a bit different. It’s an opportunity for companies to borrow money from investors by issuing bonds. When a company needs funds for expansion, research, or other projects, it can issue bonds as a way to raise that money. A bond is like an IOU: The company promises to pay back the money it borrows, plus interest, to the investors who buy the bonds. The corporate bond market has different types of bonds including “high-yield” or “junk” bonds. These bonds are riskier for investors because they are issued by companies with lower credit ratings, but they often provide higher returns if the company succeeds.
-
The venture capital market. Venture capital (VC) is a type of financing provided to startups and small businesses that have high growth potential. Venture capitalists invest money in these companies in exchange for a share of ownership. The investment enables the startups to grow and expand their operations.
Markets also help to mitigate risk.
Risk Types in Markets
There are several types of risk, some of which are:
-
Equity risk. This is the risk of fluctuations in the prices of individual stocks and the broader stock market, which can be impacted by company performance (such as when Apple has a bad day) as well as trends across industries, broader economic conditions, and how people are feeling (investor sentiment).
-
Interest rate risk. If the Fed moves rates, all sorts of things begin to topple. It can put pressure on stock valuations, as higher rates reduce the value of future cash flows.
-
Systemic risk. If a bank fails, the market is going to have to think about what that means. Systemic risk includes everything from bank failures to broader recessions to regulatory failures—anything that could remove a Jenga block from the overall market stack.
Managing risk is all about making things more stomachable. The stock and bond markets help distribute company risk to investors, the housing market diversifies risk across homeowners, renters, and builders, and the labor market accommodates employees and employers forming the foundation of the economy. Just as the value of money is a collective belief, the behavior of every market is determined by the collective decisions of millions of investors based on their perceptions of reality. Markets reflect the foibles (and triumphs!) of human behavior and decision-making.
Stock Market Versus Economy
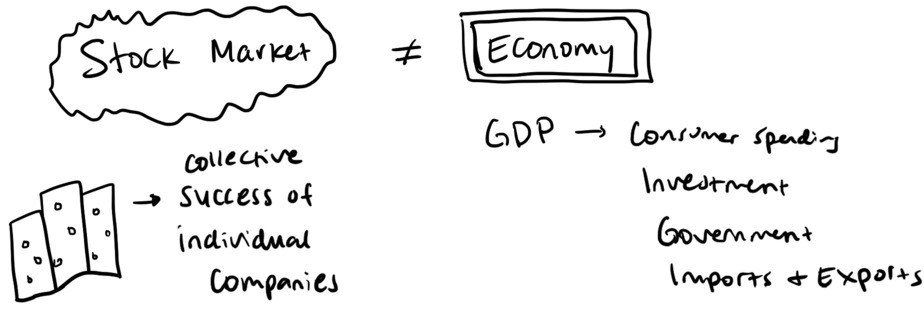
That being said, it’s important to distinguish between the stock market and the economy. People often conflate stock market numbers going up with the success of the broader economy—but they are two very different beasts.
-
The stock market is the physical manifestation of the performance of individual companies. The market determines how money moves throughout the economy and shows how corporations are using money in their business decisions, such as leveraging capital for certain projects or deploying assets in new markets to try to make more money.
-
The economy is measured primarily by growth of the GDP, a measure of consumer spending, government purchases, investment, and net exports.
The stock market is a high-risk, high-reward game. What is sort of funny about the stock market of the early 2020s is that most of the giant companies are really ad salespeople masquerading as big tech. As Ethan Mollick, a professor at the Wharton School, has pointed out, “Compared to industrial giants of the past, Meta, Twitter, & Google are very specialized: they are overwhelmingly advertising firms. Even after all of Google’s new initiatives, it is still 85% ad sales.”
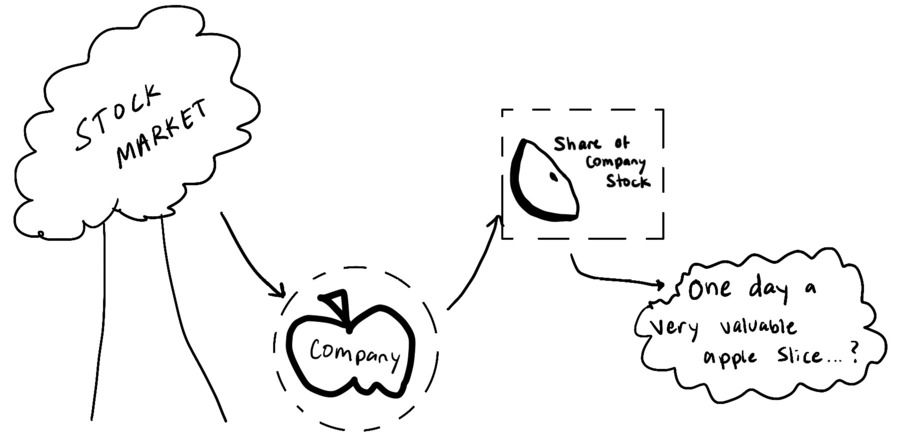
We can think of the stock market as being like an apple tree: Each company is an apple, and each slice of that apple is a share of the company’s stock. So when you buy stock in a company, you are essentially buying a slice of its apple. You own a tiny piece of the company, and when the company makes money, you should make money, too. Ideally, your apple slice will go up in value over time, and one day you will be able to sell it for more than you bought it for.
At the most basic level, a company’s stock is the reflection of the answers to four questions:
-
Do investors believe that people want the thing (or things) a company makes?
-
Do investors believe that the company is good at making the thing?
-
Do investors believe that the company will continue to make the thing in the future?
-
Do investors think the stock of the company that makes the thing is appropriately priced?
When a company goes public, it raises money through an initial public offering (IPO). That’s when it sells its apples to everybody in a public marketplace: the stock market. Privately held companies, especially startups, generally provide employee stock options, but those are not accessible to the general public.
A higher share price doesn’t necessarily mean that a company is worth more overall than other companies. A company’s valuation is the share price multiplied by the number of shares outstanding (the number of shares of company stock that have been issued and are held by shareholders), which equals the market capitalization, or market cap. This is what the company is really worth—the valuation.
Valuation Example
Let’s say that Microsoft stock is trading for $250 and has 8 billion shares outstanding, while Starbucks stock is trading for $100 and has 1 billion shares outstanding. To get the true valuations of the two companies, we need to multiply the share price by the number of shares outstanding:
-
Microsoft market cap = $250 × 8 billion shares = $1.8 trillion
-
Starbucks market cap = $100 × 1 billion shares = $100 billion
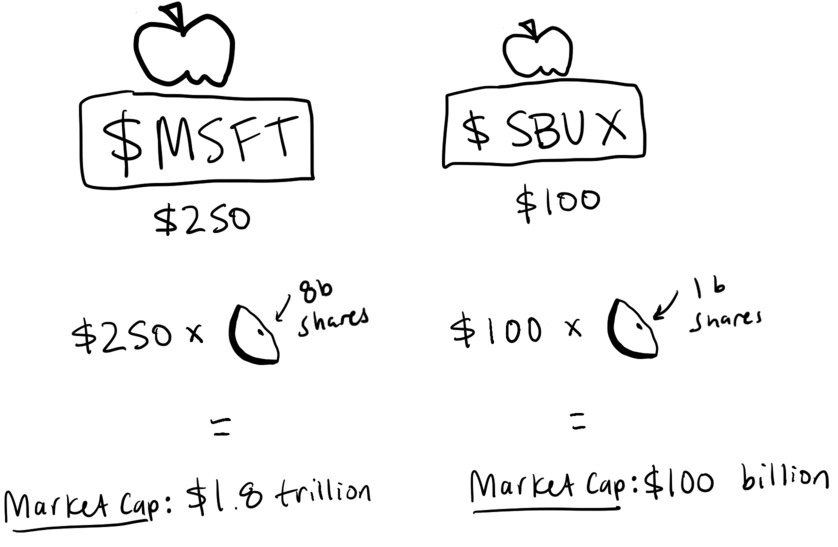
So even though they are kind of close in stock price, Microsoft is a much bigger company and therefore has a much bigger market cap.
Share prices fluctuate! Microsoft might trade all the way down to $100 or all the way up to $400—sometimes in the course of one day but usually over the span of a few weeks. Stocks move around so much because of investor sentiment, or how people are feeling about the companies.
-
If investors think that Microsoft is going to do amazing things, more of them will buy the stock, pushing the stock price up.
-
If they think that Microsoft earnings are going to be underwhelming, they’re more likely to sell their existing shares or even short the stock (bet that the stock price will go down), which is the opposite of owning it. This pushes the stock price down.
Individual stock picking is difficult. A number of unpredictable factors can impact a company’s performance. A natural disaster, fraud, or a pandemic can all result in a company’s share price cratering. The market is not a moral compass, so it doesn’t always respond to fraud or disaster or pandemics the way we think it will. On the flip side, a company’s introducing new products, making an acquisition, or changing its leadership can trigger a run-up in its share price.
When you own a stock, that slice of the apple can make you money in a few different ways:
-
Dividends. When the company makes a profit, it often pays a portion of it to its shareholders; this is called a dividend. Not all companies do this—older, better-established companies are generally the ones that pay dividends—but dividends can provide a tidy little income stream if you own a lot of dividend-paying stocks, especially in relatively stable companies such as Procter & Gamble, ExxonMobil, and Coca-Cola.
-
Retained earnings. If a company is profitable, it can reinvest its profits into itself with an eye toward growing; and ideally, the share price—and the value of your stock—will rise along with the growth of the company. It might invest in new products and developments such as new buildings and new business lines—anything that will help it grow.
-
Capital gains. Usually when a company makes a profit, a lot of people are going to want to buy its stock, driving up the stock price. If at that point you sell your shares for a profit, congratulations—you’ve just made capital gains.
All investors act on limited information. The stock market is the price of hopes and dreams. A couple factors can influence how confident investors feel about realizing their dream of making a profit:
-
Company performance: Four times a year, every public company has to report to its owners (the shareholders) how things are going. It reports how much money the company has made (revenue), how much money it has made after deducting costs (profit), and what the company team thinks will happen in the future (forecasts).
-
Target prices: A lot of the success of certain parts of the finance industry is based on trying to predict how companies’ share price will move ahead of the earnings report being published; analysts will often release share price targets, or what they think will happen to the stock price based on what they think will happen with the earnings report. Analysts trot out all sorts of valuation models, but most of the time, they make educated guesses based on vibes and their gut feeling.
When I worked at Capital Group, I spent a lot of time building valuation models. There are several valuation models; two of the most common are a discounted cash flow model, which estimates a company’s value based on expected future cash flows, and comparable analysis, which compares financial ratios and multiples such as price-to-earnings ratio or enterprise value to earnings before interest, taxes, depreciation, and amortization, or EBITDA, across similar companies. Even for professionals, it can be challenging to figure out what growth rate makes sense based on past data and future expectations. Investment advisers publish the numbers—what they expect Microsoft’s revenue to be, for instance—and if the company misses the target, it can negatively impact the stock price. If the company beats the target, it can positively impact the stock price.
In the long run, a lot of this is noise—a basket of diversified companies known as ETFs is usually the best path for most people to go to profit from the stock market (not investment advice!).
Exchange-Traded Funds
Stocks can be bundled into various financial instruments, such as exchange-traded funds (ETFs). These are baskets of stocks that track various indices, commodities, and asset classes. They reduce the risk of holding any one security. For example, farmers plant multiple crops to safeguard against the failure of a single crop, and many companies offer more than just one product in order to manage risk and achieve balanced outcomes. ETFs serve a similar function by offering diversified investment exposure to hedge against uncertainty.
Is Blackrock Running the World?
ETFs are funny because a lot of people think that BlackRock, one of the top ETF providers, is secretly running the world because it is invested in so many different companies. But BlackRock, although it is powerful, is not telling the companies in its portfolio what to do. It owns a huge number of shares in the largest companies in the world, trillions of dollars’ worth of assets, so many people believe that surely it controls all those companies, right? Well, no. The shares represent its clients’ money; the ultimate owners of the shares that BlackRock or, as another example, Vanguard has in various companies are the people who invest with BlackRock or Vanguard.
In 2022, Vanguard, one of the top ETF providers, was the top holder of 69 percent of the companies in the S&P 500. That doesn’t mean that it is directly managing 69 percent of all companies; it just means that it is holding the stock of those companies in investment products that it then sells to investors. Its officers are on the boards of directors of those companies, helping make strategic decisions and whatnot, but they usually vote for what the company wants to do.
Index Providers
Index providers, such as MSCI, FTSE Russell, and S&P Dow Jones, are extremely important, too, and they work closely with ETF providers. They have a symbiotic relationship, wherein the index providers create various indices to gauge the performance of various markets and the ETF providers use the indices to manage their ETF products. This is important! In November 2017, Bloomberg journalists Tracy Alloway, Dani Burger, and Rachel Evans published an article titled “Index Providers Rule the World—for Now, at Least,” exploring the power of the companies that determine which companies are put in their baskets. As they wrote:
Something else that might be described as imbalanced: the growing clout of index providers such as MSCI, FTSE Russell, and S&P Dow Jones Indices. In a market increasingly characterized by passive investing, these players can direct billions of dollars of investment flows by reclassifying a single country or company, effectively redrawing the borders of markets, shaping the norms of what’s considered acceptable in international finance, and occasionally upsetting the travel plans of government ministers.
Instruments called passive vehicles, which replicate indices, generate huge amounts of inflows for the index providers. It’s the simplest way for most people to get exposure to the market. But it creates problems because the index providers decide which company’s stocks are invested in. As Peru’s former finance minister Alonso Segura Vasi put it, “Investors’ decisions to invest in the market are significantly guided by their decisions, whether they put you in the index or do not put you in the index. They do control the fates of companies’ and countries’ access to capital markets.”
Markets, stocks, ETFs, and other instruments are meant to trade on fundamentals or trade like the company (or bundle of companies) they are tracking profitability-wise, expense-wise, cash flow–wise, and so on; that’s the theory, at least. The discounted cash flow model creates a valuation of the current share price that is based on a certain set of expected cash flows that a company should produce based on its profitability and earnings, a discount rate is calculated, and all of that indicates a present value at which the asset is ultimately priced.
Passive Versus Active
The addition of Tesla, Elon Musk’s electric vehicle company, to the S&P 500 as a large weight was a seminal moment for passive investing—investment strategies that aim to replicate the performance of a market index such as the S&P 500. Active investing is actively choosing which stocks to invest in based on educated guesses based on research with the goal of outperforming rather than simply matching performance.
Tesla’s addition to the S&P 500 index was a notable event due to the company’s high market capitalization and its prominence in the electric vehicle industry. As a result, when it was added to the index, many passive index funds that tracked the S&P 500 had to buy Tesla shares to align their portfolios with the index. That led to increased demand for Tesla stock and a surge in its price, contributing to the so-called Tesla effect. So there was a lot of volatility and trading activity as people bought Tesla stock, leading to a lot of attention to the stock on the part of media, analysts, and retail investors.
But this is where markets get funky. From a performance standpoint, passive indexing has demonstrated its effectiveness over time. Many studies have shown that a significant majority of active fund managers consistently fail to beat their respective benchmark indices, such as the S&P 500. In fact, Morningstar’s U.S. Fund Fee Study reported in 2021 that only 23 percent of active funds outperformed their counterparts from 2010 to 2020.
As a result of the inefficacy of active investing, investors have increasingly turned to passive index funds and ETFs as a way to achieve broad market exposure at a lower cost and with greater diversification. But passive investing creates a sort of loop. As more investors shift toward passive investing strategies, the prices of the stocks included in the popular indices are influenced primarily by the flow of funds into passive funds, rather than the companies’ individual merits. This can lead to price movements that are driven more by market flows than by fundamental factors—and result in a circus.
The Stock Market Is Seven Companies
The industry has also become very concentrated, leading to more circus-ry. Financial markets have gotten really, really big, driven mostly by a few key companies, especially in the United States. According to Jamie Dimon, the CEO of JPMorgan Chase:
I have written before about the diminishing role of public companies in the American financial system. They peaked in 1996 at 7,300 and now total 4,600. Conversely, the number of private U.S. companies backed by private equity firms has grown from 1,900 to 11,200 over the last two decades. And this does not include the increasing number of companies owned by sovereign wealth funds and family offices. This migration is serious and worthy of critical study, and it may very well increase with more regulation and litigation coming. We really need to consider: Is this the outcome we want?
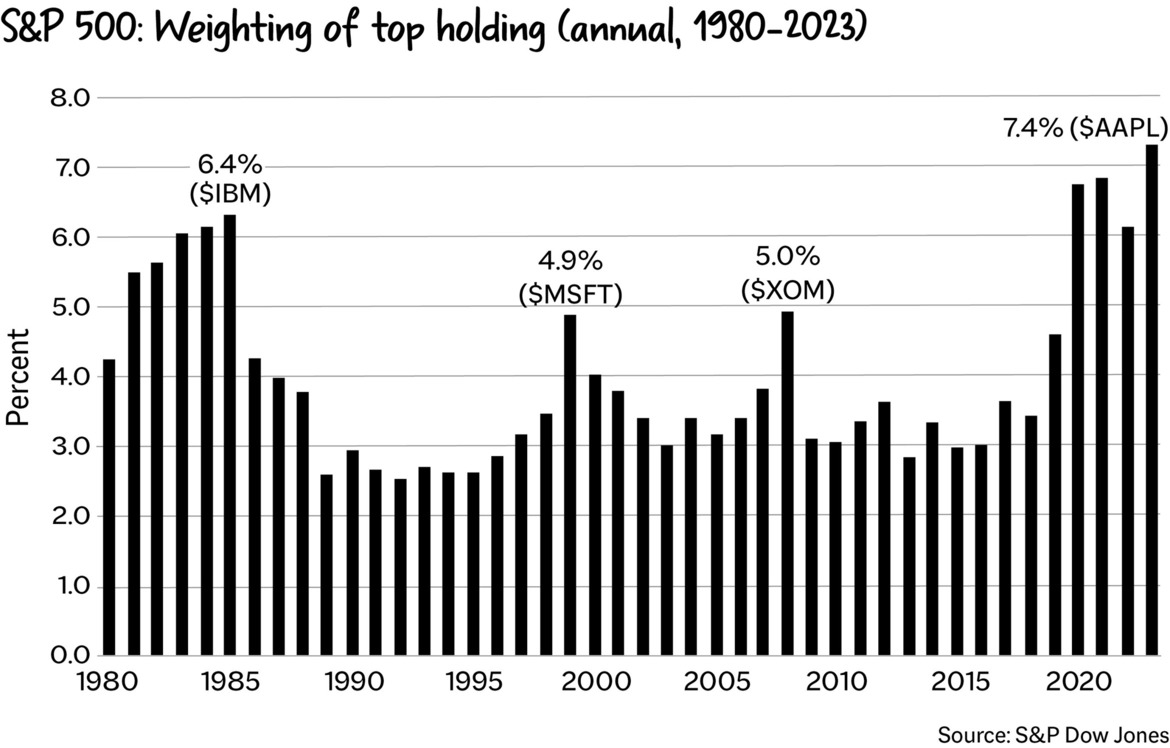
As of 2023, the stock market is dominated by tech companies, including Apple, Meta (formerly known as Facebook), Nvidia, and others. Seven stocks—Apple, Meta, Nvidia, Amazon, Tesla, Microsoft, and Alphabet Inc, Google’s parent company—were 26% of the S&P 500 as of 2023 and made up more than 110% of its gains. Without those seven companies, the S&P 500 would have been down 0.8% versus up 7% on the year through May 2023. Concentration risk is the highest it’s been in decades because the S&P 500’s largest companies make up a significant portion of its overall value—meaning that if those companies fall, so does the market.
Small companies tend to remain private, because, as Dimon highlighted in the letter, “the governance of major corporations is evolving into a bureaucratic compliance exercise instead of focusing on its relationship to long-term economic value. Good corporate governance is critical, and a little common sense would go a long way.”
Markets are bloated. As Michael Pettis tweeted:
Financial markets have grown so large relative to the underlying economies that regulators have no choice but to intervene to protect failing banks, even though this only reinforces further growth in the financial system. Perhaps the solution is not to keep saving the banks, nor even to let them fail, but to take longer-term measures to cut down the size and importance of the financial system in the US and global economies. Banks should be cut down, different sectors of the financial system segregated, financial transactions taxed, and capital controls implemented that limit massive hot money flows. Critics will say that these measures will reduce the efficiency of the financial system, and they are right, but increased efficiency in the financial system has long ago stopped meaning increased efficiency in allocating capital productively, and has meant instead increased efficiency in financial flows.
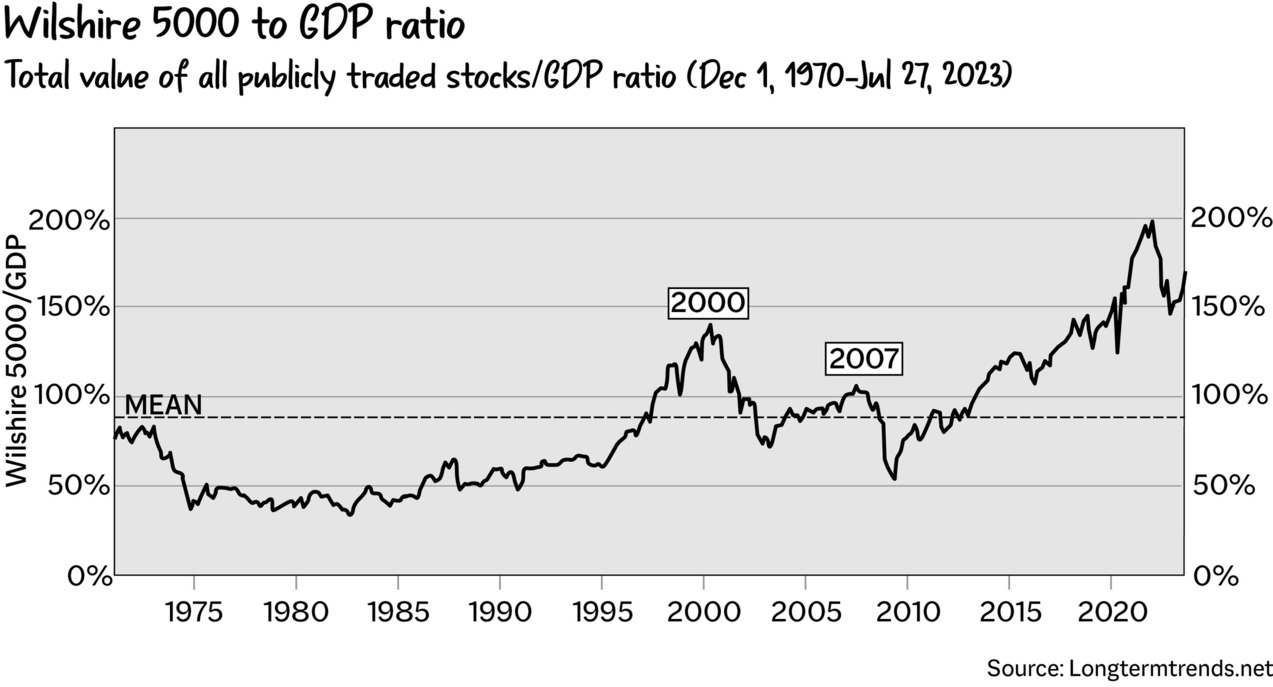
You can see this trend in the chart of market capitalization versus GDP shown below, also known as the “Buffett Indicator,” a number that Warren Buffett prefers to look at to get a sense of where valuations stand at any given moment. This is the total market value of all publicly traded stocks within a country divided by that country’s gross domestic product, and as you can see, it’s high. The market is overvalued relative to GDP, and the stock market is growing faster than the economy.
The unfortunate thing about markets is that they have sort of devolved into a “vibe fest,” deviating from their original purpose. They were designed to be practical—yet relatively boring—tools for people to get money to do useful economic things. But they’ve largely separated from that, making concepts like intrinsic value and the efficient markets hypothesis mostly useless.
Efficient (And Inefficient) Markets
The efficient market hypothesis, formulated by Eugene Fama in the 1960s, states that prices reflect all available information, stocks always trade at their fair value, and the only way to outperform the market is through accepting higher risk.
However, the stock market is a game that increasingly reflects our artificial interests. Back in 2021, companies such as GameStop and AMC Entertainment Holdings exemplified this phenomenon. The two companies’ business models didn’t have any inherent value, but their stock price was bid up for speculative purposes (investors knew that the companies would never be profitable, but it’s a fun game to play).
In 2021, reality evaporated from pretty much all markets. There was no concept of fundamentals or company valuations based on the earnings the companies produced or the cash flows they achieved. The stock market was instead based on internet points and social media fervor.
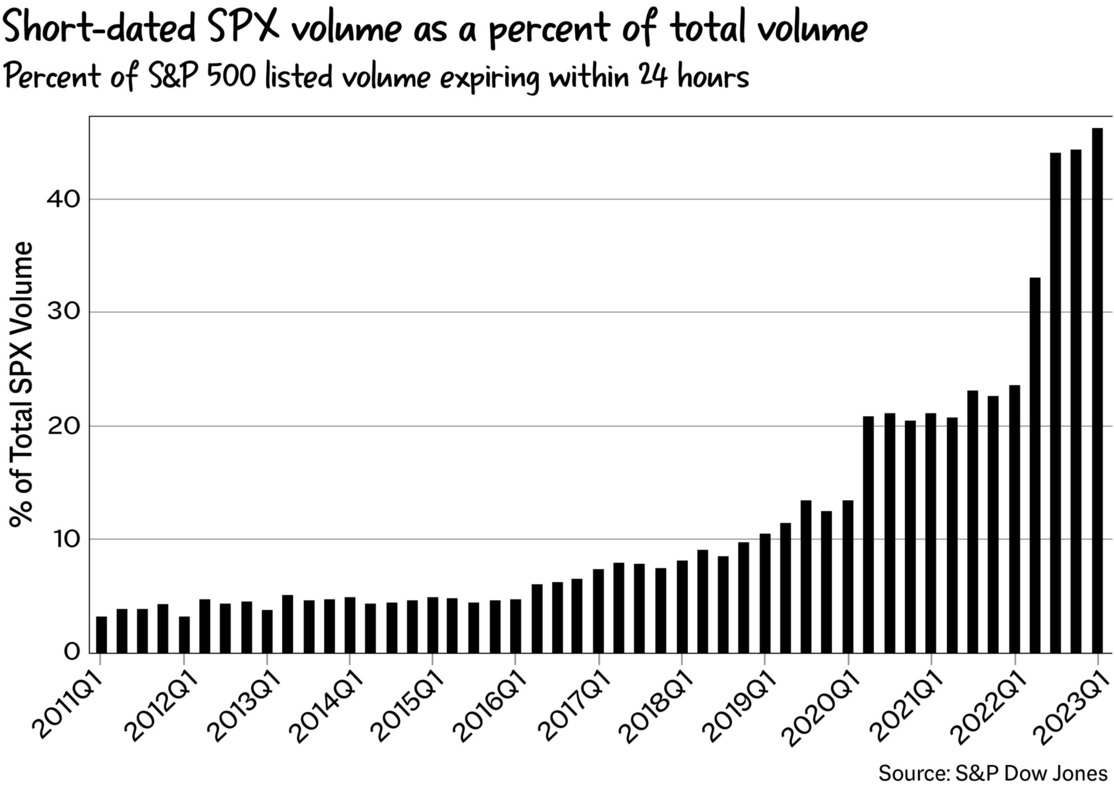
We can see this in zero days to expiration (0DTE) options activity, put- and-call options on individual stocks that expire within twenty-four hours—basically, a gauge of speculative activity based on earnings releases or economic data reports. As the number spikes, it means that more speculative activity is occurring.
The year 2021 was a very speculative cycle, in which the stock market was treated like a casino. Retail investors were a big part of the memefication story. At one point in 2020, they made up 20 to 25 percent of all value traded in the market, up from 10 to 15 percent from 2019, according to Citadel Securities. GameStop put investors at the forefront of the conversation, giving them the power to move the market.
It was clear in the numbers that people were paying attention to the stock market. Robinhood added 6 million users in less than two months. Call option values were at all-time highs. There was widespread accessibility to margin debt and information. Online brokers and low commissions facilitated flow. Elizabeth Lopatto, a senior editor at The Verge, explained it this way:
Are there any people under the age of 40 who have ever thought markets were something besides a casino? Meme trades aren’t the cause of widespread distrust, they’re the symptoms of it. And those people under 40 who think finance is for gambling? They’re the lucrative part of Robinhood’s user base. Legal issues aside, it seems like Robinhood has a good business model for monetizing financial nihilism—which is the kind of thing investors might get excited about.
GameStop and AMC are a perfect example of reflexivity and animal spirits. Their story is emblematic of how confusing markets can be and how nothing makes sense if you think of “sense” in the traditional terms of logic and knowledge.
What Happened in 2021?
Speculation is a key element of our human nature. Collective belief is the driver of asset value in a lot of cases! If people believe that a stock or crypto token should go up by X percent and funnel their dollars into it, more people will be like, “What’s going on over there?” (this is reflexivity, which I talked about earlier!) and then—boom!—its price will go up.
In 2021, a lot of the value drive was based on “But what if this [enter random stock or cryptocurrency] becomes very, incredibly valuable?” Our human brains love speculation—think about how many people play the lottery or gamble. We have FOMO. We have a collective belief in memes. We have the idea that if you aren’t playing the game, you won’t win, so you might as well toss a few coins into the ring.
And our society has a get-rich-quick mindset, which increases the likelihood of our speculating instead of investing. There is a difference between investment and speculation and gambling, based mostly on the probability of success.
-
Investing: If you put your money into Apple stock with the reasonable expectation that Apple will continue to be an okay company and make money.
-
Speculation: There is a positive expected value: When you speculate on the markets, you put $50 into Dogecoin with the hope of making $500 million. If you invest money in something with a high probability of failure and it’s more of a “go to the moon” vibe.
-
Gambling: There is a negative expected value: You gamble with the knowledge that you could lose everything and that the cards will likely not fall in your favor.
Why Did Markets Become a Meme?
What happened with meme stocks and crypto is essential to understanding this difference as trading became memefied through five main factors:
-
Market enthusiasm. This was a function of a lack of consumption opportunities during the pandemic and the proliferation of access to information via Reddit forums and other social media sites.
-
Risk-on sentiment. There were a lot of you only live once (YOLO) vibes during the pandemic because everyone was stuck at home and the concept of life was absurd.
-
Liquidity. About 40 percent of stimulus checks went into the stock market, and of course, any sort of excess creates exuberance.
-
Meme markets. Special purpose acquisition companies (SPACs), NFTs, and GameStop are all “real” products that can be traded, but they were fueled by the power of memes rather than the power of reality.
-
Globalization of markets. For example, FUTU, a Chinese-based fintech company that operates an online brokerage platform that enables users to trade all sorts of financial instruments—specifically, retail investors in China to trade U.S. stocks and other assets—does a huge volume of business.
Financial instruments such as crypto, meme stocks such as AMC and GameStop (ticker symbol: GME), and the whole era of Elon Musk tweeting about random coins are an important lens into this weird era of speculation. There were a lot of people who made life-changing money by investing a few dollars in things such as SHIB coin or Bed Bath & Beyond stock. One of my friends opened a bar with the profits from his trades! And all of this was driven by a collective belief in the value of an asset.
As we saw with GME/AMC/the meme stocks, sometimes things don’t trade purely on the basis of fundamental factors such as financial performance but rather on the basis of speculation and hype. The efficient markets hypothesis bears out only in a perfect world.