Chapter 9
The Labor Market
What Is the Labor Market?
The labor market. It’s really important, because having a job (that pays enough to stay alive, provides some form of healthcare, and enables a person to live the life they want) is really important. And the post-pandemic world was a turning point for how we think about work.
As the dust of the pandemic began to settle, workers began to rise up. As the calendar flipped to 2022, a seemingly paradoxical labor landscape unfurled across much of the world. With headlines screaming about the “Great Resignation” on one hand, and soaring job openings on the other, a central question reverberated: “In an era post-covid, with all its lessons and losses, what do workers really want?”
Millions, whether by choice or circumstance, were reevaluating their place in the working world. Mass resignations, surging strikes, demands for better wages and working conditions, and an amplified quest for work-life balance became the anthems of this labor movement. From Amazon warehouses to Hollywood sets, workers demanded more than just paychecks. They sought respect, flexibility, and a redefined sense of purpose. As industries scrambled to recalibrate, the power dynamics of employer-employee relationships were thrust into the spotlight.
The labor market runs on supply and demand, with employees supplying skills and employers paying for them. Our economic prosperity, bargaining power, and ability to find meaningful work flow from the state of the labor market. It’s a linchpin in how the rest of the economy functions, but of course, it’s in constant flux.
Shiny new jobs pop up thanks to technological advancements, and old jobs are aged out by those same technological advancements (looking at you, AI!). This chapter explores how the health of the labor market is measured, who pulls its strings (and what strings they should be pulling), and the myriad ways it impacts our economic prosperity and well-being.
When I interviewed Mary Daly, the president and CEO of the Federal Reserve Bank of San Francisco, about the labor market in March 2023, here’s what she told me.
Mary: …The best thing we can do for Americans is provide a sustainable path of growth that gives people opportunities to change jobs, to find the career that matches their interest, to grow their careers over time, but then to bring that paycheck home week after week and be able to afford things that they afforded last week. And right now we can’t do that. So I think that’s the point of balancing the economy. You balance the economy to give people a full slate of options, not just a positive here and a take back there.
What President Daly was saying matters for how we talk about the labor market, because the Fed shapes so much of how the labor market functions. The Fed is focused on giving people optionality—so that they are able to afford being alive (by getting inflation down) and that people are able to get a job (by supporting the labor market). But the labor market is weird, riddled with anomalies and strange dynamics, especially in the postcovid era. There are a lot of ways to slice and dice the labor market. There are a few main ways to measure it, such as asking people if they have a job and asking companies if they are hiring. The analysis process is broad and often reveals gaps between private and public data, openings and quits, and survey response rates.
Key Labor Market Metrics
The Unemployment Rate
The total labor force is calculated as the number of unemployed people actively seeking work plus the number of employed people (around 166 million people in early 2023, a complete recovery from the April 2020 figure of 156 million people).
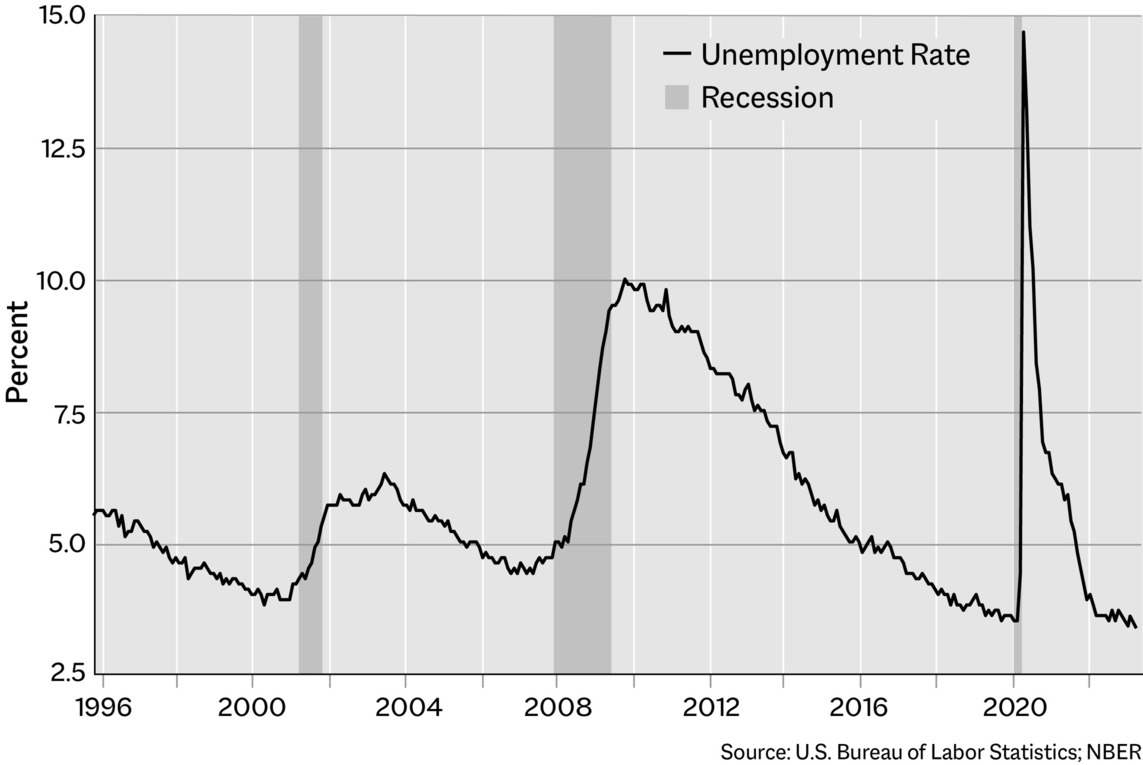
There are two things to know about the unemployment rate:
-
Discouraged Workers: The unemployment rate doesn’t capture individuals who have become discouraged and given up on actively seeking work due to a lack of job opportunities or other factors. These discouraged workers are often considered “marginally attached” to the labor force. They would like to work but have stopped actively searching for jobs and, therefore, aren’t in the labor force.
-
Underemployment: While the unemployment rate focuses on whether individuals have a job or not, it fails to account for the quality of those jobs or whether they match the educational attainment or skills of the workers. This can include overqualified people working in low-skilled jobs (like a doctor working at a coffee shop), part-time workers who want full-time employment, or workers in temporary positions.
A low unemployment rate (3 to 4 percent) is generally considered to be good! It means that the labor market is strong, employees are moving and grooving, and job opportunities are widely available. A higher unemployment rate (6 to 7 percent) represents a weaker labor market, indicating that job opportunities are not as plentiful and wages will tick lower.
In early 2023, the total labor force was around 166 million people, representing a complete recovery from the April 2020 figure of 156 million people. The unemployment rate is the number of unemployed people divided by the total labor force. The unemployment rate was at a near record low in early 2023, peaking at 14.7 percent in April 2020 and hovering around 3.4 percent nearly three years later—an incredible recovery!
The Labor Force Participation Rate
The labor force participation rate (LFPR) is another good metric to give us insight into the labor market. It is an estimate of the active workforce of the economy, which is the number of people sixteen years of age or older employed or seeking employment divided by the total noninstitutionalized civilian working-age population.
The higher this number is, the higher the number of people who are part of the population that is actively working. Which is good! When the labor force participation rate falls, it means that people are leaving the workforce. This trend can create pressure on certain sectors of the economy, as there may not be enough workers to fill the available vacancies.
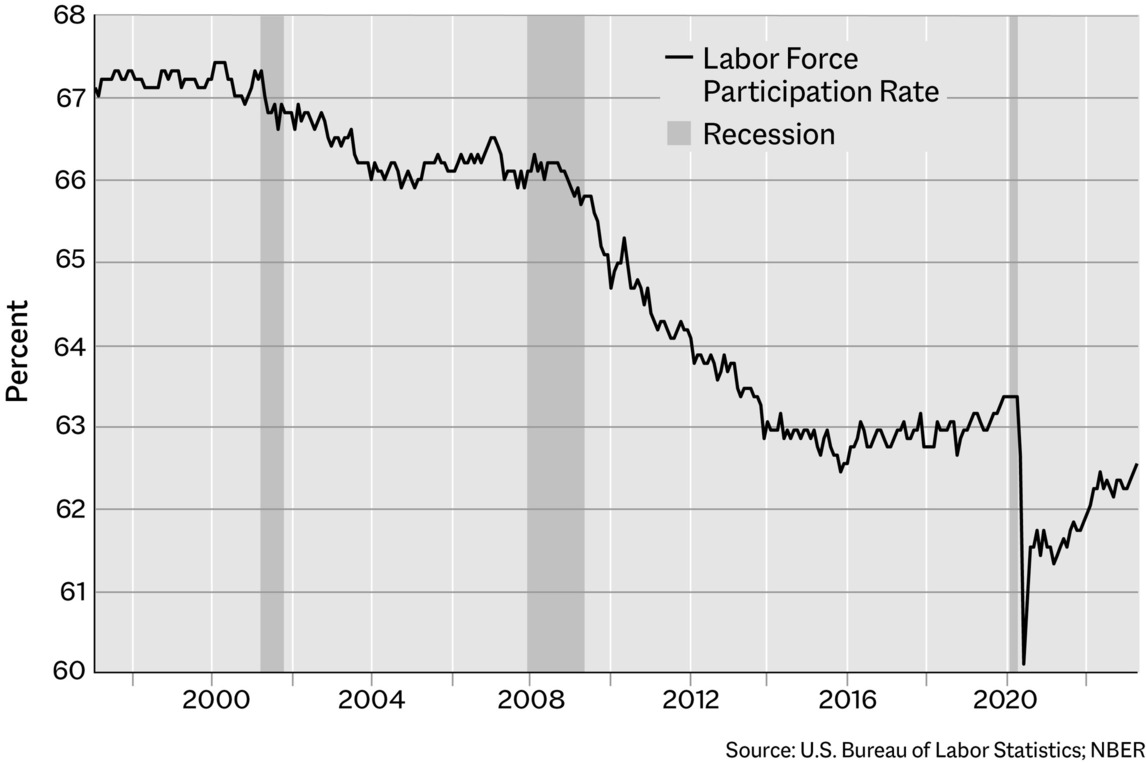
The LFPR was around 62.6 percent in early 2023, which was still relatively low historically (it was closer to 70 percent in the early 2000s but never fully recovered after the 2008 crash). It’s also improving, which has bolstered the broader economy in the post-pandemic era, but part of the reason that it has not fully recovered is due to the aging population. This demographic shift means a larger proportion of the population is retiring, leading to a natural decrease in labor force participation.
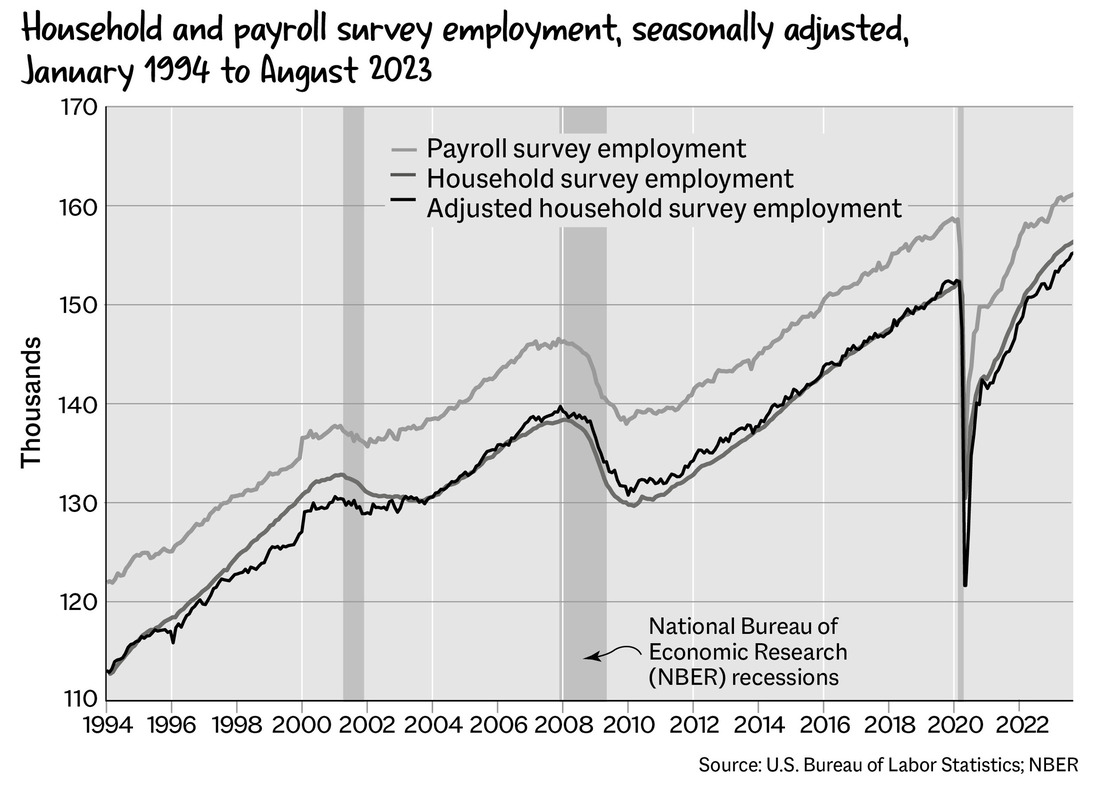
Surveys and Measurements
There are two main surveys that tell us if people have a job:
-
Current Population Survey (CPS). This monthly survey asks approximately 60,000 households if they have a job to estimate the number of employed people in the population as a whole.
-
Current Employment Statistics (CES) survey. This survey asks approximately 122,000 businesses and government agencies how many people they have on payroll to estimate the number of jobs in the population as a whole.
The two surveys diverge, mostly because the household survey has a broader definition of employment and is more prone to sampling error because it surveys only 60,000 households (which can be more than one person). However, both surveys are revised regularly, and there are a number of statistical processes to make sure that the metrics capture what they are meant to.
The Employment Situation Summary, which is published by the Bureau of Labor Statistics once a month, incorporates both surveys and focuses on a broad view of the labor market. When combined, the two surveys tell us about:
-
Nonfarm payrolls: The number of paid workers in the United States, excluding farm workers, private household employees, and nonprofit organization employees
-
Unemployment rate: The percentage of the labor force that is unemployed
-
Labor force participation rate: The percentage of the working-age population (sixteen years of age and older) that is employed or actively seeking employment
-
Average hourly earnings: The average wage earned by workers on an hourly basis
-
Average workweek: The average number of hours worked by employees in a week
-
Employment by industry: Employment data by sector, such as manufacturing, construction, retail, and healthcare
There are a variety of other measurements, too, including:
-
Job Openings and Labor Turnover Survey (JOLTS). This report, published by the Bureau of Labor Statistics once a month with a two-month lag (so the June report is published in August), focuses on the demand for labor and the flow of workers. It includes:
-
Job openings: The number of open job positions on the last business day of the reference month
-
Hires: The number of employees hired during the reference month
-
Separations, including quits: The number of employees who left their jobs during the reference month and quits (the number of employees who voluntarily left their jobs during the reference month)
-
So there is all this data, and we still have a hard time figuring out exactly what the labor market is doing. As Jerome Powell, the chair of the Federal Reserve, said in November 2022, “We talk a lot about vacancies in the vacancy-to-unemployed rate, but it’s just one, it’s just another data series. It’s been unusually important in this cycle because it’s been so out of line. But so has quits. So have wages. So we look at a very wide range of data on unemployment—on the labor market.”
As Preston Mui, an economist at Employ America, explained the difference between quits and job openings: “Job openings, as measured by JOLTS, don’t tell the whole story. Crucially, they don’t contain any information about recruitment efforts.”
The job openings figures are strange, because they’re survey based. Employ America has long argued that metrics such as the quit rate, or how many people have quit their job, are much better indicators of the health of the labor market than the number of job openings available. Quits and hires data are cleaner than job opening data because they aren’t reliant on the inherent bias that comes with people responding to surveys.
It therefore provides good (but not great) insights.
The numbers can be manipulated, too. A March 2023 Wall Street Journal article reported that some companies were leaving job openings up on websites to make it look as though they were growing, even when they had no intention of hiring. There’s also a gap between what the Bureau of Labor Statistics reports for job openings (the aforementioned JOLTS) and what is reported by private companies like ZipRecruiter, which base their reports on listings on their sites.
The data we see aren’t always representative of reality. We all engage with the labor market, whether it be directly or indirectly, as it’s how most of us stay alive. And, of course, we can’t talk about jobs without talking about wages.
Wages
The labor market has changed a lot in recent years. In the past, it was possible for baby boomers to buy a new house right out of college, work for the same company for forty years, and raise 2.5 kids on their 9-to-5 salary. That isn’t true anymore. Instead, it’s become clear that workers are really not respected in many different ways.
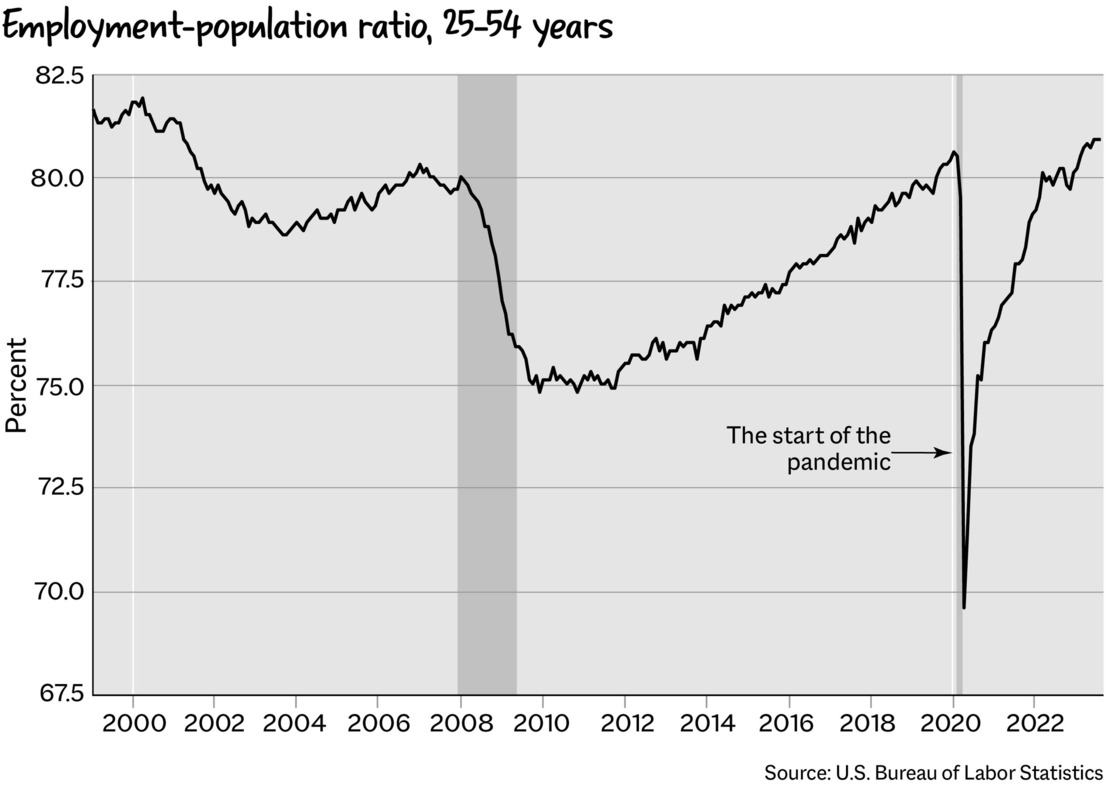
In the United States, the cost of childcare has skyrocketed, there are essentially no parental leave options, and wages haven’t kept up with inflation for many people. One can moan and say, “Companies need to maintain their profit margins, therefore they really shouldn’t pay people a living wage,” but, like, come on. Also, the “nobody wants to work anymore” trope is a straight-up lie. People do want to work; the employment rate of twenty-five to fifty-four-year-olds who have full-time jobs is back at pre-pandemic levels, but nobody wants to work for $7 an hour.
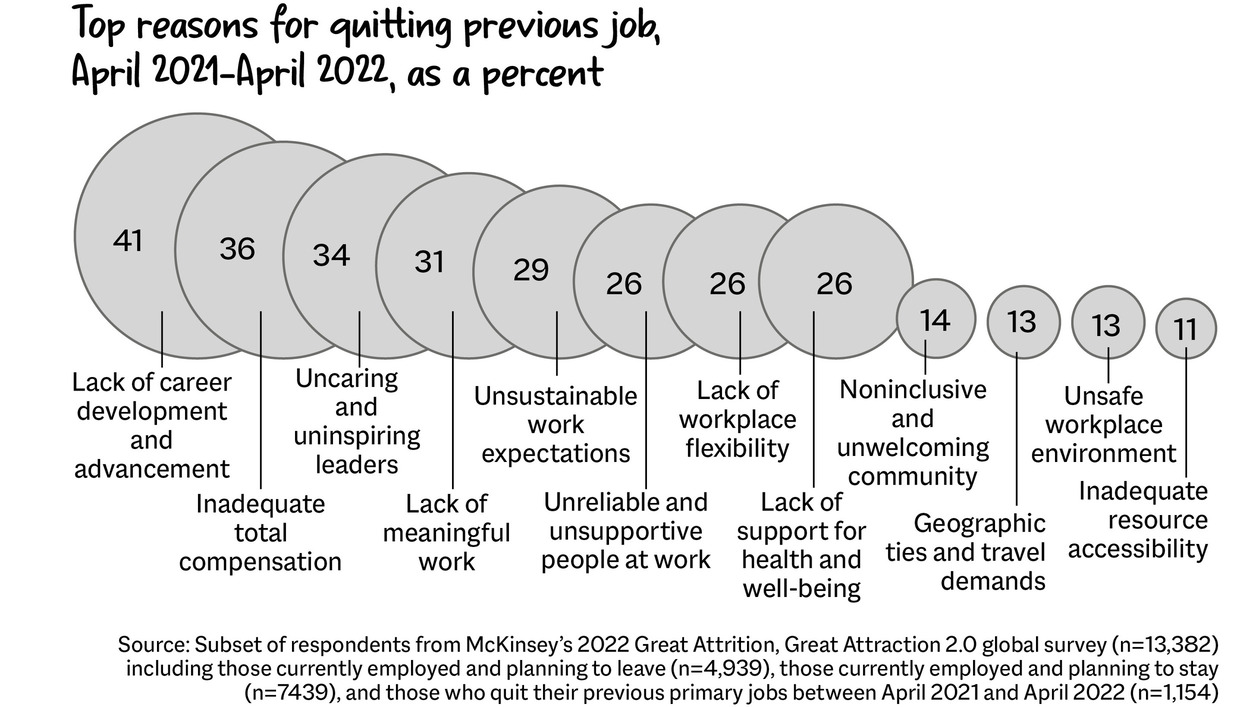
People want to be compensated via wages and benefits for the work they do. According to a McKinsey & Company survey, the main reason people leave their jobs is due to limited opportunities for career advancement and development; they want to work and grow, but there are no options to pursue this.
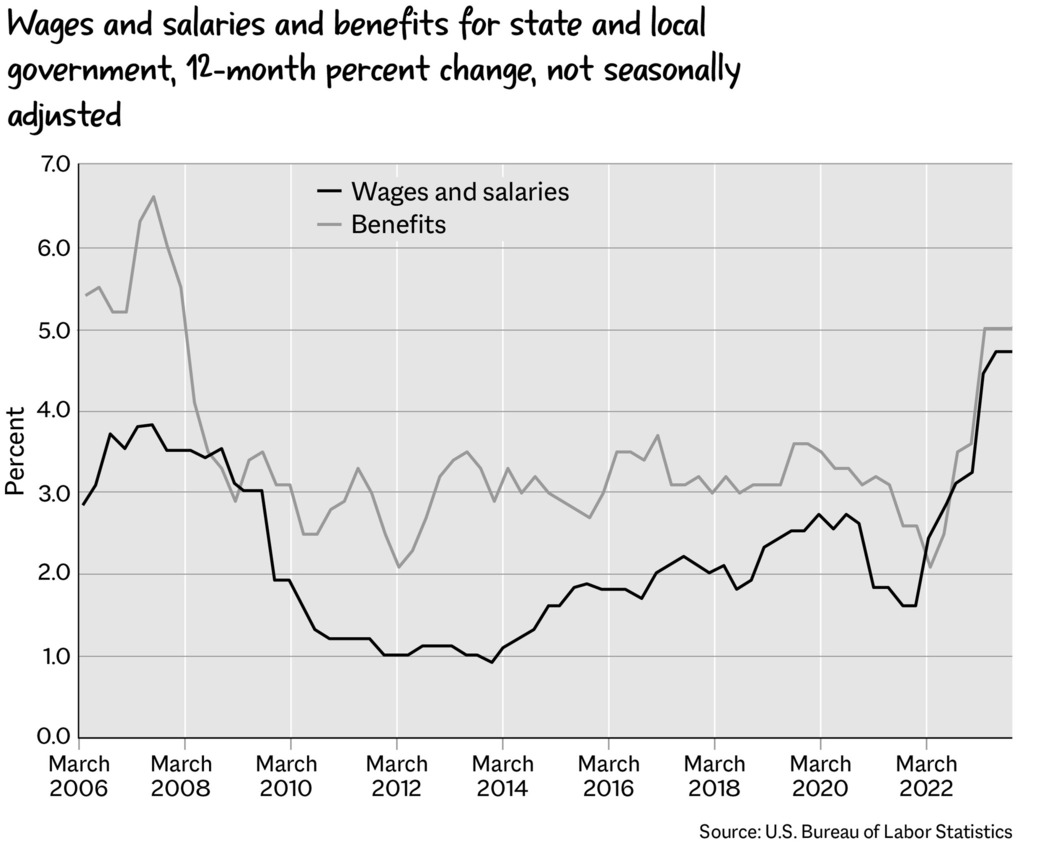
Wage growth has been kind of flat for a while. The Employment Cost Index (ECI) provides insights into cost pressures on employers as well as wage growth and general labor market dynamics. As you can see in the following chart, wages have ticked up since 2021 (nominally, at least).
Real wages, or wages adjusted for inflation, give us a better sense of how income growth is keeping up with the cost of living. When real wages stagnate or grow at a slower pace than inflation, the disconnect can contribute to income inequality as it erodes the ability of the middle and lower classes to keep up with continuously rising costs.
During the pandemic, the wealthiest 1 percent of households in the United States saw their wealth increase by 35 percent, while the bottom 50 percent saw their wealth decrease by 4 percent. For example, the former CEO of Amazon, Jeff Bezos, saw his net worth increase by $70 billion during the pandemic, while many of his employees struggled to make ends meet.
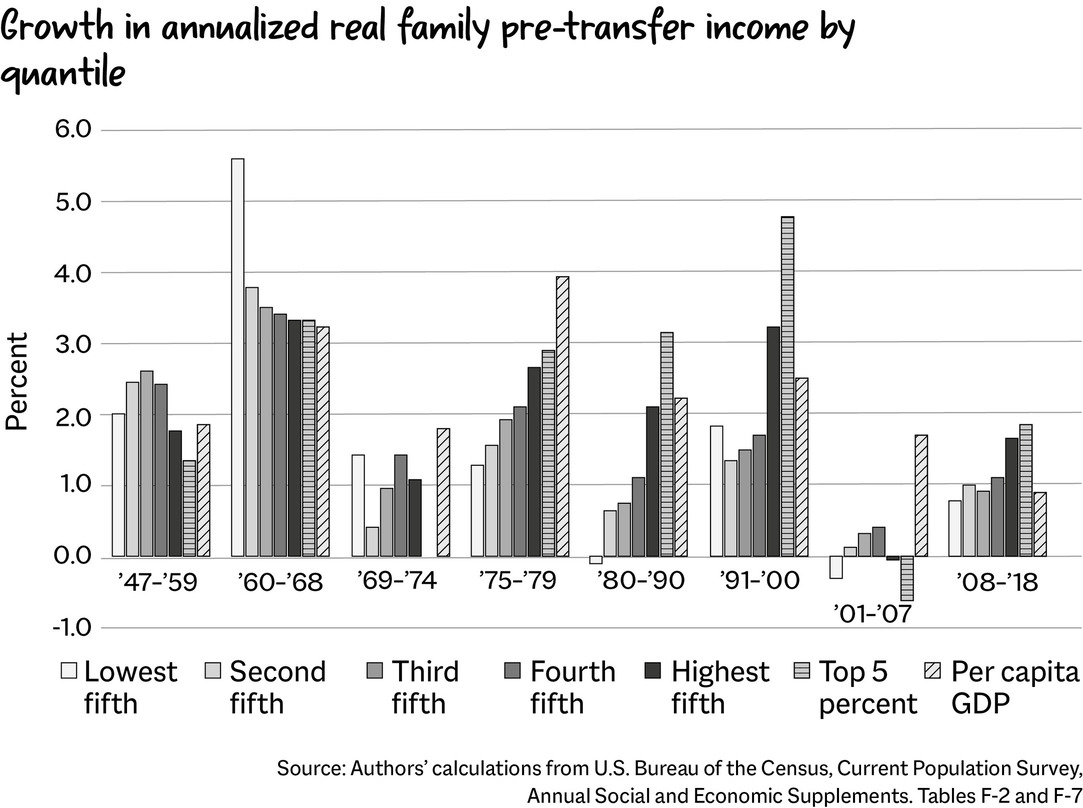
The situation has gotten worse over time. As Carter Price and Kathryn Edwards noted in their 2020 paper “Trends in Income from 1975 to 2018,” if income growth since 1975 had remained as equitable into the 2000s, the aggregate income would have been $2.5 trillion higher—or enough to double the median income, equating to roughly $1,000 more a month in pay for the average employee.
Such disparities in real wages—and the concentration of wealth—create a lot of problems for social mobility and exacerbate economic inequality. Depressed wages are harmful for many, many reasons.
The Minimum Wage
In the United States, there is a federal minimum wage, the legally mandated minimum hourly wage that employers must pay to employees. It has remained stagnant for a long time at $7.25 an hour, as of late 2023, but the state minimum wage varies from state to state.
-
76.1 million Americans, or about 55 percent of the labor force, earn hourly wages, according to the 2021 BLS report “Characteristics of Minimum Wage Workers, 2021.”
-
Throughout the 1960s and 1970s, the minimum wage—in terms of 2019 dollars—was well above $8.00 per hour and peaked in 1968 at $11.69, which is well above the current minimum wage of $7.25 (where it has stayed since 2009).
-
If the minimum wage had moved with productivity growth (as it did up until 1968), it would now be about $24.00 per hour.
-
Low-wage jobs have increased since the 1970s, while middle-wage jobs have declined, exacerbating the increasing gap in wealth distribution.
With this historical context in mind, what is the true cost of a too-low minimum wage?
To begin with, there is no place in the United States where a minimum-wage worker can afford a two-bedroom apartment, according to the National Low Income Housing Coalition. This is important, as most people need a two-bedroom at some point, as they have kids and seek larger spaces to grow into—something I will talk about more in the chapter on housing.
A worker would have to make $24.00 an hour to comfortably (aka have enough income for food, healthcare, housing, and so on) be able to afford a two-bedroom (funnily enough, right in line with the aforementioned “productive wage”) and $20.00 an hour to afford a one-bedroom. That leaves a gap of about $17.00 and $13.00, respectively, per hour, which can only be filled by working two more minimum-wage jobs. With the current minimum wage, they would have to work nearly a hundred hours per week to be able to afford a two-bedroom and nearly eighty hours per week for a one-bedroom.
“At least they have a job!” some people might say. We tend to miss the forest for the trees, especially when discussing the unemployment rate. As Martha Ross, a senior fellow at the Brookings Institution, explained, “[The unemployment rate] is important, and we shouldn’t lose it. [But] if wages aren’t enough to support yourself, then the low unemployment rate doesn’t mean that people are doing well.”
“If we pay them too much, they are going to get fired!” other people might say. If workers start demanding more money, companies might decide that it is cheaper to let them go. But modest, gradual wage increases actually don’t result in a reduction in employment. As Dale Belman and Paul Wolfson highlighted in What Does the Minimum Wage Do?, a review of fifteen years of research into the minimum wage, “There is little evidence of negative labor market effects [from an increase in wages]. Hours and employment do not seem to be meaningfully affected.” They continued, “While not a stand-alone policy for resolving the issues of low income in the United States, the effectiveness of moderate increases in the minimum wage in raising earnings with few negative consequences makes it an important tool for labor market policy.”
If someone can’t afford a stable place to live, life becomes very hard. When there is a disconnect between security and existence, it becomes much more difficult to function. If people’s basic needs aren’t being met, they can’t focus on much else. With more time to think and more time to process, they make better choices and their stability increases. Safety delivers returns. Security creates growth. It is imperative to invest in people—and that begins with paying them a living wage.
The Skewed Way We See Wage Growth
We’ve been able to ignore the necessity of a living minimum wage because we have had a lot of services subsidized during the era of extremely low interest rates. In the world of venture capital and excess funding, we were able to have bonkers things such as fifteen-minute grocery delivery and rideshare services straight to our door without having to pay for what those services truly cost. Companies such as Uber and DoorDash provide us with on-demand delivery and transportation services despite being unprofitable, resulting in the perception of affluence.
This feeling of being rich and mighty because we can have burgers dropped off outside our house has somewhat offset the perception of wage stagnation, as Sarah O’Connor of the Financial Times wrote:
In the decade after the 2008 financial crisis when wage growth was fairly stagnant for many, perhaps these apps gave us a sense we were wealthier than we really were, albeit with some hidden long-term costs. Laziness might have been democratised—but not for long.
The availability of subsidized services provided by venture darlings created a sense of wealth that made everyone feel richer—even though no one (except maybe the founders of those companies) actually got wealthier from them.
Tipping culture is a bit similar to the distortion that zero-interest-rate companies created. Businesses should, of course, pay their employees fairly, but that would create a gap between the prices we expect to pay for things and what things cost to make, which would make it clear that a lot of people can’t really afford what they want. A 2023 New York Times article by Kellen Browning explored the math of Uber Eats and DoorDash, interviewing workers, and reported:
In the United States, Mr. Kravchenko has marveled at the gaudy displays of wealth. But he is constantly flummoxed by the stinginess of some customers.
“I don’t understand how somebody can have a $5 million house and pay $3 to $5 a tip,” he said in Russian, sitting in his car next to the dumpster in the Pacific Palisades alley. He switched to English: “I guess, the more money, the more problems.”
Tipping culture is becoming increasingly pervasive because most employers don’t pay their employees enough. But part of the reason that tipping culture exists is that we don’t love paying for what things really cost—and one of the easiest ways for businesses to reduce their expenses is to pay their employees less.
The International Impact of Low Wages
The idea of comparative advantage, where one country is better at producing something than others, is often based on lower wages. Lower wages in a country can lead to lower production costs, giving it a competitive edge on the global market in certain industries. This cost advantage allows such countries to specialize and export these cost-effective goods, while importing goods that are costlier to produce domestically. As the Nobel laureate Robert Solow said in a 2000 press briefing with President Bill Clinton, “China will compete for some low-wage jobs with Americans. And their market will provide jobs for higher wage, more skilled people. And that’s a bargain for us.”
But Michael Pettis, a senior fellow at the Carnegie Endowment and finance professor at Peking University, argues that this sort of mindset is “bad competitiveness”—that a world that relies on suppressed wages ultimately ends up relying on huge amounts of debt to maintain demand and production levels. The theory is that the same level of output is produced by paying $20 for labor in America and $2 for labor in China; the difference just increases the profit that the producer is able to capture for itself. Pettis wrote, “The purpose of international trade should be to maximize overall productivity and, with it, to increase welfare. It should not allow individual countries to maximize domestic production at the expense of their trading partners.”
Pushing low-paying jobs into other countries is not the best way for the world economy to grow. Instead, focusing on production, innovation, and more balanced trade is the best path toward an increase in wealth for everyone.
For decades, free trade was the favored policy approach of both major political parties in the United States. Everyone was excited for its potential to boost domestic economic growth, foster innovation, and lower consumer prices, so the general consensus in Washington was toward embracing global markets and reducing trade barriers.
However, the early twenty-first century saw a growing skepticism about the supposed unbridled benefits of globalization. A series of economic shocks, coupled with concerns over trade deficits, intellectual property theft, and the decline of domestic manufacturing, began to reshape the narrative that everyone had purported for years. The financial crisis of 2008 only heightened these worries, as many Americans faced job losses, stagnating wages, and economic uncertainty.
The 2016 U.S. presidential election was very revealing of the shifting sentiment. Both major party candidates raised concerns about the impacts of free trade agreements, such as the North American Free Trade Agreement (NAFTA) and the then-pending Trans-Pacific Partnership (TPP).
Discussion of downsides began to grow. Many in Washington began to argue that past trade policies had overlooked the domestic costs, particularly the hollowing-out of certain industries like manufacturing and the loss of well-paying jobs to overseas companies. This sentiment led to calls for more protectionist measures, including tariffs and trade restrictions to keep production local.
Underlying this shift was also a broader geopolitical strategy. The rise of China as an economic powerhouse posed challenges to the United States in terms of trade balances, technological competition, and global influence. This rivalry further complicated the free trade debate, as policymakers grappled with how to ensure U.S. economic security and global competitiveness, while still tapping in to international trade.
In 2022, post-Brexit—itself a function of the worries over trade and equitable international arrangements—Andrew Bailey, the governor of the Bank of England, told Britons not to ask for a pay raise to help fight the cost-of-living crisis. Of course, he makes more than £575,000 ($727,000)—eighteen times the U.K. average for a full-time employee. That generated a lot of animosity among Britons, who are mostly just trying to get by. To have someone tell them, “Just be happy with less while everything costs more” was a painful experience. The United Kingdom does have minimum wage rates, which vary depending on the age of the worker, and a relatively robust social safety net. But again, these push-and-pull wage dynamics highlight the importance of policy.
How We Value Work
The way we value work, especially in developed nations, is uneven. We often separate work into “white-collar” jobs (e.g., office jobs involving staring at an Excel spreadsheet) and “blue-collar” jobs (jobs that require some sort of manual labor). We are a knowledge-based society, so we place a higher premium on jobs that require a “good education” than on jobs that require a depth of physical knowledge (and oftentimes still require a good education!).
This is similar to G. K. Chesterton’s thoughts about the miraculous nature of the dandelion, in which he wondered what he must have done to earn the privilege to see a dandelion—and reflects on how little we respect that privilege:
There is a way of despising the dandelion which is not that of the dreary pessimist, but of the more offensive optimist. It can be done in various ways; one of which is saying, “You can get much better dandelions at Selfridge’s,” or “You can get much cheaper dandelions at Woolworth’s.”…merely sneering at the stinginess of providing dandelions, when all the best hostesses give you an orchid for your buttonhole and a bouquet of rare exotics to take away with you.
One could draw a line from Chesterton’s thoughts on dandelions to the way we tend to treat certain aspects of blue-collar work—whether through lower wages, longer working hours, or simply a societal nose sniff at the jobs that most need to be done. He continued:
These are all methods of undervaluing the thing by comparison; for it is not familiarity but comparison that breeds contempt. And all such captious comparisons are ultimately based on the strange and staggering heresy that a human being has a right to dandelions; that in some extraordinary fashion we can demand the very pick of all the dandelions in the garden of Paradise; that we owe no thanks for them at all and need feel no wonder at them at all; and above all no wonder at being thought worthy to receive them.
Construction, a blue-collar job, is one of those weird dynamic things. It is the foundation of the economy, meaning that it’s an indicator of the health of the broader macrosphere. When residential construction employment falls, it ends up dragging down total employment (it’s that powerful). As Eric Basmajian, the founder of EPB Research, pointed out:
-
Building permits, the legal permission from the government to build something, are very sensitive to changes in monetary policy because builders freak out—they don’t want to build during a recession!
-
Building permits, these permissions to build, lead units under construction. So if there is a drop-off in permits, the number of buildings being built is going to fall, too.
-
And of course, if the number of units under construction falls, so does construction employment.
When the number of housing permits issued goes down, trouble is coming for construction employment—and the rest of the economy.
Worker Power
If there was any possible silver lining to the inflation of the early 2020s, it was that workers were finally able to demand higher wages.
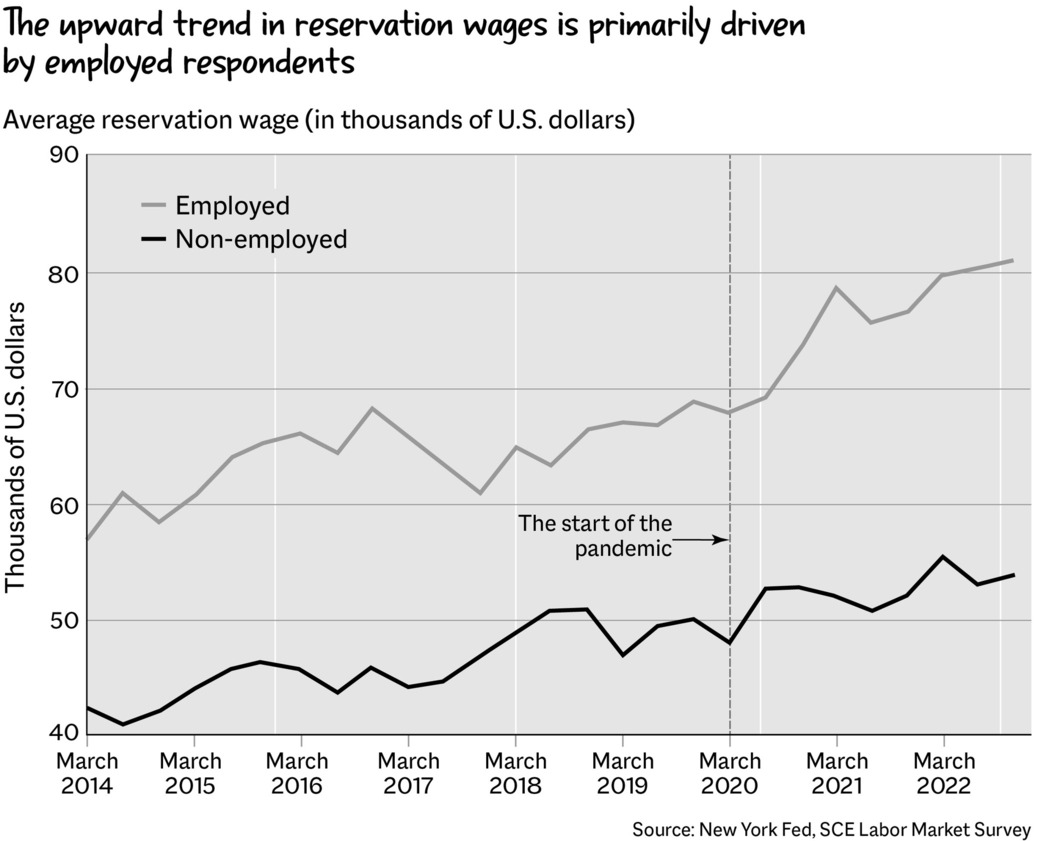
Worker power grew stronger. Even those who lost their jobs in 2022 were able to quickly get new interviews for new positions, often leading to higher pay. The reservation wage, or the lowest average wage that people were willing to accept for a new job, was $75,811 in March 2023, a substantial increase from $73,667 in November 2022, according to the Federal Reserve’s Survey of Consumer Expectations Labor Market Survey. Being laid off helped a lot of people find jobs in companies that would actually value them.
As the journalist Bryce Covert wrote on The American Prospect website:
What did happen when Americans got better unemployment benefits is that they were freed up to think about what kind of job they really wanted, and to pursue getting it. The labor shortage was more of a reset: People re-evaluated their relationships to work, facilitated by being able to make ends meet in the meantime.
When we give people space to process things that happen around them and to them, they can make better decisions. When they make better decisions, they are able to do cooler things. Social safety nets are not bad things; they enable people to grow into what they have the potential to be.
How Can the Labor Market Be Improved?
Demographics are key, too. We have to be mindful of the aging population; about 2 percent of the fall in the labor force participation rate in the United States can be attributed to people getting older and retiring. That means we need more workers—and more ways to support them.
Immigration
Improving U.S. immigration policy would do wonders for economic growth (and likely improve the well-being of everyone). As Maria Prato of Yale University wrote in “The Global Race for Talent: Brain Drain, Knowledge Transfer, and Growth,” “doubling the size of the US H1B visa program increases US and EU growth by 9% in the long run, because it sorts inventors to where they produce more innovations and knowledge spillovers.” Taking a look at history can shed some additional light on this. Highly skilled Byzantine immigrants to Europe encouraged the Renaissance, according to research by Andreas Link of the University of Erlangen-Nuremberg. If we want another Renaissance, we need to be open to the ways of making that happen!
Parental Leave and Disability Policies
Parental leave policies can be improved, which would add around 3.5 million people to the labor force, according to research by Kathryn Anne Edwards, an economist at RAND Corporation. Additionally, workers with disabilities can also be supported, as evidenced by their historically high employment rates during the work-from-home era of the pandemic, according to a 2022 report by the U.S. Department of Labor’s Office of Disability Employment Policy. Tapping into these demographics, who are eager to work but need that extra push from policy to do so, can seriously bolster the LFPR!
Rethinking Ownership
We can also rethink how wealth is generated in the labor market. A 2022 report by Oxfam found that the world’s billionaires saw their wealth increase by $3.9 trillion between March 2020 and March 2021, while at the same time, workers around the world lost $3.7 trillion in income.
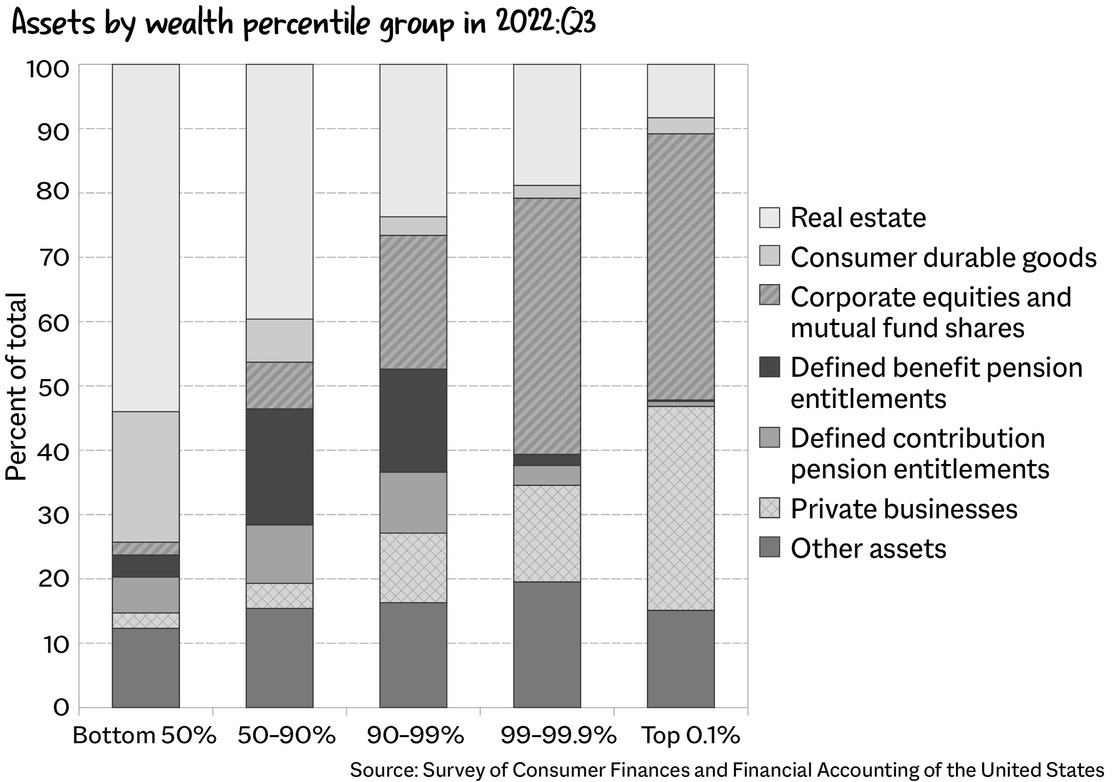
The United States has been battling wealth inequality for a long time. According to data from the Federal Reserve, the top 1 percent of households in the United States held ten times more wealth than the bottom 50 percent in 2022.
Money begets more money. And what happens when you become really wealthy is that you get into investing. Though most Americans’ net worth is tied up in their homes, the very wealthy hold a majority of their wealth in stocks and private businesses. In fact, the top 10 percent of households in the United States own 84 percent of all stocks, while the bottom 50 percent own just 0.5 percent. This disparity in stock ownership has widened in recent years, with the top 1 percent of households owning 53 percent of all stocks as of 2020.
In 2023, Talmon Joseph Smith published a New York Times article, “The Greatest Wealth Transfer in History Is Here, with Familiar (Rich) Winners,” which focused on the inheritance passed from the wealthy to their children and made a few key points: Total U.S. family wealth is now at $140 trillion, up from $38 trillion in 1989. High-net-worth families (about 1.5 percent of the population) hold 42 percent of the $100 trillion expected to be passed down (of which they will pay a mere $4.2 trillion in taxes).
Wealth is about ownership and equity. So we can talk about wage-price spirals, minimum wage, and other topics, but a key part of stabilizing the labor market might involve giving people shares in the companies they work for. That could do a lot to improve labor market incentives and wage imbalances and to help reduce wealth inequality. Other solutions involve progressive taxation, improved social safety nets, and worker ownership programs.
Publix is one example of a company that has implemented a worker ownership program. It has an employee stock ownership program (ESOP) that allows employees to buy Publix stock through their paycheck. This enables workers to hold shares in the company and therefore benefit from Publix gaining in value! The total value of the plan is north of $4 billion, with the average employee owning $22,000 in Publix stock. That’s amazing!
Workers who hold stock in a company have a stake in what they make and are more likely to feel invested in the company’s success. They aren’t working to make billions of dollars for five dudes in suits in a boardroom somewhere; rather, they are working to make money for themselves. This enables them to build wealth over time and creates a much more inclusive and equitable economy.
Building
The labor market is confusing.
There is a way for unemployment to go up that isn’t bad. The policy of creating a “soft landing”—getting inflation down without causing a disaster—leads to a higher unemployment rate. Unemployment doesn’t rise because people are losing their jobs but because people without jobs start looking for work and are therefore counted as unemployed. The labor force participation rate rises as more people look for jobs, slowing income growth and spending, and creates a world in which employment remains stable and the labor force grows.
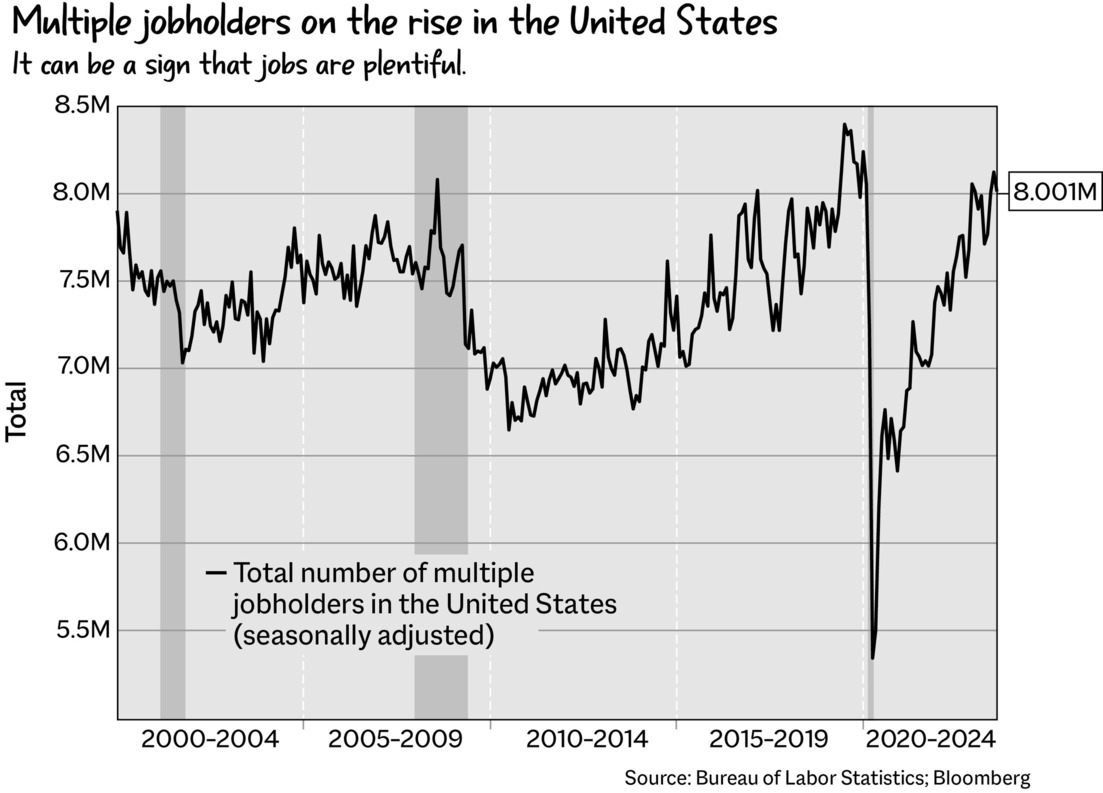
Also, this is going to sound wild, but it’s actually not a bad thing (for the labor market) that people are working two jobs. It’s obviously not great that people need to work two jobs to get by, but the fact that they are able to get more than one job is a (somewhat bothersome but still powerful) indicator of labor market strength. As Julia Pollak, the chief economist at ZipRecruiter, put it, “Public perception is that people take on multiple jobs when the economy is bad because they’re not earning enough in their job. People take on additional jobs when there are additional jobs to be had.”
The economist Adam Ozimek published a piece in The Atlantic in 2023 that basically boiled down to “We don’t have to destroy the economy in order to fix it,” which is an incredibly important point. There’s nuance, of course (rate hikes helped, as the economy needed a bit of a slowdown), but the general idea that we don’t need a rise in unemployment to cause a recession to sucker punch inflation is really good; we don’t need to suffer excessive pain to see progress.
There is a lot we can learn from nature when we think about how to make work and the broader labor market better. For example, trees in a forest are part of a beautiful, intricate system in which they channel various nutrients to one another, caring for one another through connection. It’s an underground world, a support system that makes all the trees better. I do think we could learn from that, creating a collective world that doesn’t see other people as enemies but as fellow humans, a space in which helping others is not a transaction but an equal exchange of selfless giving.
The labor market is going to be shaken up by various events over the coming years. For example, Artificial intelligence (AI) is speeding toward us at an unimaginable pace. That’s terrifying, and we don’t know the full extent of its repercussions yet. It’s part of the reason things feel so weird right now. We never really know what the future is going to look like, but man, it sure does feel uncertain.