Chapter 8
Inflation
Inflation began to decelerate into late 2023, falling from a peak of 9.1 percent in June 2022 to 3 percent by June 2023. This is disinflation, a slower rate of price increases over time. This means that prices are still rising but at a more moderate pace compared to the previous period.
Just because the inflation rate is falling doesn’t mean that prices are falling. The inflation rate is a percentage change, not a change in price level. So when news headlines say, “Inflation Rate Falls to 3 Percent,” that doesn’t mean that prices fell three percent; it just means that the rate of change of price increases fell three percent.
Types of Flation
There are a lot of “other-flations” that we have to deal with, too.
Deflation is when the inflation rate falls below zero, indicating a decrease in the general price level of goods and services. Hyperinflation, on the other hand, is an extreme form of inflation where prices skyrocket at an extraordinarily rapid rate, often leading to a loss of confidence in the currency as it becomes worth a lot less. Stagflation is another complex economic condition, characterized by slow economic growth, high unemployment, and high inflation. It leads to an economic downturn while simultaneously causing the cost of living to rise basically exponentially—a combination for disaster.
I remember buying a carton of strawberries sometime in 2022, looking at the $3 price tag, and thinking, “I remember when these were $2—like a year ago!” Things got really expensive really fast in the early 2020s due to these outsize inflationary pressures.
In order to better understand inflation, there are some key metrics to look at.
Measuring Inflation
-
Consumer Price Index (CPI): Tracks changes in the prices of a basket of goods and services consumed by households, covering food, housing, transportation, healthcare, education, and more.
-
Personal Consumption Expenditures (PCE): Based on expenditure data, it tracks changes in the prices of goods and services consumed by individuals or households.
-
Wholesale Price Index (WPI): Tracks changes in the prices of goods at the wholesale level, focusing on the prices paid by businesses for goods they purchase for further processing or resale.
-
Producer Price Index (PPI): Tracks changes in prices received by domestic producers for their output.
-
GDP Deflator: Tracks changes in prices across the economy, measured by comparing nominal GDP with real GDP. (This is what we used with the Gingerbread Yeti Economy.)
The Consumer Price Index: The People’s Inflation
Understanding the Consumer Price Index (CPI) is crucial, as it measures the average change in prices of goods and services paid by urban consumers. It is used to adjust Social Security payments and is also the reference rate for financial instruments, like Treasury Inflation-Protected Securities (TIPS), that help safeguard your money against inflation. The basket of goods and services includes such things as food, housing, transportation, and medical care.
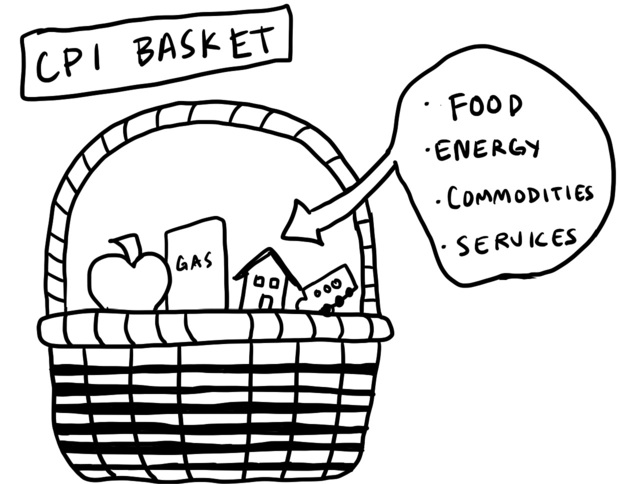
It’s a way to track how much more or less things cost for the average person. To calculate the CPI:
-
The Bureau of Labor Statistics (BLS) is responsible for calculating the CPI. They survey thousands of households across the country to gather data on what they buy and how much they pay for it.
-
The BLS then uses this information to create a “market basket” of goods and services representing what the average household buys. The market basket tracks a lot of things: foods and beverages, housing, transportation, medical care, education, recreation, apparel, and other goods and services, such as haircuts and household cleaning supplies.
-
Then the BLS compares the price of this year’s basket to the basket price of previous years, enabling the BLS to determine the inflation rate. This method of measuring inflation is followed by other countries as well, and each country has its own entity that measures its own inflation basket, which can vary from country to country.
Here are some examples of how baskets vary across different countries:
-
United Kingdom (Office for National Statistics):
-
Food: fish, tea
-
Clothing & footwear: women’s leggings, men’s athletic shoes
-
Recreation & culture: streaming music subscriptions, ebooks
-
Restaurants & hotels: takeaway coffee, pub snacks
-
-
Japan (Statistics Bureau of Japan):
-
Food: fresh fish, rice, mochi
-
Clothing: women’s suits
-
Culture and recreation: karaoke box fees
-
-
India (Ministry of Statistics and Programme Implementation):
-
Food: rice, milk, onions, tea leaf
-
Clothing: saris (traditional wear), footwear
-
Fuel and light: cooking gas, electricity
-
Miscellaneous: tuition fees, gold ornaments
-
The basket is applied broadly across the economy to get a general measure of inflation, but you have your own market basket as well! For example, my market basket would be what I eat every day, my apartment rent, the cost of maintaining my bike (my primary mode of transportation), my healthcare costs, my cell phone and internet bill, dog food costs (my dog, Moo, eats a well-balanced diet!), and clothes.
Here’s an example of how the market basket is put into action.
-
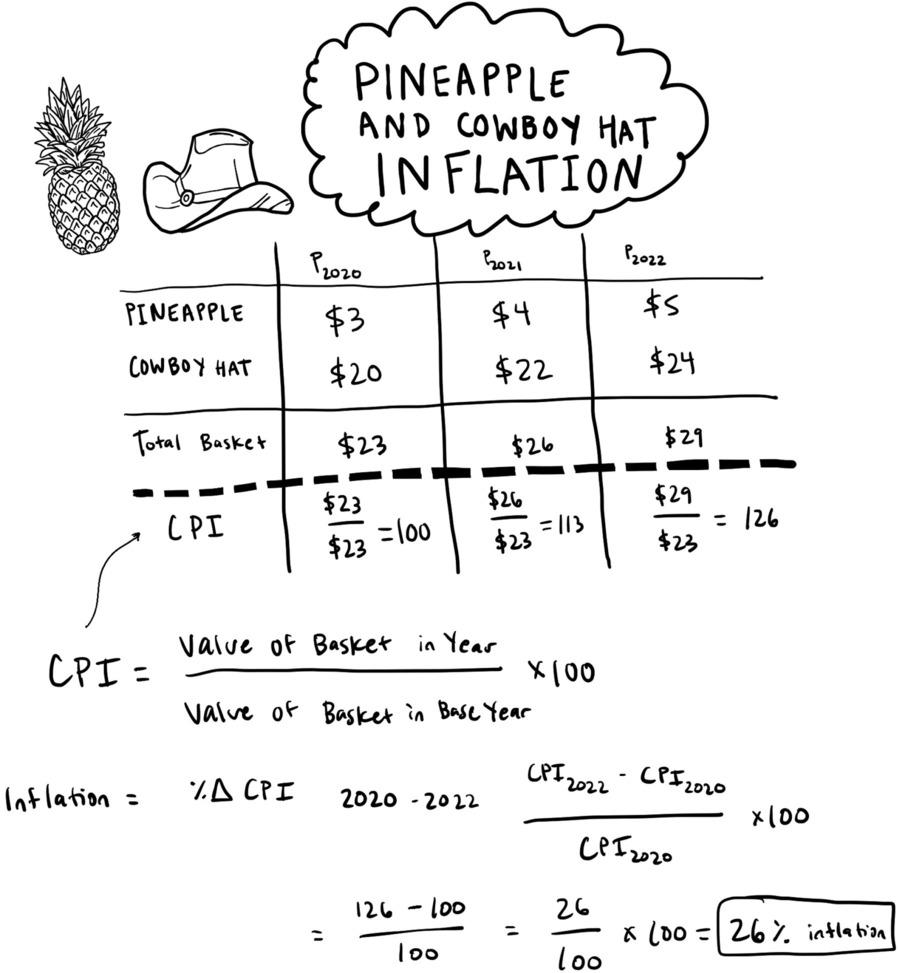
Let’s say that in a base period (2020), the price of a pineapple was $3 and the price of a cowboy hat was $20. Pineapples went up to $4 in 2021, and cowboy hats went up to $22 (howdy, inflation!). In the current year (let’s say 2022), the price of a pineapple is now $5 and a cowboy hat is $24.
-
To calculate the price of the pineapple and cowboy hat basket for each year, we add the prices of the two items. In this case, the basket prices for the three years would be $23, $26, and $29, respectively.
-
To calculate the CPI for each of those years, we would take the price of the basket in the current period ($29 in 2022) and divide it by the price of the basket in the base period ($23), then multiply by 100 to get a percentage increase. In this case, the CPI for the basket for each year would be:
-
2020: ($23/$23) × 100 = 100
-
2021: ($26/$23) × 100 = 113
-
2022: ($29/$23) × 100 = 126
-
-
We then can calculate inflation, which is the percentage change in CPI between the two years. So from 2020 to 2022, the percentage change in the CPI basket was 26 percent—quite a pricey pineapple–cowboy hat combo!
The Bureau of Labor Statistics and other agencies in different countries calculate CPIs for all the items in the market basket by using the same method. They then combine the CPIs to determine an overall CPI for the market basket.
Personal Consumption Expenditures: The People’s Inflation, but for the Fed
Then there is Personal Consumption Expenditures (PCE), which is what the Federal Reserve and other policymakers like to look at to gauge household spending. In contrast, many European countries use a metric called Household Consumption Expenditure (HCE) to measure spending. Most countries have an inflation measure such as PCE or HCE that they use to make policy decisions.
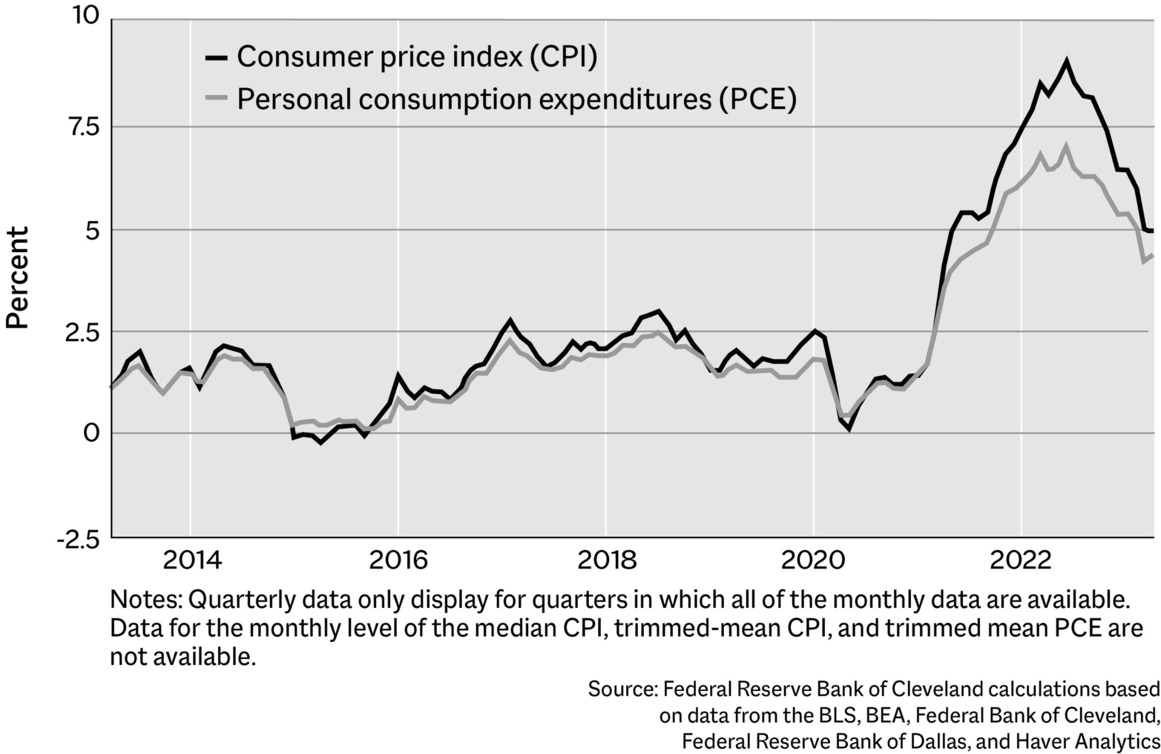
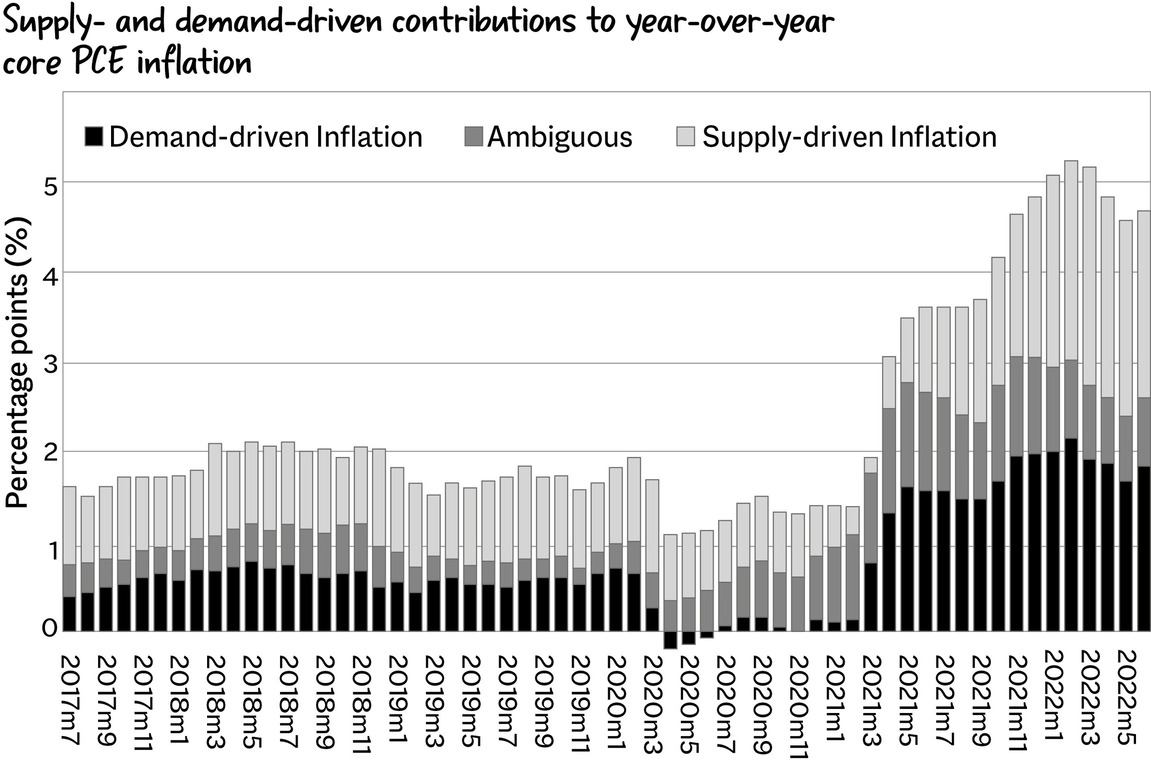
The PCE is based on the data of what these households, businesses, and governments are selling, capturing consumer spending from the transactional side of businesses and governmental bodies. As you can see in the following chart from the Federal Reserve Bank of Cleveland, CPI and PCE diverge. They do the same thing by calculating the price level based on a basket of goods. So why do they diverge?
Joseph Haubrich and Sara Millington, two economists at the Cleveland Fed, outlined three reasons in a 2014 paper:
-
The scope effect. The CPI doesn’t include things that people don’t pay for directly, such as medical care via employer-provided insurance. However, the PCE includes them as personal spending.
-
The weight effect. The two indices weight basket items (like gasoline or limes) differently, which impacts how they measure inflation.
-
The formula effect. PCE uses a chain-weighted index, which allows the weights to change more frequently (annually or even monthly) with consumers’ spending patterns. This means the PCE can more accurately capture shifts in consumer behavior as they substitute away from goods and services that have become relatively more expensive, whereas CPI is a fixed basket that updates less frequently.
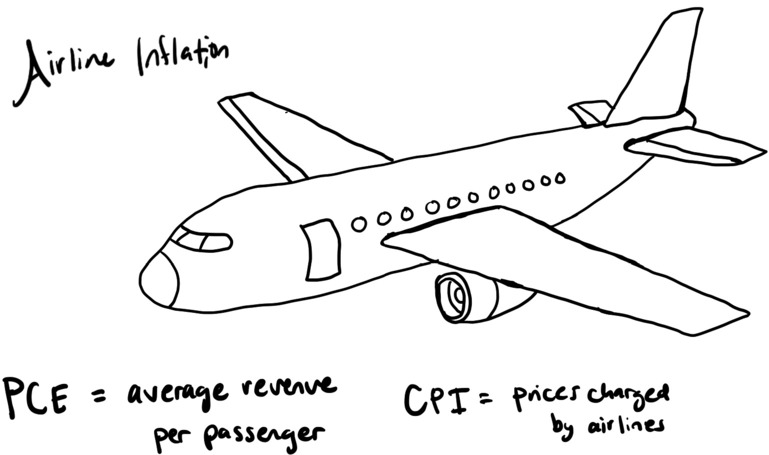
The PCE and CPI measure things differently—the weight effect—which includes airline fares. The PCE index for airline fares is based on airlines’ passenger revenues and the total number of miles traveled by passengers, which equates to average revenue per passenger. The Bureau of Economic Analysis (BEA) collects data from airlines on these two data points and uses this data to calculate the PCE index for airline fares. The CPI is based on airfares on a few sample routes.
Sound confusing? Yeah. That’s why sometimes the two numbers can diverge. In fact, due to a variety of factors, the gap between PCE and CPI has widened substantially a couple of times.
Direction and magnitude are the most important things to glean from these two metrics. If the PCE and CPI are going up quickly, that isn’t great. If they are going down quickly, that also isn’t great, because consumer demand is falling. What’s important is the rate of change, not simply the actual price level.
The Producer Price Index: Inflation for Businesses
The Producer Price Index (PPI), used in the United States, and the Industrial Producer Price Index (IPPI), used in the European Union, are important metrics that measure the average change in prices received by producers for goods and services. These indices track the prices of goods and services at various stages of production, including raw materials, intermediate goods, and finished goods.
While the CPI and PCE look at how much consumers are paying, the PPI focuses on the prices of goods and services received by domestic businesses. Changes in the PPI can impact how much businesses are willing to invest and how much they charge their customers. If a business’s costs go up due to higher PPI, it may need to raise its prices to stay profitable, which can in turn impact inflation at the consumer level—a never-ending, vicious feedback loop.
Metric: Consumer Price Index (CPI)
Metric: Producer Price Index (PPI)
Metric: Personal Consumption Expenditures (PCE)
It’s better to use the CPI when you want to measure the overall changes in the prices of goods and services consumed by households, as it provides a comprehensive view of inflation’s impact on the average consumer. On the other hand, it’s better to use the PPI when you want to check out the price changes of goods and services at the wholesale or producer level. Additionally, some analysts and policymakers prefer using the PCE because it covers a broader swath of consumption (especially stuff like healthcare) and captures more nuance within its methodology as compared to CPI.
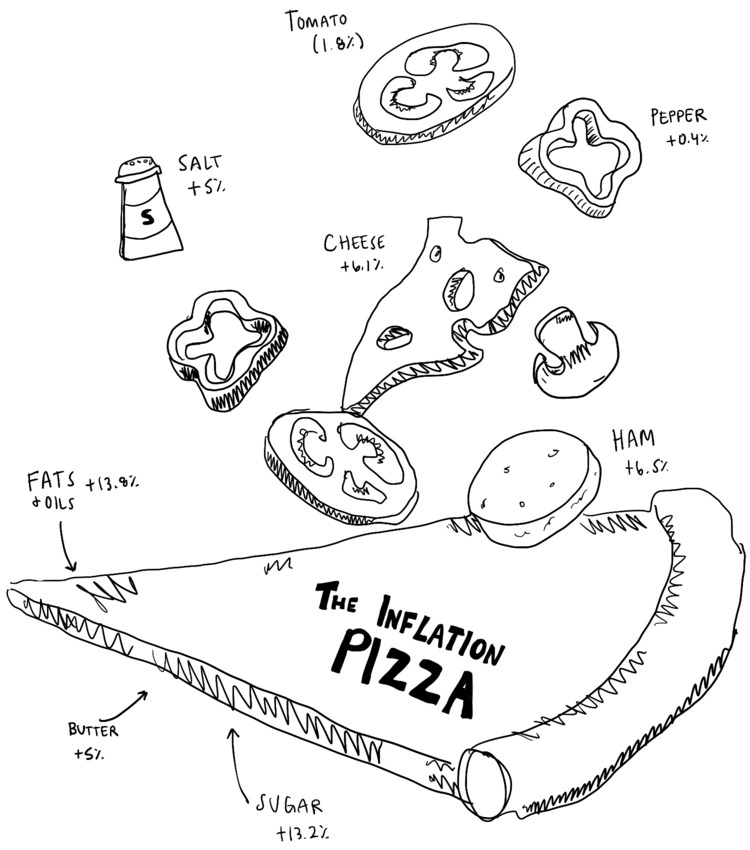
The Inflation Pizza
We can calculate inflation (and the broad impact it has) through the inflation pizza, inspired by Politico’s “inflation cheeseburger.” Everything that goes into a pizza is exposed to inflation: the salt, the tomato, the peppers, the dough! Although this is a pretty simple example, it will illustrate how expensive ingredients can get and how important food prices are in maintaining an economy.
-
Dough: The cost to make a pizza begins with the dough. The price of flour went up by 12.1 percent from June 2022 to June 2023 (the price of all bakery products climbed by 8.8 percent). It skyrocketed due to terrible weather—wheat being grown in drought conditions—as well as the geopolitical pressures caused by the Ukraine war.
-
Cheese: Cheese prices increased by 1.1 percent in the same time period. This was driven by labor shortages, heightened costs of water supply due to drought, and the escalating cost of cattle.
-
Salt: Salt prices increased by 4.3 percent, driven by supply shortages and higher salt processing costs.
-
Various Meats: Meats, including beef, pork, and ham, increased by 0.6 percent, but lunch meats (pepperoni!) increased by 4.9 percent as meat processors focused on producing other products.
-
Vegetables: Vegetables increased by 2.1 percent due to labor shortages and climate change.
-
Fats and Oils: Fats and oils increased by 8.7 percent in price, driven by geopolitical conflict and rising fuel prices for transport.
A lot of the price pressure came from labor market disruptions, as Politico reported: “The limited availability of work visas continues to be an issue for many employers—over 50 percent of agriculture and 90 percent of dairy workers are estimated to be foreign born or undocumented.” This was also compounded by higher transportation costs and supply chain delays.
This is just one example of the sweeping impact that inflation can have.
Inflation Expectations
Inflation expectations can significantly impact economic behavior, influencing spending, saving, and investing. If you think that the price of bread is going to increase by $2 tomorrow, you’re going to go buy bread today.
The underlying concept of inflation is sort of intertwined with the idea of vibes. A lot of the Federal Reserve’s role involves managing these vibes through monetary policy, trying to make sure that people’s expectations are aligned with true economic reality.
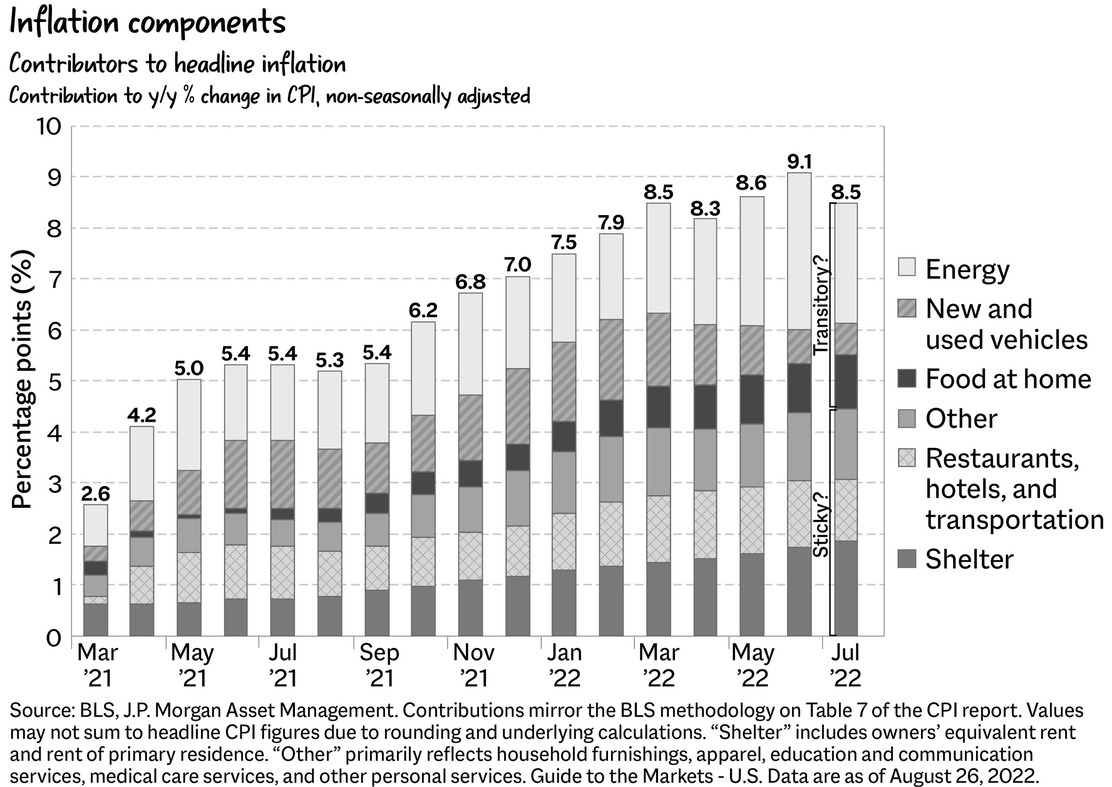
Of course, it would be an oversimplification and very untrue to say, “Bad vibes are causing inflation!” But vibes can exacerbate a problem that already exists. There are various charts, such as this one from JPMorgan Chase, that demonstrate what contributes to inflation—energy, new and used vehicles, food prices, restaurant costs, shelter costs—but the causes of inflation are different.
Causes of Inflation
Inflation has a mix of many complicated causes. Supply and demand is the root of most of it, but other significant factors include pressure from firms raising prices, fiscal and monetary support, and international trade fissures.
The supply and demand imbalance was calculated by the New York Federal Reserve, with supply chain bottlenecks driving 3 percent of the total inflation number. As Julian di Giovanni, an economist at the NY Fed, wrote:
Our work shows that inflation in the U.S. would have been 6 percent instead of 9 percent at the end of 2021 without supply bottlenecks…. Put differently, fiscal stimulus and other aggregate demand factors would not have driven inflation this high without the pandemic-related supply constraints. In the absence of any new energy or other shock, it is therefore possible that the ongoing easing of supply bottlenecks will cause a substantial drop in inflation in the near term.
Broken supply chains created a lot of problems. The San Francisco Fed found something similar, estimating that supply chain disruptions accounted for approximately 60% of the “above trend run-up of headline inflation in 2021 and 2022.”
Combine that with government spending and Fed policy, and you get a perfect storm. Fiscal policy took a huge step forward at the same time that supply collapsed, pushing support such as the 2020 $2.2 trillion Coronavirus Aid, Relief, and Economic Security (CARES) Act. As the economist Glenn Hubbard wrote in the Financial Times:
To consider excessive government spending as a culprit along with the Fed’s loose monetary policy, it is useful to draw a contrast with policy in the global financial crisis of 2008 and the subsequent economic recovery. As in the pandemic, the Fed kept short-term nominal rates at zero for a long time and expanded its balance sheet more than fourfold. Both inflation and inflationary expectations remained anchored at around 2 per cent—with actual inflation sometimes lower—during the decade after the onset of the financial crisis. A key difference, though, was that fiscal policy expansion was comparatively weak relative to that of the pandemic recovery.
Inflation arises from the combination of fiscal policy, monetary policy, supply chains breaking, expensive energy, and so much more. But the shock hampered the supply of goods through “sticky prices, input-output linkages, and labor reallocation costs”—the costs of making more things to meet the higher demand and not enough people working to make more things.
The imbalances bleed into the economy, leading to the four main amplifiers of inflation over the past few years:
-
Price hikes
-
The state of the labor market
-
Globalization
-
Energy markets
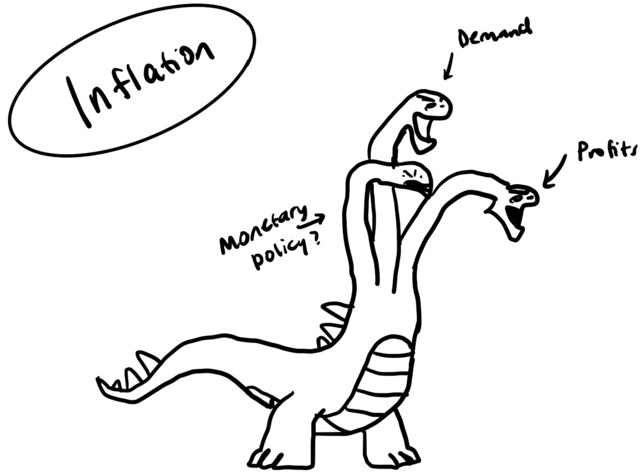
Inflation is a multiheaded hydra, with several complex causes and not that many solutions.
#1 Price Hikes
Many people tend to attribute inflation to rising profits, but the reality is more complex. In 2023, Isabella Weber and Evan Wasner published a paper titled “Sellers’ Inflation, Profits and Conflict: Why Can Large Firms Hike Prices in an Emergency?,” which explored corporate concentration and pricing power. They found that, for the most part, companies increase prices whenever they can; after all, their goal is to generate a profit. In 2022, Tracy Alloway, a journalist at Bloomberg, reported on the “excuseflation” phenomena, where companies take advantage of uncertain times as a pretext to raise prices.
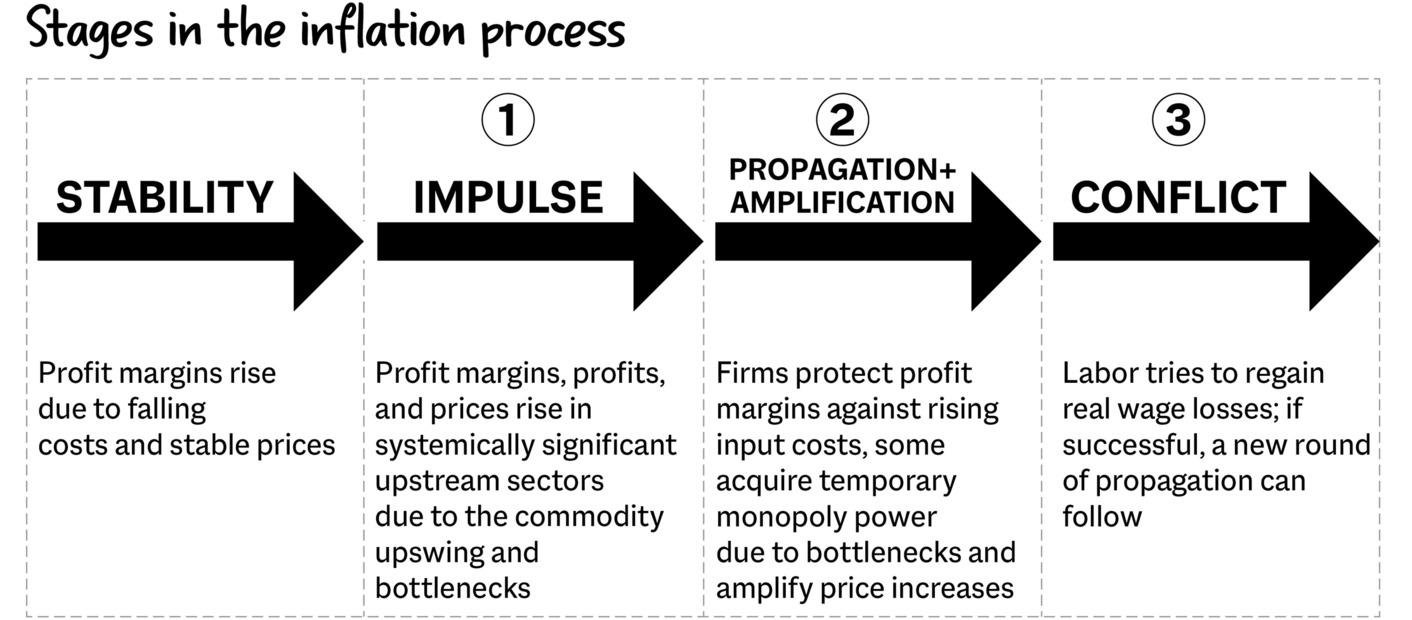
Unfortunately, the Weber-Wasner paper was often confused with the concept of “greedflation,” which suggests that companies operate solely out of spite. In reality, sellers’ inflation is a result of companies simply being companies—they raise prices to protect their profit margins, cover their costs, and so on, although greed may sometimes play a role.
But this isn’t due to companies being directly greedy (although, let’s be real, there is some of that). The problem is that they want to maximize their profits—the amount of money left over after they deduct all expenses such as operating costs, taxes, and interest. In order to maintain their profits, they need to (1) sell more product or (2) raise their prices.
A Quick Profit Explainer
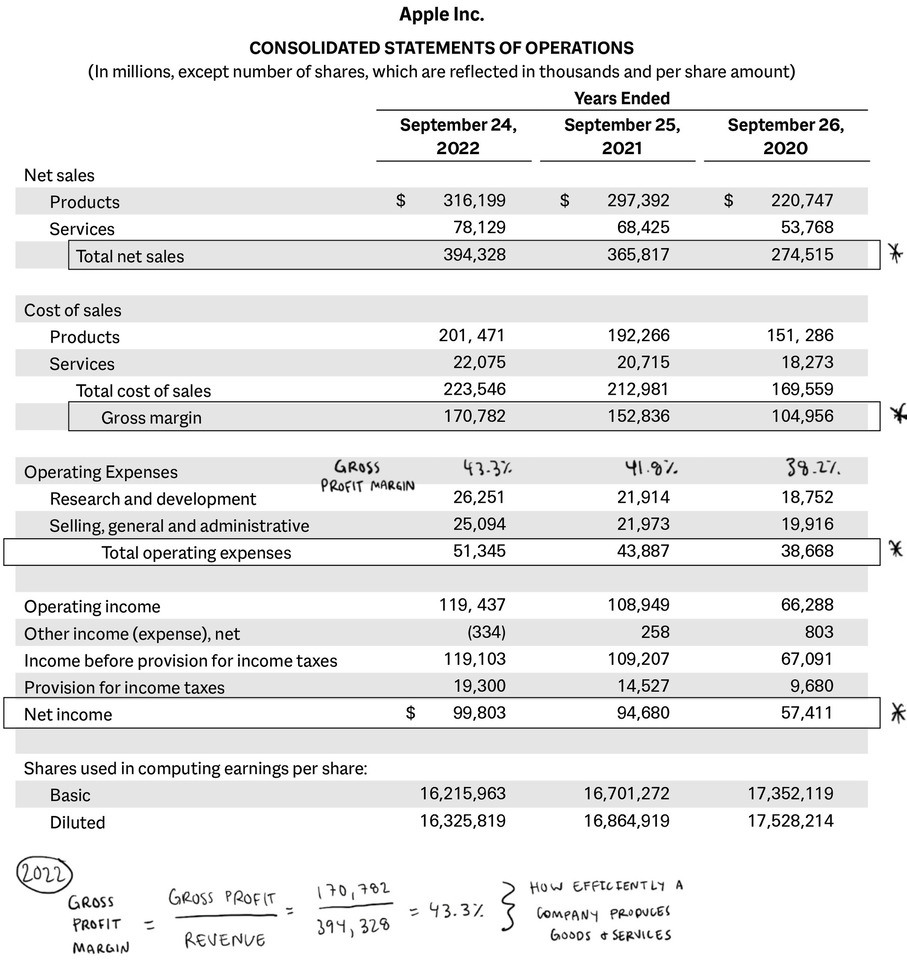
We can look at the “United States of Apple” to get an idea of what it means to be a profitable company. Apple’s gross profit margin, or how efficiently it produced goods and services, increased by about 5 percent from 2020 to 2022. To increase its profit margin further, it could either sell more products and services (more MacBooks and iPhones) or reduce the internal company cost of selling those products and services.
Raising prices is much easier to do than selling more things to turn a profit.
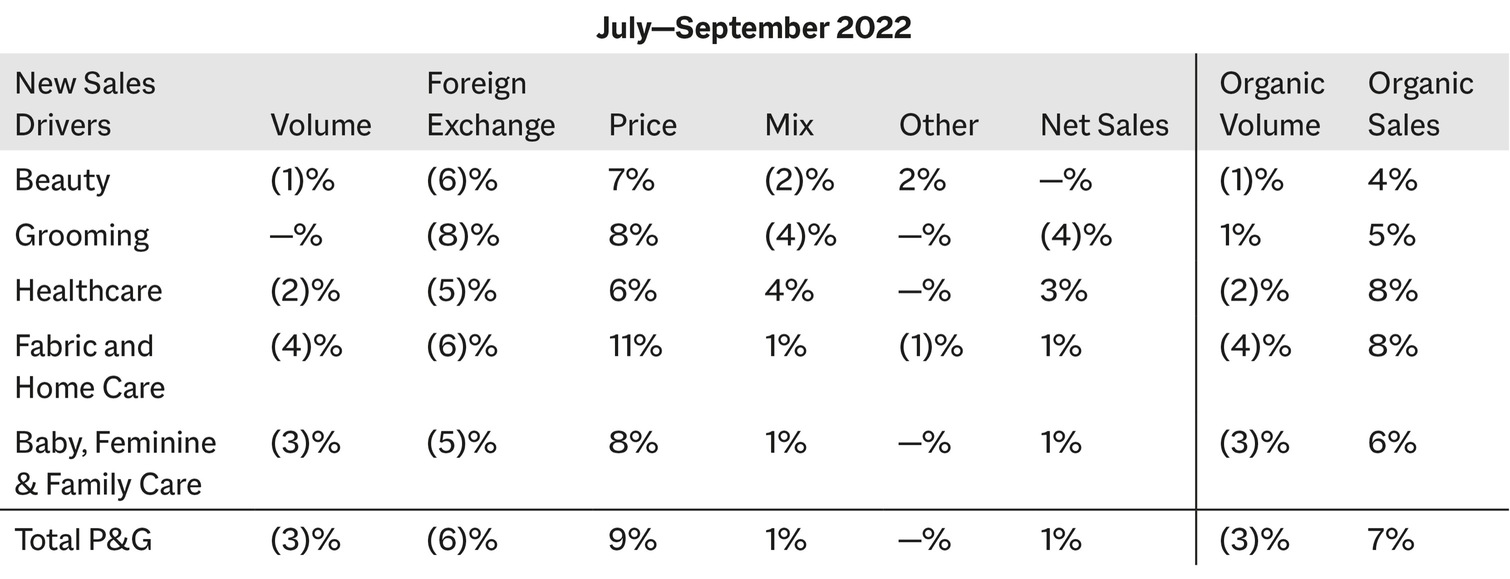
Procter & Gamble’s Q1 2023 earnings report shows the ease of increasing prices versus selling more products; price increases were a huge net sales driver, whereas sales volume was negative. The company was selling less but charging more, which enabled it to maintain its margins (and therefore have its stock remain golden in the eyes of investors).
It wasn’t just P&G. Nestlé pushed its prices up by almost 10 percent in the first three months of 2023, Kimberly-Clark raised its prices by 10 percent, and PepsiCo raised its prices by 13 percent—a nightmare for consumers.
This is where things get difficult. There are two main lines of thought when it comes to companies charging more during inflationary times:
-
It’s okay. Some people will say that corporations have to raise prices; they need to make money, pay their employees, and so on. This makes sense.
-
It’s absolutely not okay. But when companies don’t pass those gains off to their employees (and raise prices just to appease the stock market gods), things get dicey. The massive UPS strike in 2023 is a good example of what can happen: Employees get fed up, so they strike for higher wages and better working conditions.
July—September Quarter Discussion
All in all, companies are companies and they are going to do what they do best, which is to charge people more for the goods and services they make. As Paul Donovan, the chief economist at UBS Global Wealth Management, explained about corporate price hikes in 2022:
Two forces have combined. Despite negative real wages, consumers have carried on consuming. Strong postpandemic household balance sheets have allowed lower savings and increased borrowing to offset the sorry state of real wages. The resulting resilience in demand has given companies the confidence to raise prices faster than costs.
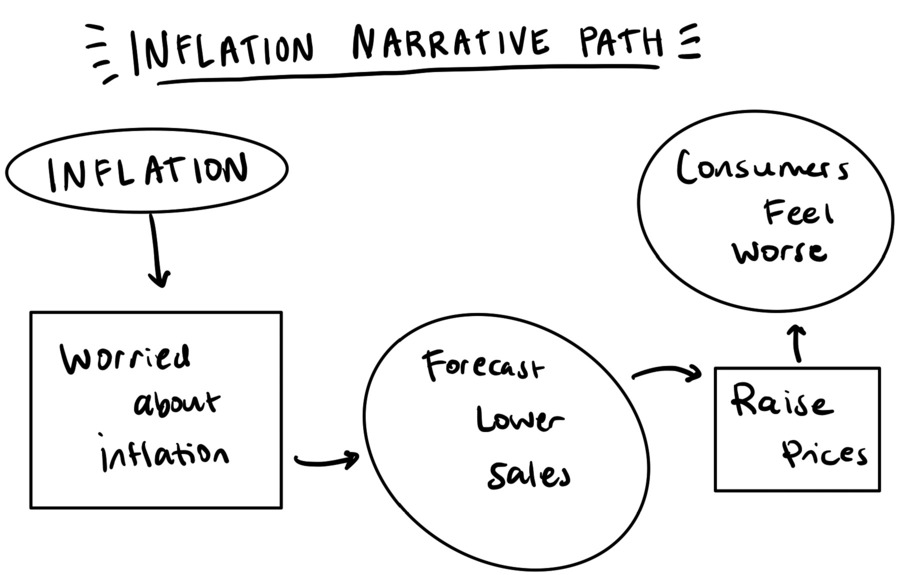
In addition, the power of storytelling has conditioned consumers to accept price rises. Imagine a story about a farmer who takes wheat to the windmill, where it is ground into flour, and then baked into bread. In that fantasy world, a rise in the cost of wheat of say 22 per cent might be used to justify a 15 per cent rise in the price of bread.
A lot of the price hikes are storytelling—conditioning people to understand that prices have increased for a reason, and there is no other option than to accept them. People also need to buy things. Going back to Procter & Gamble, they “raised prices across all of its main divisions, leaving them 7 per cent higher overall from a year earlier. Customer demand remained resilient with only a 1 per cent sales volume decline.” Net sales are up 6 percent from a year earlier, driven by higher prices, not by Procter & Gamble selling more things.
Companies usually raise prices when they can, which has a lot of consequences. Nestlé, Coca-Cola, and other companies raised their prices by more than 10 percent in the first quarter (first three months) of 2023. And it’s very easy for them, since power is so consolidated. After all:
-
Four companies control 85 percent of the U.S. beef market.
-
Four companies control 80 percent of the U.S. soy market.
-
Three companies control 78 percent of the U.S. pasta market.
-
Three companies control 72 percent of the U.S. cereal market.
This concentration of power makes it more expensive for people to live and can definitely contribute to inflation. In a capitalistic society, it’s normally taboo to advocate for price caps, or restricting how much the prices can increase on things (and they come with their own issues, including market distortions, reduced investment, discouragement of competition, and the emergence of a black market). And, of course, companies do have to absorb rising input costs and pay their employees.
#2 The State of the Labor Market
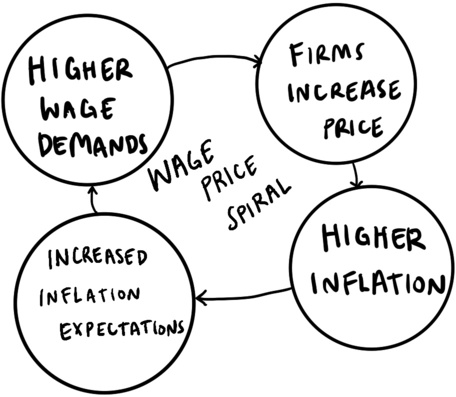
This is the second cause of inflation. I previously talked about wage-price spirals, the idea that workers are the ones who are causing inflation by asking for raises. Just to reiterate: People are the economy. The people doing the hard work in fields and construction sites and along waterways are the underlying force of our economy. They should be paid for the work they do, especially if companies are benefiting from rising prices.
However, this is not always possible since most workers are not in a position to demand higher wages. In 2022, the Bank for International Settlements published a paper exploring the possibility of a wage-price spiral, finding that “institutional changes also hint at an environment less conducive to wage-price spirals than in the past. In recent decades, workers’ collective bargaining power has declined alongside falling trade union membership…. Relatedly, the indexation and COLA clauses that fuelled past wage-price spirals are less prevalent.”
Due to the decline in union membership over the years, it’s more challenging for workers to demand higher wages. As a result, the traditional approach of employees seeking raises has become less common. Most people can’t just march into their boss’s office and ask for a raise.
Tactics such as “quiet quitting” (doing the job you were hired to do, no more and no less), demanding raises, and switching jobs all indicate a shift toward valuing workers. That said, when people demand higher wages, companies are “forced” to raise their prices to pay workers more, so goods and services become more expensive, resulting in people asking for even higher wages. This creates an endless loop of higher wages and higher prices, leading to a wage-price spiral in which:
-
Workers say, “Wow! Prices are super high! Please pay us more.”
-
The company says, “Okay, we get that, sure.”
-
The company raises its prices to offset the cost of higher wages for its employees.
-
Rinse and repeat.
But Lael Brainard, a former vice chair of the Federal Reserve, pointed out that this could be more of a price-price spiral—driven not by wages but by companies hiking prices. As she said:
Retail markups in a number of sectors have seen material increases in what could be described as a price-price spiral, whereby final prices have risen by more than the increases in input prices. The compression of these markups as supply constraints ease, inventories rise, and demand cools could contribute to disinflationary pressures.
Companies made all sorts of excuses to raise prices during the pandemic and afterward. The rough state of the labor market and price hikes are intertwined in that inflation narrative.
#3 Globalization
Globalization is the force that has enabled so many economies to prosper during the past few decades. It has facilitated greater trade, flow of money, idea exchange, and population movement, all of which contributed to bolstering global supply chains and competition. But now, everyone is freaking out in the postcovid era, which makes sense. There is talk of “reshoring”—bringing manufacturing back to one’s own country—and “friendshoring”—shifting trade to politically aligned nations—that is reversing the global trade patterns that have existed since the end of the Cold War. This is a double-edged sword.
If countries such as the United States were to no longer participate in globalization activities, it would have significant implications domestically and for the entire world.
On one hand, globalization has allowed countries to leverage their comparative advantages in various industries. For instance, the United States has excelled in technology and innovation, while other countries, like China (a production powerhouse), specialize in manufacturing or agriculture. By trading and collaborating globally, economies have benefited from these specialized skills, leading to increased economic growth. Each country focuses on what it is best at producing, and then trades what they make with other countries that produce what they do not produce a lot of. Undoing globalization could disrupt these trade relationships and hinder overall economic efficiency, as countries cannot independently and domestically produce all of the goods they consume.
Imagine if Japan—a country that heavily relies on imports to sustain itself—suddenly stopped importing cotton, timber, uranium (for nuclear power), oil, dairy, and beef. As there is limited domestic supply of these resources, its entire textile (clothing) production, energy supply, and the delicious beef ramen and Japanese cheesecake industry would collapse—a mess that would unravel the entire Japanese economy and cause societal distress.
On the other hand, undoing globalization could provide countries with greater control over their supply chains. The covid-19 pandemic exposed vulnerabilities in supply chains, particularly in critical sectors such as medical equipment and pharmaceuticals. Reversing globalization could allow nations to bring essential production processes back within their borders. This would reduce dependence on foreign imports during emergencies, an instrumental factor for managing inflation amid global crises—a pretty good thing!
#4 Energy Markets
In 2022, Europe felt the consequences of the global energy supply chain breakdown when Russia invaded Ukraine. Europe imposed heavy trade sanctions on Russia to condemn the attack, which resulted in Europe getting cut off from a key source of energy—liquefied natural gas (LNG). This was very concerning as 40% of natural gas and 25% of oil imported into the EU was from Russia—not to mention that 40% of residential heating used Russian gas. Germany, in particular, heavily relied on the Nord Stream pipeline, which connected Russia and Germany underground through the Baltic Sea. This led to higher inflation and the European energy crisis.
Being a preeminent global LNG exporter and the largest energy partner of the EU, the United States rapidly responded to the crisis by tripling LNG exports to the EU in 2022 and enforcing additional export sanctions on Russia. As a result, the EU became the largest importer of U.S. LNG exports, constituting more than half of traded U.S. LNG at 52%. However, the entire process was still difficult to achieve and buried under a lot of bureaucracy and geopolitical tension. As we know, energy is the common denominator of economic activity, and when energy prices are high, everything hurts (economic frostbite!).
In summary, as Jerome Powell said in 2022, “I think we now understand better how little we understand about inflation.” The certainty is being uncertain.
Other Types of Flations
Deflation
But we also have to be wary of deflation, the opposite of inflation. This is when the prices of goods and services fall, which sounds okay! Who wouldn’t want things to be cheaper, right?
Right. But also wrong. Deflation is harmful to the economy in the long term in the same way that high inflation is harmful. It discourages spending and investment because people are like, “The thing I want to buy will be cheaper tomorrow, so I’ll wait until then,” and then tomorrow never comes. It can lead to lower economic growth because the demand for goods and services falls as people sit on their hands instead of spending money, which can lead to higher unemployment rates as companies say, “No one is buying our stuff! Goodbye, employees.” Lower incomes and decreased economic activity put pressure on everyone.
Furthermore, deflation also can increase the real burden of debt! Which isn’t great. If you borrow $50,000 to buy a house when inflation is at the Fed’s target of 2 percent and then deflation hits and takes the inflation rate to −2 percent, that’s a 4 percentage point change in the inflation rate—and a 4 percent increase in the real value of the debt that you took out for your house. Each dollar of those $50,000 is now more valuable in real terms because of deflation, which makes it more difficult to pay back that debt.
So, yeah, it’s like Goldilocks: There needs to be just enough inflation to keep the global economy running and people happy. And the “keeping people happy” part is key! A lot of the success of a policy depends on people believing in the policy. The Federal Reserve’s credibility is one of its most powerful assets. If it loses that, its job will become infinitely harder.
Hyperinflation
What happened in the Weimar Republic, the post–World War I successor of the German Empire, in the 1920s, is a great example of the importance of maintaining fiscal credibility—and the havoc that ensues when credibility is lost.
From 1921 to 1923, the Weimar Republic—now modern-day Germany—experienced hyperinflation. This is when inflation gets completely out of control and prices rise uncontrollably. A cup of coffee could cost $1 at 8:00 a.m. and $4.50 at 9:00 a.m.—hourly price increases in the hundreds or thousands of percent.
The German Empire had funded World War I through borrowing and was saddled with a massive amount of debt when it lost. The Treaty of Versailles—which formally ended WWI—imposed a huge reparations debt on the Weimar Republic that could be paid only in gold or foreign currency. In order to pay these debts, the government decided to print a lot of money (number one no-no in economics), leading to hyperinflation and uncontrollable price increases. At the peak of hyperinflation, the country was experiencing approximately 29,500 percent inflation per month and the deutsche mark was worth one-trillionth of its original value. It was worth so little that Germans were burning the deutsche mark instead of wood to stay warm.
Inflation was fine with politicians because it kept unemployment low. The Germans were happy (for a bit); the German stock market tripled (until it fell by 97 percent in 1922). People started taking out money; they figured they might as well buy a place to live (a hard asset) with the depreciating currency and have their debt inflated away.
But the war debts still had to be repaid. As the government continued to print more money to repay its debts, tax revenues fell to zero, and the government had become illegitimate in the eyes of the people. The citizens didn’t want to pay their taxes, because why would they pay money to a government that no longer worked? The government responded by issuing more bonds and printing even more money, which only exacerbated the problem. People realized that their money was rapidly losing value, so they tried to spend it quickly, leading to even higher prices and a vicious cycle of inflation.
The loop was broken when farmers stopped accepting the inflated currency for their crops.
Hyperinflation “works” only when a currency is considered viable; once farmers, the people who feed us, strike, game over. The connectors—consumers and businesses—have to play the game in order for the game to work. In 1923, the Weimar Republic changed its currency to the rentenmark, which was backed by bonds indexed to gold. The government had to revalue the currency, pay some more reparations, and reissue government bonds.
However, the main problem was the loss of government credibility, and the government using inflation as a way to pay for its functionality. This underscores the importance of monetary policy in maintaining balance in the economy and how consumers and businesses need to be involved for such a policy to work. Even the best policies and technology can’t fix a broken system if the people involved stop participating.
This happens in the modern day, too. Zimbabwe’s hyperinflation in the early 2000s offers another dramatic example. It was a period when the government’s excessive money printing in response to an economic crisis resulted in astronomical inflation rates, peaking at an almost unfathomable 79.6 billion percent month-on-month increase in mid-November 2008.
Argentina has been plagued by recurring cycles of hyperinflation, notably during the late 1980s and early 1990s. One of the most severe instances occurred in 1989, when the annual inflation rate surged to over 3,000 percent, primarily due to excessive money printing and fiscal mismanagement. This period was characterized by rapid devaluation of the Argentine peso, skyrocketing prices, and widespread economic instability that severely impacted the living standards of Argentinians.
We are all a part of the puzzle, for better or for worse, and that’s especially true for how we manage and deal with inflation.